Arch Hardware Trends (Desktops)
A project to identify most popular hardware characteristics and track their change over time based on data collected by Arch users at https://Linux-Hardware.org.
Anyone can contribute to this report by the hw-probe tool:
sudo -E hw-probe -all -uploadFull-feature report is available here: https://linux-hardware.org/?view=trends
Period: Feb, 2022.
Contents
System
OS
Installed operating systems


| Name | Desktops | Percent |
|---|---|---|
| Arch | 33 | 63.46% |
| Arch Rolling | 19 | 36.54% |
OS Family
OS without a version


| Name | Desktops | Percent |
|---|---|---|
| Arch | 52 | 100% |
Kernel
Version of the Linux kernel


| Version | Desktops | Percent |
|---|---|---|
| 5.16.8-arch1-1 | 6 | 11.54% |
| 5.16.5-arch1-1 | 4 | 7.69% |
| 5.16.10-arch1-1 | 4 | 7.69% |
| 5.16.9-arch1-1 | 3 | 5.77% |
| 5.16.8-zen1-1-zen | 3 | 5.77% |
| 5.16.4-arch1-1 | 2 | 3.85% |
| 5.16.3-arch1-1 | 2 | 3.85% |
| 5.16.11-arch1-1 | 2 | 3.85% |
| 5.16.10-zen1-1-zen | 2 | 3.85% |
| 5.15.23-2-lts | 2 | 3.85% |
| 5.15.21-1-lts | 2 | 3.85% |
| 5.3.7-gentoo-gb08f327-dirty | 1 | 1.92% |
| 5.17.0-rc5-246-tkg-pds | 1 | 1.92% |
| 5.16.9-zen1-1-zen | 1 | 1.92% |
| 5.16.9-247-tkg-bmq | 1 | 1.92% |
| 5.16.7-arch1-1 | 1 | 1.92% |
| 5.16.5-zen1-1-zen | 1 | 1.92% |
| 5.16.4-zen1-1-zen | 1 | 1.92% |
| 5.16.4-242-tkg-pds | 1 | 1.92% |
| 5.16.3-zen1-1-zen | 1 | 1.92% |
| 5.16.2-arch1-1 | 1 | 1.92% |
| 5.16.11-zen1-1-zen | 1 | 1.92% |
| 5.16.11-1-cachyos-bmq-lto | 1 | 1.92% |
| 5.15.24-1-lts | 1 | 1.92% |
| 5.15.22-xanmod1-tt-1 | 1 | 1.92% |
| 5.15.22-xanmod1-1 | 1 | 1.92% |
| 5.15.22-1-lts | 1 | 1.92% |
| 5.15.10-arch1-1 | 1 | 1.92% |
| 5.14.16-arch1-1 | 1 | 1.92% |
| 5.13.2-180-tkg-pds | 1 | 1.92% |
| 4.19.226-1-lts419 | 1 | 1.92% |
Kernel Family
Linux kernel without a distro release


| Version | Desktops | Percent |
|---|---|---|
| 5.16.8 | 9 | 17.31% |
| 5.16.10 | 6 | 11.54% |
| 5.16.9 | 5 | 9.62% |
| 5.16.5 | 5 | 9.62% |
| 5.16.4 | 4 | 7.69% |
| 5.16.11 | 4 | 7.69% |
| 5.16.3 | 3 | 5.77% |
| 5.15.22 | 3 | 5.77% |
| 5.15.23 | 2 | 3.85% |
| 5.15.21 | 2 | 3.85% |
| 5.3.7 | 1 | 1.92% |
| 5.17.0 | 1 | 1.92% |
| 5.16.7 | 1 | 1.92% |
| 5.16.2 | 1 | 1.92% |
| 5.15.24 | 1 | 1.92% |
| 5.15.10 | 1 | 1.92% |
| 5.14.16 | 1 | 1.92% |
| 5.13.2 | 1 | 1.92% |
| 4.19.226 | 1 | 1.92% |
Kernel Major Ver.
Linux kernel major version


| Version | Desktops | Percent |
|---|---|---|
| 5.16 | 38 | 73.08% |
| 5.15 | 9 | 17.31% |
| 5.3 | 1 | 1.92% |
| 5.17 | 1 | 1.92% |
| 5.14 | 1 | 1.92% |
| 5.13 | 1 | 1.92% |
| 4.19 | 1 | 1.92% |
Arch
OS architecture (x86_64, i586, etc.)


| Name | Desktops | Percent |
|---|---|---|
| x86_64 | 52 | 100% |
DE
Desktop Environment


| Name | Desktops | Percent |
|---|---|---|
| KDE5 | 17 | 32.69% |
| GNOME | 15 | 28.85% |
| XFCE | 7 | 13.46% |
| Unknown | 5 | 9.62% |
| i3 | 3 | 5.77% |
| X-Cinnamon | 1 | 1.92% |
| openbox | 1 | 1.92% |
| LXDE | 1 | 1.92% |
| Cinnamon | 1 | 1.92% |
| awesome | 1 | 1.92% |
Display Server
X11 or Wayland


| Name | Desktops | Percent |
|---|---|---|
| X11 | 36 | 69.23% |
| Wayland | 6 | 11.54% |
| Unknown | 6 | 11.54% |
| Tty | 4 | 7.69% |
Display Manager
SDDM, LightDM, etc.


| Name | Desktops | Percent |
|---|---|---|
| Unknown | 18 | 34.62% |
| SDDM | 11 | 21.15% |
| GDM | 9 | 17.31% |
| LightDM | 8 | 15.38% |
| Ly | 3 | 5.77% |
| LXDM | 3 | 5.77% |
OS Lang
Language


| Lang | Desktops | Percent |
|---|---|---|
| en_US | 30 | 57.69% |
| de_DE | 8 | 15.38% |
| pl_PL | 2 | 3.85% |
| it_IT | 2 | 3.85% |
| en_IN | 2 | 3.85% |
| en_GB | 2 | 3.85% |
| Unknown | 2 | 3.85% |
| tr_TR | 1 | 1.92% |
| ru_RU | 1 | 1.92% |
| de_AT | 1 | 1.92% |
| C | 1 | 1.92% |
Boot Mode
EFI or BIOS


| Mode | Desktops | Percent |
|---|---|---|
| EFI | 33 | 63.46% |
| BIOS | 19 | 36.54% |
Filesystem
Type of filesystem


| Type | Desktops | Percent |
|---|---|---|
| Ext4 | 31 | 59.62% |
| Btrfs | 18 | 34.62% |
| Overlay | 2 | 3.85% |
| Zfs | 1 | 1.92% |
Part. scheme
Scheme of partitioning


| Type | Desktops | Percent |
|---|---|---|
| GPT | 33 | 63.46% |
| Unknown | 14 | 26.92% |
| MBR | 5 | 9.62% |
Dual Boot with Linux/BSD
Hosting more than one Linux/BSD


| Dual boot | Desktops | Percent |
|---|---|---|
| No | 45 | 86.54% |
| Yes | 7 | 13.46% |
Dual Boot (Win)
Hosting Linux and Windows


| Dual boot | Desktops | Percent |
|---|---|---|
| No | 32 | 61.54% |
| Yes | 20 | 38.46% |
Board
Vendor
Motherboard manufacturer


| Name | Desktops | Percent |
|---|---|---|
| ASUSTek Computer | 11 | 21.15% |
| Gigabyte Technology | 10 | 19.23% |
| ASRock | 10 | 19.23% |
| MSI | 9 | 17.31% |
| Hewlett-Packard | 5 | 9.62% |
| Dell | 4 | 7.69% |
| Unknown | 2 | 3.85% |
| Notebook | 1 | 1.92% |
Model
Motherboard model


| Name | Desktops | Percent |
|---|---|---|
| ASRock B450M-HDV R4.0 | 2 | 3.85% |
| Unknown | 2 | 3.85% |
| Notebook P15SM-A | 1 | 1.92% |
| MSI MS-7D14 | 1 | 1.92% |
| MSI MS-7D08 | 1 | 1.92% |
| MSI MS-7C91 | 1 | 1.92% |
| MSI MS-7C82 | 1 | 1.92% |
| MSI MS-7C56 | 1 | 1.92% |
| MSI MS-7B89 | 1 | 1.92% |
| MSI MS-7B86 | 1 | 1.92% |
| MSI MS-7A38 | 1 | 1.92% |
| MSI MS-7721 | 1 | 1.92% |
| HP Z840 Workstation | 1 | 1.92% |
| HP Pavilion Gaming Desktop TG01-2xxx | 1 | 1.92% |
| HP EliteDesk 800 G1 TWR | 1 | 1.92% |
| HP Desktop M01-F1xxx | 1 | 1.92% |
| HP 500-305nr | 1 | 1.92% |
| Gigabyte Z97-HD3 | 1 | 1.92% |
| Gigabyte Z87X-UD3H | 1 | 1.92% |
| Gigabyte Z77M-D3H | 1 | 1.92% |
| Gigabyte P31-ES3G | 1 | 1.92% |
| Gigabyte H270-Gaming 3 | 1 | 1.92% |
| Gigabyte GB-BACE-3160 | 1 | 1.92% |
| Gigabyte B550M AORUS PRO-P | 1 | 1.92% |
| Gigabyte B450M DS3H V2 | 1 | 1.92% |
| Gigabyte B450 AORUS M | 1 | 1.92% |
| Gigabyte B360M-D2V | 1 | 1.92% |
| Dell OptiPlex 9020 | 1 | 1.92% |
| Dell OptiPlex 7010 | 1 | 1.92% |
| Dell OptiPlex 5050 | 1 | 1.92% |
| Dell Inspiron 3268 | 1 | 1.92% |
| ASUS TUF Z390M-PRO GAMING | 1 | 1.92% |
| ASUS ROG STRIX Z590-E GAMING WIFI | 1 | 1.92% |
| ASUS ROG STRIX B450-F GAMING | 1 | 1.92% |
| ASUS ROG CROSSHAIR VIII DARK HERO | 1 | 1.92% |
| ASUS PRIME H510M-E | 1 | 1.92% |
| ASUS PRIME B550M-A | 1 | 1.92% |
| ASUS PRIME B460-PLUS | 1 | 1.92% |
| ASUS PRIME B450M-A | 1 | 1.92% |
| ASUS P8H61-M LX3 R2.0 | 1 | 1.92% |
| ASUS H110M-R | 1 | 1.92% |
| ASUS All Series | 1 | 1.92% |
| ASRock X99 Taichi | 1 | 1.92% |
| ASRock X370 Gaming X | 1 | 1.92% |
| ASRock QC5000M-ITX/PH | 1 | 1.92% |
| ASRock J4205-ITX | 1 | 1.92% |
| ASRock B450 Gaming K4 | 1 | 1.92% |
| ASRock AB350M-HDV | 1 | 1.92% |
| ASRock A75 Extreme6 | 1 | 1.92% |
| ASRock A300M-STX | 1 | 1.92% |
Model Family
Motherboard model prefix


| Name | Desktops | Percent |
|---|---|---|
| ASUS PRIME | 4 | 7.69% |
| Dell OptiPlex | 3 | 5.77% |
| ASUS ROG | 3 | 5.77% |
| ASRock B450M-HDV | 2 | 3.85% |
| Unknown | 2 | 3.85% |
| Notebook P15SM-A | 1 | 1.92% |
| MSI MS-7D14 | 1 | 1.92% |
| MSI MS-7D08 | 1 | 1.92% |
| MSI MS-7C91 | 1 | 1.92% |
| MSI MS-7C82 | 1 | 1.92% |
| MSI MS-7C56 | 1 | 1.92% |
| MSI MS-7B89 | 1 | 1.92% |
| MSI MS-7B86 | 1 | 1.92% |
| MSI MS-7A38 | 1 | 1.92% |
| MSI MS-7721 | 1 | 1.92% |
| HP Z840 | 1 | 1.92% |
| HP Pavilion | 1 | 1.92% |
| HP EliteDesk | 1 | 1.92% |
| HP Desktop | 1 | 1.92% |
| HP 500-305nr | 1 | 1.92% |
| Gigabyte Z97-HD3 | 1 | 1.92% |
| Gigabyte Z87X-UD3H | 1 | 1.92% |
| Gigabyte Z77M-D3H | 1 | 1.92% |
| Gigabyte P31-ES3G | 1 | 1.92% |
| Gigabyte H270-Gaming | 1 | 1.92% |
| Gigabyte GB-BACE-3160 | 1 | 1.92% |
| Gigabyte B550M | 1 | 1.92% |
| Gigabyte B450M | 1 | 1.92% |
| Gigabyte B450 | 1 | 1.92% |
| Gigabyte B360M-D2V | 1 | 1.92% |
| Dell Inspiron | 1 | 1.92% |
| ASUS TUF | 1 | 1.92% |
| ASUS P8H61-M | 1 | 1.92% |
| ASUS H110M-R | 1 | 1.92% |
| ASUS All | 1 | 1.92% |
| ASRock X99 | 1 | 1.92% |
| ASRock X370 | 1 | 1.92% |
| ASRock QC5000M-ITX | 1 | 1.92% |
| ASRock J4205-ITX | 1 | 1.92% |
| ASRock B450 | 1 | 1.92% |
| ASRock AB350M-HDV | 1 | 1.92% |
| ASRock A75 | 1 | 1.92% |
| ASRock A300M-STX | 1 | 1.92% |
MFG Year
Motherboard manufacture year


| Year | Desktops | Percent |
|---|---|---|
| 2018 | 11 | 21.15% |
| 2020 | 8 | 15.38% |
| 2021 | 6 | 11.54% |
| 2019 | 5 | 9.62% |
| 2016 | 5 | 9.62% |
| 2013 | 5 | 9.62% |
| 2017 | 3 | 5.77% |
| 2014 | 3 | 5.77% |
| 2012 | 3 | 5.77% |
| 2015 | 2 | 3.85% |
| 2008 | 1 | 1.92% |
Form Factor
Physical design of the computer


| Name | Desktops | Percent |
|---|---|---|
| Desktop | 52 | 100% |
Secure Boot
Enabled or disabled


| State | Desktops | Percent |
|---|---|---|
| Disabled | 51 | 98.08% |
| Enabled | 1 | 1.92% |
Coreboot
Have coreboot on board


| Used | Desktops | Percent |
|---|---|---|
| No | 52 | 100% |
RAM Size
Total RAM memory


| Size in GB | Desktops | Percent |
|---|---|---|
| 16.01-24.0 | 22 | 42.31% |
| 32.01-64.0 | 10 | 19.23% |
| 4.01-8.0 | 8 | 15.38% |
| 8.01-16.0 | 6 | 11.54% |
| 3.01-4.0 | 2 | 3.85% |
| 24.01-32.0 | 2 | 3.85% |
| More than 256.0 | 1 | 1.92% |
| 64.01-256.0 | 1 | 1.92% |
RAM Used
Used RAM memory


| Used GB | Desktops | Percent |
|---|---|---|
| 1.01-2.0 | 12 | 23.08% |
| 2.01-3.0 | 11 | 21.15% |
| 4.01-8.0 | 10 | 19.23% |
| 3.01-4.0 | 10 | 19.23% |
| 8.01-16.0 | 7 | 13.46% |
| 0.51-1.0 | 2 | 3.85% |
Total Drives
Number of drives on board


| Drives | Desktops | Percent |
|---|---|---|
| 1 | 16 | 30.77% |
| 2 | 14 | 26.92% |
| 3 | 10 | 19.23% |
| 4 | 4 | 7.69% |
| 7 | 2 | 3.85% |
| 6 | 2 | 3.85% |
| 5 | 2 | 3.85% |
| 11 | 1 | 1.92% |
| 9 | 1 | 1.92% |
Has CD-ROM
Has CD-ROM on board


| Presented | Desktops | Percent |
|---|---|---|
| No | 36 | 69.23% |
| Yes | 16 | 30.77% |
Has Ethernet
Has Ethernet on board


| Presented | Desktops | Percent |
|---|---|---|
| Yes | 51 | 98.08% |
| No | 1 | 1.92% |
Has WiFi
Has WiFi module


| Presented | Desktops | Percent |
|---|---|---|
| No | 29 | 55.77% |
| Yes | 23 | 44.23% |
Has Bluetooth
Has Bluetooth module


| Presented | Desktops | Percent |
|---|---|---|
| Yes | 28 | 53.85% |
| No | 24 | 46.15% |
Location
Country
Geographic location (country)


| Country | Desktops | Percent |
|---|---|---|
| USA | 8 | 15.38% |
| Germany | 8 | 15.38% |
| Russia | 4 | 7.69% |
| Poland | 4 | 7.69% |
| UK | 3 | 5.77% |
| Italy | 3 | 5.77% |
| Lithuania | 2 | 3.85% |
| India | 2 | 3.85% |
| Brazil | 2 | 3.85% |
| Belgium | 2 | 3.85% |
| Bangladesh | 2 | 3.85% |
| Ukraine | 1 | 1.92% |
| Turkey | 1 | 1.92% |
| Slovakia | 1 | 1.92% |
| Saudi Arabia | 1 | 1.92% |
| Netherlands | 1 | 1.92% |
| Iran | 1 | 1.92% |
| Greece | 1 | 1.92% |
| France | 1 | 1.92% |
| Finland | 1 | 1.92% |
| Chile | 1 | 1.92% |
| Canada | 1 | 1.92% |
| Austria | 1 | 1.92% |
City
Geographic location (city)


| City | Desktops | Percent |
|---|---|---|
| Berlin | 3 | 5.77% |
| Kaunas | 2 | 3.85% |
| Dhaka | 2 | 3.85% |
| Valencia | 1 | 1.92% |
| Turtleford | 1 | 1.92% |
| South Bank | 1 | 1.92% |
| Seattle | 1 | 1.92% |
| São Paulo | 1 | 1.92% |
| Santiago | 1 | 1.92% |
| Rzeszów | 1 | 1.92% |
| Roeselare | 1 | 1.92% |
| Riyadh | 1 | 1.92% |
| Orenburg | 1 | 1.92% |
| Oldham | 1 | 1.92% |
| Oklahoma City | 1 | 1.92% |
| Oakland | 1 | 1.92% |
| Nowogard | 1 | 1.92% |
| Niagara Falls | 1 | 1.92% |
| Naples | 1 | 1.92% |
| Mumbai | 1 | 1.92% |
| Moscow | 1 | 1.92% |
| Mococa | 1 | 1.92% |
| Milan | 1 | 1.92% |
| Mielec | 1 | 1.92% |
| Menden | 1 | 1.92% |
| Martin | 1 | 1.92% |
| Mansfield | 1 | 1.92% |
| Lyon | 1 | 1.92% |
| Lochristi | 1 | 1.92% |
| Lekkerkerk | 1 | 1.92% |
| Krasnodar | 1 | 1.92% |
| Karlsruhe | 1 | 1.92% |
| Istanbul | 1 | 1.92% |
| Ioannina | 1 | 1.92% |
| Hanover | 1 | 1.92% |
| Griesheim | 1 | 1.92% |
| Genoa | 1 | 1.92% |
| Feldkirch | 1 | 1.92% |
| Essen | 1 | 1.92% |
| Espoo | 1 | 1.92% |
| Dublin | 1 | 1.92% |
| Delhi | 1 | 1.92% |
| Czapury | 1 | 1.92% |
| Chervonohrad | 1 | 1.92% |
| Bratsk | 1 | 1.92% |
| Bloomington | 1 | 1.92% |
| Arak | 1 | 1.92% |
| Anaheim | 1 | 1.92% |
Drives
Drive Vendor
Hard drive vendors


| Vendor | Desktops | Drives | Percent |
|---|---|---|---|
| Samsung Electronics | 25 | 33 | 22.52% |
| Seagate | 23 | 38 | 20.72% |
| WDC | 18 | 21 | 16.22% |
| Kingston | 7 | 7 | 6.31% |
| Crucial | 6 | 6 | 5.41% |
| A-DATA Technology | 6 | 6 | 5.41% |
| Toshiba | 5 | 5 | 4.5% |
| SanDisk | 4 | 10 | 3.6% |
| Intel | 3 | 3 | 2.7% |
| Transcend | 1 | 1 | 0.9% |
| TEUTONS | 1 | 1 | 0.9% |
| Realtek Semiconductor | 1 | 1 | 0.9% |
| PNY | 1 | 1 | 0.9% |
| PLEXTOR | 1 | 1 | 0.9% |
| Phison | 1 | 1 | 0.9% |
| Micron Technology | 1 | 1 | 0.9% |
| Lexar | 1 | 1 | 0.9% |
| KIOXIA | 1 | 1 | 0.9% |
| Intenso | 1 | 1 | 0.9% |
| Hitachi | 1 | 1 | 0.9% |
| HGST | 1 | 2 | 0.9% |
| GOODRAM | 1 | 1 | 0.9% |
| Corsair | 1 | 1 | 0.9% |
Drive Model
Hard drive models


| Model | Desktops | Percent |
|---|---|---|
| Seagate ST2000DM008-2FR102 2TB | 4 | 3.1% |
| Seagate ST1000DM010-2EP102 1TB | 4 | 3.1% |
| Seagate ST500DM002-1BD142 500GB | 3 | 2.33% |
| WDC WD20EFRX-68EUZN0 2TB | 2 | 1.55% |
| WDC WD10EZEX-08WN4A0 1TB | 2 | 1.55% |
| WDC WD10EARS-00Y5B1 1TB | 2 | 1.55% |
| WDC WD10EADS-00M2B0 1TB | 2 | 1.55% |
| Toshiba HDWD110 1TB | 2 | 1.55% |
| Seagate ST1000DM003-1CH162 1TB | 2 | 1.55% |
| Samsung SSD 980 1TB | 2 | 1.55% |
| Samsung SSD 970 EVO Plus 1TB | 2 | 1.55% |
| Samsung SSD 860 EVO 1TB | 2 | 1.55% |
| Samsung HD502HJ 500GB | 2 | 1.55% |
| Kingston SV300S37A120G 120GB SSD | 2 | 1.55% |
| WDC WDS500G3X0C-00SJG0 500GB | 1 | 0.78% |
| WDC WDS500G2B0A-00SM50 500GB SSD | 1 | 0.78% |
| WDC WDS100T2B0B-00YS70 1TB SSD | 1 | 0.78% |
| WDC WD60EZAZ-00SF3B0 6TB | 1 | 0.78% |
| WDC WD5000AZLX-75K2TA0 500GB | 1 | 0.78% |
| WDC WD5000AAKX-75U6AA0 500GB | 1 | 0.78% |
| WDC WD40EZRZ-00WN9B0 4TB | 1 | 0.78% |
| WDC WD20EZRX-19D8PB0 2TB | 1 | 0.78% |
| WDC WD20EZRX-00D8PB0 2TB | 1 | 0.78% |
| WDC WD20EZAZ-00L9GB0 2TB | 1 | 0.78% |
| WDC WD20EURS-63S48Y0 2TB | 1 | 0.78% |
| WDC WD10EZEX-08M2NA0 1TB | 1 | 0.78% |
| Transcend TS256GMSA230S 256GB SSD | 1 | 0.78% |
| Toshiba HDWF180 8TB | 1 | 0.78% |
| Toshiba DT01ACA200 2TB | 1 | 0.78% |
| Toshiba DT01ACA100 1TB | 1 | 0.78% |
| TEUTONS SSD 256GB | 1 | 0.78% |
| Seagate ST9640320AS 640GB | 1 | 0.78% |
| Seagate ST8000VX004-2M1101 8TB | 1 | 0.78% |
| Seagate ST750LX003-1AC154 752GB | 1 | 0.78% |
| Seagate ST4000DM004-2CV104 4TB | 1 | 0.78% |
| Seagate ST3500418AS 500GB | 1 | 0.78% |
| Seagate ST3000VN000-1HJ166 3TB | 1 | 0.78% |
| Seagate ST3000NM0023 3TB | 1 | 0.78% |
| Seagate ST2000NM0023 2TB | 1 | 0.78% |
| Seagate ST2000LX001-1RG174 2TB | 1 | 0.78% |
| Seagate ST2000LM007-1R8174 2TB | 1 | 0.78% |
| Seagate ST2000DM006-2DM164 2TB | 1 | 0.78% |
| Seagate ST2000DM001-1CH164 2TB | 1 | 0.78% |
| Seagate ST16000NM001G-2KK103 16TB | 1 | 0.78% |
| Seagate ST1000VM002-1ET162 1TB | 1 | 0.78% |
| Seagate ST1000DM003-1SB10C 1TB | 1 | 0.78% |
| Seagate ST1000DL002-9TT153 1TB | 1 | 0.78% |
| Seagate One Touch SSD 500GB | 1 | 0.78% |
| Seagate FireCuda 530 ZP500GM30013 500GB | 1 | 0.78% |
| Seagate Backup+ Hub BK 8TB | 1 | 0.78% |
| SanDisk SDSSDXPS240G 240GB | 1 | 0.78% |
| SanDisk SDSSDP064G 64GB | 1 | 0.78% |
| SanDisk SDSSDHP256G 256GB | 1 | 0.78% |
| SanDisk SD7UB2Q512G1122 512GB SSD | 1 | 0.78% |
| SanDisk SD6SB2M512G1022I 512GB SSD | 1 | 0.78% |
| Sandisk NVMe SSD Drive 1TB | 1 | 0.78% |
| Samsung SSD 980 PRO 1TB | 1 | 0.78% |
| Samsung SSD 980 500GB | 1 | 0.78% |
| Samsung SSD 970 EVO Plus 500GB | 1 | 0.78% |
| Samsung SSD 970 EVO Plus 2TB | 1 | 0.78% |
HDD Vendor
Hard disk drive vendors


| Vendor | Desktops | Drives | Percent |
|---|---|---|---|
| Seagate | 23 | 36 | 45.1% |
| WDC | 15 | 18 | 29.41% |
| Samsung Electronics | 6 | 7 | 11.76% |
| Toshiba | 5 | 5 | 9.8% |
| Hitachi | 1 | 1 | 1.96% |
| HGST | 1 | 2 | 1.96% |
SSD Vendor
Solid state drive vendors


| Vendor | Desktops | Drives | Percent |
|---|---|---|---|
| Samsung Electronics | 11 | 13 | 26.83% |
| Kingston | 6 | 6 | 14.63% |
| Crucial | 5 | 5 | 12.2% |
| A-DATA Technology | 5 | 5 | 12.2% |
| SanDisk | 3 | 9 | 7.32% |
| WDC | 2 | 2 | 4.88% |
| Intel | 2 | 2 | 4.88% |
| Transcend | 1 | 1 | 2.44% |
| TEUTONS | 1 | 1 | 2.44% |
| Seagate | 1 | 1 | 2.44% |
| PNY | 1 | 1 | 2.44% |
| Lexar | 1 | 1 | 2.44% |
| Intenso | 1 | 1 | 2.44% |
| Corsair | 1 | 1 | 2.44% |
Drive Kind
HDD or SSD


| Kind | Desktops | Drives | Percent |
|---|---|---|---|
| HDD | 39 | 69 | 41.94% |
| SSD | 33 | 49 | 35.48% |
| NVMe | 21 | 26 | 22.58% |
Drive Connector
SATA, SAS, NVMe, etc.


| Type | Desktops | Drives | Percent |
|---|---|---|---|
| SATA | 50 | 114 | 66.67% |
| NVMe | 21 | 26 | 28% |
| SAS | 4 | 4 | 5.33% |
Drive Size
Size of hard drive


| Size in TB | Desktops | Drives | Percent |
|---|---|---|---|
| 0.01-0.5 | 32 | 46 | 39.02% |
| 0.51-1.0 | 26 | 37 | 31.71% |
| 1.01-2.0 | 15 | 20 | 18.29% |
| 4.01-10.0 | 5 | 9 | 6.1% |
| 3.01-4.0 | 2 | 2 | 2.44% |
| 2.01-3.0 | 1 | 3 | 1.22% |
| 10.01-20.0 | 1 | 1 | 1.22% |
Space Total
Amount of disk space available on the file system


| Size in GB | Desktops | Percent |
|---|---|---|
| 1001-2000 | 13 | 25% |
| 501-1000 | 8 | 15.38% |
| 2001-3000 | 7 | 13.46% |
| More than 3000 | 6 | 11.54% |
| 251-500 | 6 | 11.54% |
| 101-250 | 6 | 11.54% |
| Unknown | 3 | 5.77% |
| 51-100 | 2 | 3.85% |
| 1-20 | 1 | 1.92% |
Space Used
Amount of used disk space


| Used GB | Desktops | Percent |
|---|---|---|
| 501-1000 | 10 | 19.23% |
| 251-500 | 7 | 13.46% |
| 21-50 | 7 | 13.46% |
| 101-250 | 7 | 13.46% |
| 51-100 | 6 | 11.54% |
| 1001-2000 | 4 | 7.69% |
| More than 3000 | 3 | 5.77% |
| 1-20 | 3 | 5.77% |
| Unknown | 3 | 5.77% |
| 2001-3000 | 2 | 3.85% |
Malfunc. Drives
Drive models with a malfunction


| Model | Desktops | Drives | Percent |
|---|---|---|---|
| WDC WD20EFRX-68EUZN0 2TB | 1 | 2 | 16.67% |
| WDC WD10EADS-00M2B0 1TB | 1 | 1 | 16.67% |
| Seagate ST3500418AS 500GB | 1 | 2 | 16.67% |
| Seagate ST2000LM007-1R8174 2TB | 1 | 1 | 16.67% |
| Samsung Electronics HD502HI 500GB | 1 | 1 | 16.67% |
| PLEXTOR PX-1TM8SeG 1TB | 1 | 1 | 16.67% |
Malfunc. Drive Vendor
Vendors of faulty drives


| Vendor | Desktops | Drives | Percent |
|---|---|---|---|
| WDC | 2 | 3 | 33.33% |
| Seagate | 2 | 3 | 33.33% |
| Samsung Electronics | 1 | 1 | 16.67% |
| PLEXTOR | 1 | 1 | 16.67% |
Malfunc. HDD Vendor
Vendors of faulty HDD drives


| Vendor | Desktops | Drives | Percent |
|---|---|---|---|
| WDC | 2 | 3 | 40% |
| Seagate | 2 | 3 | 40% |
| Samsung Electronics | 1 | 1 | 20% |
Malfunc. Drive Kind
Kinds of faulty drives


| Kind | Desktops | Drives | Percent |
|---|---|---|---|
| HDD | 4 | 7 | 80% |
| NVMe | 1 | 1 | 20% |
Failed Drives
Failed drive models
Zero info for selected period =(
Failed Drive Vendor
Failed drive vendors
Zero info for selected period =(
Drive Status
Number of failed and malfunc. drives


| Status | Desktops | Drives | Percent |
|---|---|---|---|
| Works | 28 | 77 | 49.12% |
| Detected | 24 | 59 | 42.11% |
| Malfunc | 5 | 8 | 8.77% |
Storage controller
Storage Vendor
Storage controller vendors


| Vendor | Desktops | Percent |
|---|---|---|
| Intel | 28 | 32.94% |
| AMD | 24 | 28.24% |
| Samsung Electronics | 11 | 12.94% |
| Marvell Technology Group | 4 | 4.71% |
| ASMedia Technology | 4 | 4.71% |
| Sandisk | 2 | 2.35% |
| Realtek Semiconductor | 2 | 2.35% |
| Broadcom / LSI | 2 | 2.35% |
| Toshiba America Info Systems | 1 | 1.18% |
| Shenzhen Longsys Electronics | 1 | 1.18% |
| Seagate Technology | 1 | 1.18% |
| Phison Electronics | 1 | 1.18% |
| Micron/Crucial Technology | 1 | 1.18% |
| Micron Technology | 1 | 1.18% |
| Lite-On Technology | 1 | 1.18% |
| Kingston Technology Company | 1 | 1.18% |
Storage Model
Storage controller models


| Model | Desktops | Percent |
|---|---|---|
| AMD FCH SATA Controller [AHCI mode] | 12 | 12.37% |
| AMD 400 Series Chipset SATA Controller | 12 | 12.37% |
| Samsung NVMe SSD Controller SM981/PM981/PM983 | 6 | 6.19% |
| Intel 8 Series/C220 Series Chipset Family 6-port SATA Controller 1 [AHCI mode] | 5 | 5.15% |
| AMD Starship/Matisse Chipset SATA Controller [AHCI mode] | 5 | 5.15% |
| Samsung NVMe SSD Controller 980 | 4 | 4.12% |
| Intel 500 Series Chipset Family SATA AHCI Controller | 3 | 3.09% |
| ASMedia ASM1062 Serial ATA Controller | 3 | 3.09% |
| Realtek RTS5763DL NVMe SSD Controller | 2 | 2.06% |
| Intel Q170/Q150/B150/H170/H110/Z170/CM236 Chipset SATA Controller [AHCI Mode] | 2 | 2.06% |
| Intel Cannon Lake PCH SATA AHCI Controller | 2 | 2.06% |
| Intel 9 Series Chipset Family SATA Controller [AHCI Mode] | 2 | 2.06% |
| Intel 7 Series/C210 Series Chipset Family 6-port SATA Controller [AHCI mode] | 2 | 2.06% |
| Intel 400 Series Chipset Family SATA AHCI Controller | 2 | 2.06% |
| Intel 200 Series PCH SATA controller [AHCI mode] | 2 | 2.06% |
| Toshiba America Info Systems BG3 NVMe SSD Controller | 1 | 1.03% |
| Shenzhen Longsys SM2263EN/SM2263XT-based OEM SSD | 1 | 1.03% |
| Seagate FireCuda 530 SSD | 1 | 1.03% |
| Sandisk WD Blue SN550 NVMe SSD | 1 | 1.03% |
| Sandisk WD Black 2018/SN750 / PC SN720 NVMe SSD | 1 | 1.03% |
| Samsung NVMe SSD Controller SM961/PM961/SM963 | 1 | 1.03% |
| Samsung NVMe SSD Controller SM951/PM951 | 1 | 1.03% |
| Samsung NVMe SSD Controller PM9A1/PM9A3/980PRO | 1 | 1.03% |
| Phison PS5013 E13 NVMe Controller | 1 | 1.03% |
| Micron/Crucial P2 NVMe PCIe SSD | 1 | 1.03% |
| Micron Non-Volatile memory controller | 1 | 1.03% |
| Marvell Group 88SE9230 PCIe 2.0 x2 4-port SATA 6 Gb/s RAID Controller | 1 | 1.03% |
| Marvell Group 88SE9172 SATA 6Gb/s Controller | 1 | 1.03% |
| Marvell Group 88SE9128 PCIe SATA 6 Gb/s RAID controller with HyperDuo | 1 | 1.03% |
| Marvell Group 88SE9128 PCIe SATA 6 Gb/s RAID controller | 1 | 1.03% |
| Lite-On Non-Volatile memory controller | 1 | 1.03% |
| Kingston Company A2000 NVMe SSD | 1 | 1.03% |
| Intel SSD 660P Series | 1 | 1.03% |
| Intel NM10/ICH7 Family SATA Controller [IDE mode] | 1 | 1.03% |
| Intel Celeron N3350/Pentium N4200/Atom E3900 Series SATA AHCI Controller | 1 | 1.03% |
| Intel C610/X99 series chipset sSATA Controller [RAID mode] | 1 | 1.03% |
| Intel C610/X99 series chipset 6-Port SATA Controller [AHCI mode] | 1 | 1.03% |
| Intel C600/X79 series chipset SATA RAID Controller | 1 | 1.03% |
| Intel C600/X79 series chipset 6-Port SATA AHCI Controller | 1 | 1.03% |
| Intel Atom/Celeron/Pentium Processor x5-E8000/J3xxx/N3xxx Series SATA Controller | 1 | 1.03% |
| Intel 6 Series/C200 Series Chipset Family 6 port Desktop SATA AHCI Controller | 1 | 1.03% |
| Broadcom / LSI SAS2308 PCI-Express Fusion-MPT SAS-2 | 1 | 1.03% |
| Broadcom / LSI MegaRAID SAS 2108 [Liberator] | 1 | 1.03% |
| ASMedia ASM1061 SATA IDE Controller | 1 | 1.03% |
| AMD X370 Series Chipset SATA Controller | 1 | 1.03% |
| AMD FCH SATA Controller [IDE mode] | 1 | 1.03% |
| AMD FCH IDE Controller | 1 | 1.03% |
| AMD 300 Series Chipset SATA Controller | 1 | 1.03% |
Storage Kind
Kind of storage controller (IDE, SATA, NVMe, SAS, ...)


| Kind | Desktops | Percent |
|---|---|---|
| SATA | 49 | 65.33% |
| NVMe | 21 | 28% |
| RAID | 2 | 2.67% |
| IDE | 2 | 2.67% |
| SAS | 1 | 1.33% |
Processor
CPU Vendor
Processor vendors


| Vendor | Desktops | Percent |
|---|---|---|
| Intel | 27 | 51.92% |
| AMD | 25 | 48.08% |
CPU Model
Processor models


| Model | Desktops | Percent |
|---|---|---|
| AMD Ryzen 5 3600 6-Core Processor | 5 | 9.62% |
| AMD Ryzen 5 5600X 6-Core Processor | 4 | 7.69% |
| AMD Ryzen 7 3700X 8-Core Processor | 2 | 3.85% |
| Intel Xeon CPU E5-2699 v3 @ 2.30GHz | 1 | 1.92% |
| Intel Xeon CPU E5-2683 v4 @ 2.10GHz | 1 | 1.92% |
| Intel Xeon CPU E5-1650 0 @ 3.20GHz | 1 | 1.92% |
| Intel Pentium CPU J4205 @ 1.50GHz | 1 | 1.92% |
| Intel Pentium CPU G4560 @ 3.50GHz | 1 | 1.92% |
| Intel Core i9-10850K CPU @ 3.60GHz | 1 | 1.92% |
| Intel Core i7-7700 CPU @ 3.60GHz | 1 | 1.92% |
| Intel Core i7-4790K CPU @ 4.00GHz | 1 | 1.92% |
| Intel Core i7-4770 CPU @ 3.40GHz | 1 | 1.92% |
| Intel Core i7-4710MQ CPU @ 2.50GHz | 1 | 1.92% |
| Intel Core i7-3770 CPU @ 3.40GHz | 1 | 1.92% |
| Intel Core i7-10700 CPU @ 2.90GHz | 1 | 1.92% |
| Intel Core i5-9600K CPU @ 3.70GHz | 1 | 1.92% |
| Intel Core i5-8500 CPU @ 3.00GHz | 1 | 1.92% |
| Intel Core i5-7500 CPU @ 3.40GHz | 1 | 1.92% |
| Intel Core i5-7400 CPU @ 3.00GHz | 1 | 1.92% |
| Intel Core i5-4590 CPU @ 3.30GHz | 1 | 1.92% |
| Intel Core i5-4570 CPU @ 3.20GHz | 1 | 1.92% |
| Intel Core i5-4460S CPU @ 2.90GHz | 1 | 1.92% |
| Intel Core i5-4460 CPU @ 3.20GHz | 1 | 1.92% |
| Intel Core i5-2500K CPU @ 3.30GHz | 1 | 1.92% |
| Intel Core i3-2100 CPU @ 3.10GHz | 1 | 1.92% |
| Intel Core i3-10100 CPU @ 3.60GHz | 1 | 1.92% |
| Intel Core 2 Quad CPU Q9550 @ 2.83GHz | 1 | 1.92% |
| Intel Celeron CPU J3160 @ 1.60GHz | 1 | 1.92% |
| Intel 11th Gen Core i5-11600K @ 3.90GHz | 1 | 1.92% |
| Intel 11th Gen Core i5-11400 @ 2.60GHz | 1 | 1.92% |
| AMD Ryzen 9 5950X 16-Core Processor | 1 | 1.92% |
| AMD Ryzen 9 5900X 12-Core Processor | 1 | 1.92% |
| AMD Ryzen 7 5700G with Radeon Graphics | 1 | 1.92% |
| AMD Ryzen 7 4700G with Radeon Graphics | 1 | 1.92% |
| AMD Ryzen 7 3800X 8-Core Processor | 1 | 1.92% |
| AMD Ryzen 7 1700X Eight-Core Processor | 1 | 1.92% |
| AMD Ryzen 5 3400G with Radeon Vega Graphics | 1 | 1.92% |
| AMD Ryzen 5 2600 Six-Core Processor | 1 | 1.92% |
| AMD Ryzen 3 2200G with Radeon Vega Graphics | 1 | 1.92% |
| AMD DG1501SML87LB | 1 | 1.92% |
| AMD Athlon 3000G with Radeon Vega Graphics | 1 | 1.92% |
| AMD A8-6600K APU with Radeon HD Graphics | 1 | 1.92% |
| AMD A8-3870 APU with Radeon HD Graphics | 1 | 1.92% |
| AMD A4-5050 APU with Radeon HD Graphics | 1 | 1.92% |
CPU Model Family
Processor model prefix


| Model | Desktops | Percent |
|---|---|---|
| AMD Ryzen 5 | 11 | 21.15% |
| Intel Core i5 | 9 | 17.31% |
| Intel Core i7 | 6 | 11.54% |
| AMD Ryzen 7 | 6 | 11.54% |
| Other | 3 | 5.77% |
| Intel Xeon | 3 | 5.77% |
| Intel Pentium | 2 | 3.85% |
| Intel Core i3 | 2 | 3.85% |
| AMD Ryzen 9 | 2 | 3.85% |
| AMD A8 | 2 | 3.85% |
| Intel Core i9 | 1 | 1.92% |
| Intel Core 2 Quad | 1 | 1.92% |
| Intel Celeron | 1 | 1.92% |
| AMD Ryzen 3 | 1 | 1.92% |
| AMD Athlon | 1 | 1.92% |
| AMD A4 | 1 | 1.92% |
CPU Cores
Number of processor cores


| Number | Desktops | Percent |
|---|---|---|
| 4 | 20 | 38.46% |
| 6 | 15 | 28.85% |
| 8 | 8 | 15.38% |
| 2 | 4 | 7.69% |
| 32 | 1 | 1.92% |
| 18 | 1 | 1.92% |
| 16 | 1 | 1.92% |
| 12 | 1 | 1.92% |
| 10 | 1 | 1.92% |
CPU Sockets
Number of sockets

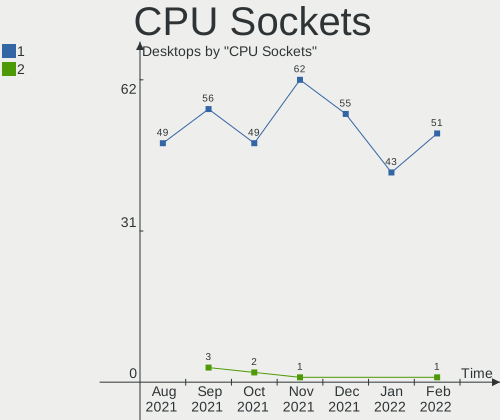
| Number | Desktops | Percent |
|---|---|---|
| 1 | 51 | 98.08% |
| 2 | 1 | 1.92% |
CPU Threads
Threads per core (Hyper-Threading)


| Number | Desktops | Percent |
|---|---|---|
| 2 | 36 | 69.23% |
| 1 | 16 | 30.77% |
CPU Op-Modes
CPU Operation Modes (32-bit, 64-bit)


| Op mode | Desktops | Percent |
|---|---|---|
| 32-bit, 64-bit | 52 | 100% |
CPU Microcode
Microcode number


| Number | Desktops | Percent |
|---|---|---|
| Unknown | 17 | 32.69% |
| 0x306c3 | 4 | 7.69% |
| 0x906e9 | 3 | 5.77% |
| 0x0a201016 | 3 | 5.77% |
| 0xa0671 | 2 | 3.85% |
| 0x206a7 | 2 | 3.85% |
| 0x08701021 | 2 | 3.85% |
| 0x08701013 | 2 | 3.85% |
| 0xa0655 | 1 | 1.92% |
| 0xa0653 | 1 | 1.92% |
| 0x906ea | 1 | 1.92% |
| 0x406f1 | 1 | 1.92% |
| 0x406c4 | 1 | 1.92% |
| 0x306f2 | 1 | 1.92% |
| 0x1067a | 1 | 1.92% |
| 0x0a50000b | 1 | 1.92% |
| 0x0a201009 | 1 | 1.92% |
| 0x0a201006 | 1 | 1.92% |
| 0x08108109 | 1 | 1.92% |
| 0x08108102 | 1 | 1.92% |
| 0x08101016 | 1 | 1.92% |
| 0x0800820d | 1 | 1.92% |
| 0x08001138 | 1 | 1.92% |
| 0x07043001 | 1 | 1.92% |
| 0x0700010f | 1 | 1.92% |
CPU Microarch
Microarchitecture


| Name | Desktops | Percent |
|---|---|---|
| Zen 2 | 9 | 17.31% |
| Haswell | 8 | 15.38% |
| Zen 3 | 7 | 13.46% |
| KabyLake | 6 | 11.54% |
| Zen+ | 3 | 5.77% |
| SandyBridge | 3 | 5.77% |
| CometLake | 3 | 5.77% |
| Zen | 2 | 3.85% |
| Icelake | 2 | 3.85% |
| Silvermont | 1 | 1.92% |
| Piledriver | 1 | 1.92% |
| Penryn | 1 | 1.92% |
| K10 Llano | 1 | 1.92% |
| Jaguar | 1 | 1.92% |
| IvyBridge | 1 | 1.92% |
| Goldmont | 1 | 1.92% |
| Broadwell | 1 | 1.92% |
| Unknown | 1 | 1.92% |
Graphics
GPU Vendor
Vendors of graphics cards


| Vendor | Desktops | Percent |
|---|---|---|
| AMD | 24 | 40% |
| Nvidia | 21 | 35% |
| Intel | 15 | 25% |
GPU Model
Graphics card models


| Model | Desktops | Percent |
|---|---|---|
| AMD Navi 10 [Radeon RX 5600 OEM/5600 XT / 5700/5700 XT] | 4 | 6.56% |
| AMD Ellesmere [Radeon RX 470/480/570/570X/580/580X/590] | 4 | 6.56% |
| Intel CometLake-S GT2 [UHD Graphics 630] | 3 | 4.92% |
| Nvidia GP108 [GeForce GT 1030] | 2 | 3.28% |
| Nvidia GP107 [GeForce GTX 1050 Ti] | 2 | 3.28% |
| Nvidia GK106 [GeForce GTX 660] | 2 | 3.28% |
| Intel Xeon E3-1200 v3/4th Gen Core Processor Integrated Graphics Controller | 2 | 3.28% |
| AMD Vega 10 XL/XT [Radeon RX Vega 56/64] | 2 | 3.28% |
| AMD Caicos XT [Radeon HD 7470/8470 / R5 235/310 OEM] | 2 | 3.28% |
| Nvidia TU116 [GeForce GTX 1660] | 1 | 1.64% |
| Nvidia TU116 [GeForce GTX 1660 SUPER] | 1 | 1.64% |
| Nvidia TU106 [GeForce RTX 2060 SUPER] | 1 | 1.64% |
| Nvidia TU104 [GeForce RTX 2060] | 1 | 1.64% |
| Nvidia GP107 [GeForce GTX 1050] | 1 | 1.64% |
| Nvidia GP104 [GeForce GTX 1070] | 1 | 1.64% |
| Nvidia GP104 [GeForce GTX 1070 Ti] | 1 | 1.64% |
| Nvidia GM206 [GeForce GTX 960] | 1 | 1.64% |
| Nvidia GM200GL [Quadro M6000] | 1 | 1.64% |
| Nvidia GM107 [GeForce GTX 750 Ti] | 1 | 1.64% |
| Nvidia GK107GL [Quadro K2000] | 1 | 1.64% |
| Nvidia GK104M [GeForce GTX 870M] | 1 | 1.64% |
| Nvidia GF108GL [Quadro 600] | 1 | 1.64% |
| Nvidia GF104 [GeForce GTX 460] | 1 | 1.64% |
| Nvidia GA106 [GeForce RTX 3060] | 1 | 1.64% |
| Intel RocketLake-S GT1 [UHD Graphics 750] | 1 | 1.64% |
| Intel RocketLake-S GT1 [UHD Graphics 730] | 1 | 1.64% |
| Intel IvyBridge GT2 [HD Graphics 4000] | 1 | 1.64% |
| Intel HD Graphics 630 | 1 | 1.64% |
| Intel HD Graphics 610 | 1 | 1.64% |
| Intel CoffeeLake-S GT2 [UHD Graphics 630] | 1 | 1.64% |
| Intel Celeron N3350/Pentium N4200/Atom E3900 Series Integrated Graphics Controller | 1 | 1.64% |
| Intel Atom/Celeron/Pentium Processor x5-E8000/J3xxx/N3xxx Integrated Graphics Controller | 1 | 1.64% |
| Intel 4th Gen Core Processor Integrated Graphics Controller | 1 | 1.64% |
| Intel 2nd Generation Core Processor Family Integrated Graphics Controller | 1 | 1.64% |
| AMD Turks XT [Radeon HD 6670/7670] | 1 | 1.64% |
| AMD Richland [Radeon HD 8570D] | 1 | 1.64% |
| AMD Renoir | 1 | 1.64% |
| AMD Raven Ridge [Radeon Vega Series / Radeon Vega Mobile Series] | 1 | 1.64% |
| AMD Picasso/Raven 2 [Radeon Vega Series / Radeon Vega Mobile Series] | 1 | 1.64% |
| AMD Navi 23 [Radeon RX 6600/6600 XT/6600M] | 1 | 1.64% |
| AMD Navi 21 [Radeon RX 6900 XT] | 1 | 1.64% |
| AMD Kabini [Radeon HD 8330] | 1 | 1.64% |
| AMD Hawaii PRO [Radeon R9 290/390] | 1 | 1.64% |
| AMD Gladius | 1 | 1.64% |
| AMD Curacao PRO [Radeon R7 370 / R9 270/370 OEM] | 1 | 1.64% |
| AMD Cezanne | 1 | 1.64% |
| AMD Cedar [Radeon HD 5000/6000/7350/8350 Series] | 1 | 1.64% |
GPU Combo
Combinations of graphics cards


| Name | Desktops | Percent |
|---|---|---|
| 1 x AMD | 18 | 34.62% |
| 1 x Nvidia | 17 | 32.69% |
| 1 x Intel | 9 | 17.31% |
| Intel + AMD | 3 | 5.77% |
| Intel + Nvidia | 2 | 3.85% |
| AMD + Nvidia | 2 | 3.85% |
| 2 x AMD | 1 | 1.92% |
GPU Driver
Free vs proprietary


| Driver | Desktops | Percent |
|---|---|---|
| Free | 33 | 63.46% |
| Proprietary | 18 | 34.62% |
| Unknown | 1 | 1.92% |
GPU Memory
Total video memory


| Size in GB | Desktops | Percent |
|---|---|---|
| Unknown | 18 | 34.62% |
| 1.01-2.0 | 11 | 21.15% |
| 7.01-8.0 | 10 | 19.23% |
| 5.01-6.0 | 4 | 7.69% |
| 3.01-4.0 | 3 | 5.77% |
| 8.01-16.0 | 2 | 3.85% |
| 0.51-1.0 | 2 | 3.85% |
| 2.01-3.0 | 1 | 1.92% |
| 0.01-0.5 | 1 | 1.92% |
Monitor
Monitor Vendor
Monitor vendors


| Vendor | Desktops | Percent |
|---|---|---|
| Goldstar | 14 | 22.95% |
| Samsung Electronics | 8 | 13.11% |
| Dell | 7 | 11.48% |
| BenQ | 4 | 6.56% |
| Philips | 3 | 4.92% |
| Acer | 3 | 4.92% |
| Hewlett-Packard | 2 | 3.28% |
| ASUSTek Computer | 2 | 3.28% |
| AOC | 2 | 3.28% |
| ViewSonic | 1 | 1.64% |
| Toshiba | 1 | 1.64% |
| Sony | 1 | 1.64% |
| SGT | 1 | 1.64% |
| Princeton | 1 | 1.64% |
| Optoma | 1 | 1.64% |
| OEM | 1 | 1.64% |
| MSI | 1 | 1.64% |
| Medion | 1 | 1.64% |
| LOS | 1 | 1.64% |
| LG Electronics | 1 | 1.64% |
| HJW | 1 | 1.64% |
| HannStar Display | 1 | 1.64% |
| Gigabyte Technology | 1 | 1.64% |
| Gateway | 1 | 1.64% |
| AGO | 1 | 1.64% |
Monitor Model
Monitor models


| Model | Desktops | Percent |
|---|---|---|
| Goldstar Ultra HD GSM5B09 3840x2160 600x340mm 27.2-inch | 2 | 3.28% |
| ViewSonic VX2363 Series VSC6B2F 1920x1080 509x286mm 23.0-inch | 1 | 1.64% |
| Toshiba TV TSB0108 1920x1080 700x390mm 31.5-inch | 1 | 1.64% |
| Sony TV SNY4B03 1920x1080 1107x623mm 50.0-inch | 1 | 1.64% |
| SGT HDMI SGT2383 1280x1024 360x250mm 17.3-inch | 1 | 1.64% |
| Samsung Electronics SyncMaster SAM05EC 1920x1080 597x336mm 27.0-inch | 1 | 1.64% |
| Samsung Electronics S27D590 SAM0BE9 1920x1080 598x336mm 27.0-inch | 1 | 1.64% |
| Samsung Electronics S24H85x SAM0E0C 2560x1440 527x296mm 23.8-inch | 1 | 1.64% |
| Samsung Electronics S24D332 SAM0F5E 1920x1080 530x300mm 24.0-inch | 1 | 1.64% |
| Samsung Electronics S24D330 SAM0D92 1920x1080 531x299mm 24.0-inch | 1 | 1.64% |
| Samsung Electronics LCD Monitor LU28R55 640x480 | 1 | 1.64% |
| Samsung Electronics LC32G7xT SAM7058 2560x1440 700x400mm 31.7-inch | 1 | 1.64% |
| Samsung Electronics C27F390 SAM0D32 1920x1080 598x336mm 27.0-inch | 1 | 1.64% |
| Princeton VL 1716 PGS030C 1280x1024 338x270mm 17.0-inch | 1 | 1.64% |
| Philips PHL 275E1 PHLC20C 2560x1440 597x336mm 27.0-inch | 1 | 1.64% |
| Philips PHL 246E9Q PHLC17C 1920x1080 527x296mm 23.8-inch | 1 | 1.64% |
| Philips LCD Monitor PHL 243V5 1920x1080 | 1 | 1.64% |
| Optoma UHD OTM0076 3840x2160 1220x680mm 55.0-inch | 1 | 1.64% |
| OEM 22_LCD_TV OEM3700 1920x540 | 1 | 1.64% |
| MSI G241V E2 MSI3BA7 1920x1080 527x296mm 23.8-inch | 1 | 1.64% |
| Medion MD20830 MEA5104 1920x1080 527x296mm 23.8-inch | 1 | 1.64% |
| LOS DP1-2714UD LOS0027 3840x2160 600x330mm 27.0-inch | 1 | 1.64% |
| LG Electronics LCD Monitor LG IPS FULLHD 1920x1080 | 1 | 1.64% |
| HJW MACROSILICON HJW1836 1680x1050 530x290mm 23.8-inch | 1 | 1.64% |
| Hewlett-Packard V194 HWP3346 1366x768 410x230mm 18.5-inch | 1 | 1.64% |
| Hewlett-Packard 22cwa HWP3183 1920x1080 476x268mm 21.5-inch | 1 | 1.64% |
| HannStar Display LCD Monitor HE225DPB | 1 | 1.64% |
| Goldstar W2043 GSM4E9D 1600x900 443x249mm 20.0-inch | 1 | 1.64% |
| Goldstar ULTRAGEAR GSM774B 3440x1440 800x335mm 34.1-inch | 1 | 1.64% |
| Goldstar ULTRAGEAR GSM5BB4 2560x1440 597x336mm 27.0-inch | 1 | 1.64% |
| Goldstar LG HDR 4K GSM7706 3840x2160 600x340mm 27.2-inch | 1 | 1.64% |
| Goldstar LG FULL HD GSM5B55 1920x1080 480x270mm 21.7-inch | 1 | 1.64% |
| Goldstar LCD Monitor GSM5AB7 1920x1080 480x270mm 21.7-inch | 1 | 1.64% |
| Goldstar IPS WSXGA GSM5B20 1440x900 419x262mm 19.5-inch | 1 | 1.64% |
| Goldstar E2050 GSM4EAE 1600x900 443x249mm 20.0-inch | 1 | 1.64% |
| Goldstar BK550Y GSM5B42 1920x1080 600x340mm 27.2-inch | 1 | 1.64% |
| Goldstar BK550Y GSM5B41 1920x1080 480x270mm 21.7-inch | 1 | 1.64% |
| Goldstar 24EB23 GSM59B4 1920x1200 520x330mm 24.2-inch | 1 | 1.64% |
| Goldstar 22MP55 GSM5A24 1920x1080 477x268mm 21.5-inch | 1 | 1.64% |
| Gigabyte Technology M27Q GBT270D 2560x1440 596x335mm 26.9-inch | 1 | 1.64% |
| Gateway FPD1760 GWY06D7 1280x1024 337x270mm 17.0-inch | 1 | 1.64% |
| Dell U2419HC DEL417A 1920x1080 527x296mm 23.8-inch | 1 | 1.64% |
| Dell SE2216H DELF071 1920x1080 476x268mm 21.5-inch | 1 | 1.64% |
| Dell S2817Q DEL40EE 3840x2160 621x341mm 27.9-inch | 1 | 1.64% |
| Dell P2421 DELA171 1920x1200 518x324mm 24.1-inch | 1 | 1.64% |
| Dell P2219H DELA114 1920x1080 476x267mm 21.5-inch | 1 | 1.64% |
| Dell LCD Monitor DELA103 1920x1080 540x300mm 24.3-inch | 1 | 1.64% |
| Dell E1916He DELF067 1366x768 410x230mm 18.5-inch | 1 | 1.64% |
| BenQ ZOWIE XL LCD BNQ7F33 1920x1080 530x300mm 24.0-inch | 1 | 1.64% |
| BenQ VW2430 BNQ7B2E 1920x1080 531x299mm 24.0-inch | 1 | 1.64% |
| BenQ LCD Monitor GW2255 3840x1080 | 1 | 1.64% |
| BenQ LCD BNQ8024 2560x1440 600x340mm 27.2-inch | 1 | 1.64% |
| ASUSTek Computer VG259QM AUS25A9 1920x1080 544x303mm 24.5-inch | 1 | 1.64% |
| ASUSTek Computer VG245 AUS24A1 1920x1080 531x299mm 24.0-inch | 1 | 1.64% |
| AOC 24G2W1G5 AOC2402 1920x1080 527x296mm 23.8-inch | 1 | 1.64% |
| AOC 2369M AOC2369 1920x1080 509x286mm 23.0-inch | 1 | 1.64% |
| AGO LCD Monitor AGO6201 1920x1080 256x192mm 12.6-inch | 1 | 1.64% |
| Acer VG272 P ACR0767 1920x1080 597x336mm 27.0-inch | 1 | 1.64% |
| Acer VG270U ACR06C9 2560x1440 597x336mm 27.0-inch | 1 | 1.64% |
| Acer FHX2201QV ACR02A3 1920x1080 477x268mm 21.5-inch | 1 | 1.64% |
Monitor Resolution
Monitor screen resolution


| Resolution | Desktops | Percent |
|---|---|---|
| 1920x1080 (FHD) | 26 | 47.27% |
| 2560x1440 (QHD) | 7 | 12.73% |
| 3840x2160 (4K) | 6 | 10.91% |
| 1920x540 | 2 | 3.64% |
| 1600x900 (HD+) | 2 | 3.64% |
| 1366x768 (WXGA) | 2 | 3.64% |
| 1280x1024 (SXGA) | 2 | 3.64% |
| 640x480 | 1 | 1.82% |
| 3840x1080 | 1 | 1.82% |
| 3440x1440 | 1 | 1.82% |
| 1920x1200 (WUXGA) | 1 | 1.82% |
| 1440x900 (WXGA+) | 1 | 1.82% |
| 1400x1050 | 1 | 1.82% |
| 1280x960 | 1 | 1.82% |
| Unknown | 1 | 1.82% |
Monitor Diagonal
Diagonal size in inches


| Inches | Desktops | Percent |
|---|---|---|
| 27 | 14 | 25% |
| 24 | 11 | 19.64% |
| 21 | 7 | 12.5% |
| 23 | 6 | 10.71% |
| Unknown | 4 | 7.14% |
| 72 | 2 | 3.57% |
| 31 | 2 | 3.57% |
| 20 | 2 | 3.57% |
| 18 | 2 | 3.57% |
| 17 | 2 | 3.57% |
| 50 | 1 | 1.79% |
| 34 | 1 | 1.79% |
| 19 | 1 | 1.79% |
| 12 | 1 | 1.79% |
Monitor Width
Physical width


| Width in mm | Desktops | Percent |
|---|---|---|
| 501-600 | 27 | 50.94% |
| 401-500 | 12 | 22.64% |
| Unknown | 4 | 7.55% |
| 601-700 | 3 | 5.66% |
| 1501-2000 | 2 | 3.77% |
| 701-800 | 1 | 1.89% |
| 351-400 | 1 | 1.89% |
| 301-350 | 1 | 1.89% |
| 201-300 | 1 | 1.89% |
| 1001-1500 | 1 | 1.89% |
Aspect Ratio
Proportional relationship between the width and the height


| Ratio | Desktops | Percent |
|---|---|---|
| 16/9 | 41 | 78.85% |
| Unknown | 4 | 7.69% |
| 16/10 | 3 | 5.77% |
| 4/3 | 2 | 3.85% |
| 5/4 | 1 | 1.92% |
| 21/9 | 1 | 1.92% |
Monitor Area
Area in inch²


| Area in inch² | Desktops | Percent |
|---|---|---|
| 201-250 | 20 | 35.09% |
| 301-350 | 14 | 24.56% |
| 251-300 | 4 | 7.02% |
| 151-200 | 4 | 7.02% |
| Unknown | 4 | 7.02% |
| More than 1000 | 3 | 5.26% |
| 351-500 | 3 | 5.26% |
| 141-150 | 3 | 5.26% |
| 71-80 | 1 | 1.75% |
| 131-140 | 1 | 1.75% |
Pixel Density
Pixels per inch


| Density | Desktops | Percent |
|---|---|---|
| 51-100 | 29 | 53.7% |
| 101-120 | 12 | 22.22% |
| 161-240 | 5 | 9.26% |
| Unknown | 4 | 7.41% |
| 1-50 | 2 | 3.7% |
| 121-160 | 2 | 3.7% |
Multiple Monitors
Total monitors connected


| Total | Desktops | Percent |
|---|---|---|
| 1 | 38 | 73.08% |
| 2 | 11 | 21.15% |
| 3 | 2 | 3.85% |
| 0 | 1 | 1.92% |
Network
Net Controller Vendor
Controller vendors


| Vendor | Desktops | Percent |
|---|---|---|
| Realtek Semiconductor | 36 | 53.73% |
| Intel | 20 | 29.85% |
| Qualcomm Atheros | 4 | 5.97% |
| Ralink Technology | 3 | 4.48% |
| Microsoft | 1 | 1.49% |
| MEDIATEK | 1 | 1.49% |
| HMD Global | 1 | 1.49% |
| AVM | 1 | 1.49% |
Net Controller Model
Controller models


| Model | Desktops | Percent |
|---|---|---|
| Realtek RTL8111/8168/8411 PCI Express Gigabit Ethernet Controller | 31 | 38.75% |
| Intel Wi-Fi 6 AX200 | 5 | 6.25% |
| Realtek RTL8125 2.5GbE Controller | 4 | 5% |
| Intel I211 Gigabit Network Connection | 4 | 5% |
| Realtek RTL8821CE 802.11ac PCIe Wireless Network Adapter | 2 | 2.5% |
| Realtek RTL8188EE Wireless Network Adapter | 2 | 2.5% |
| Ralink MT7601U Wireless Adapter | 2 | 2.5% |
| Intel Wireless 3160 | 2 | 2.5% |
| Intel Wi-Fi 6 AX210/AX211/AX411 160MHz | 2 | 2.5% |
| Intel Ethernet Controller I225-V | 2 | 2.5% |
| Intel Ethernet Connection I217-LM | 2 | 2.5% |
| Intel Ethernet Connection (2) I218-V | 2 | 2.5% |
| Realtek RTL8188EUS 802.11n Wireless Network Adapter | 1 | 1.25% |
| Realtek RTL8153 Gigabit Ethernet Adapter | 1 | 1.25% |
| Ralink RT5372 Wireless Adapter | 1 | 1.25% |
| Qualcomm Atheros QCA9565 / AR9565 Wireless Network Adapter | 1 | 1.25% |
| Qualcomm Atheros Killer E2500 Gigabit Ethernet Controller | 1 | 1.25% |
| Qualcomm Atheros AR93xx Wireless Network Adapter | 1 | 1.25% |
| Qualcomm Atheros AR8151 v2.0 Gigabit Ethernet | 1 | 1.25% |
| Microsoft XBOX ACC | 1 | 1.25% |
| MEDIATEK Network controller | 1 | 1.25% |
| Intel Wireless-AC 9260 | 1 | 1.25% |
| Intel I210 Gigabit Network Connection | 1 | 1.25% |
| Intel Ethernet Connection (7) I219-V | 1 | 1.25% |
| Intel Ethernet Connection (5) I219-V | 1 | 1.25% |
| Intel Ethernet Connection (2) I218-LM | 1 | 1.25% |
| Intel Ethernet Connection (14) I219-V | 1 | 1.25% |
| Intel Cannon Lake PCH CNVi WiFi | 1 | 1.25% |
| Intel 82599ES 10-Gigabit SFI/SFP+ Network Connection | 1 | 1.25% |
| Intel 82579LM Gigabit Network Connection (Lewisville) | 1 | 1.25% |
| HMD Global SDM439-QRD _SN:13A316C0 | 1 | 1.25% |
| AVM FRITZ!WLAN AC 860 | 1 | 1.25% |
Wireless Vendor
Wireless vendors


| Vendor | Desktops | Percent |
|---|---|---|
| Intel | 11 | 45.83% |
| Realtek Semiconductor | 5 | 20.83% |
| Ralink Technology | 3 | 12.5% |
| Qualcomm Atheros | 2 | 8.33% |
| Microsoft | 1 | 4.17% |
| MEDIATEK | 1 | 4.17% |
| AVM | 1 | 4.17% |
Wireless Model
Wireless models


| Model | Desktops | Percent |
|---|---|---|
| Intel Wi-Fi 6 AX200 | 5 | 20.83% |
| Realtek RTL8821CE 802.11ac PCIe Wireless Network Adapter | 2 | 8.33% |
| Realtek RTL8188EE Wireless Network Adapter | 2 | 8.33% |
| Ralink MT7601U Wireless Adapter | 2 | 8.33% |
| Intel Wireless 3160 | 2 | 8.33% |
| Intel Wi-Fi 6 AX210/AX211/AX411 160MHz | 2 | 8.33% |
| Realtek RTL8188EUS 802.11n Wireless Network Adapter | 1 | 4.17% |
| Ralink RT5372 Wireless Adapter | 1 | 4.17% |
| Qualcomm Atheros QCA9565 / AR9565 Wireless Network Adapter | 1 | 4.17% |
| Qualcomm Atheros AR93xx Wireless Network Adapter | 1 | 4.17% |
| Microsoft XBOX ACC | 1 | 4.17% |
| MEDIATEK Network controller | 1 | 4.17% |
| Intel Wireless-AC 9260 | 1 | 4.17% |
| Intel Cannon Lake PCH CNVi WiFi | 1 | 4.17% |
| AVM FRITZ!WLAN AC 860 | 1 | 4.17% |
Ethernet Vendor
Ethernet vendors


| Vendor | Desktops | Percent |
|---|---|---|
| Realtek Semiconductor | 35 | 66.04% |
| Intel | 15 | 28.3% |
| Qualcomm Atheros | 2 | 3.77% |
| HMD Global | 1 | 1.89% |
Ethernet Model
Ethernet models


| Model | Desktops | Percent |
|---|---|---|
| Realtek RTL8111/8168/8411 PCI Express Gigabit Ethernet Controller | 31 | 55.36% |
| Realtek RTL8125 2.5GbE Controller | 4 | 7.14% |
| Intel I211 Gigabit Network Connection | 4 | 7.14% |
| Intel Ethernet Controller I225-V | 2 | 3.57% |
| Intel Ethernet Connection I217-LM | 2 | 3.57% |
| Intel Ethernet Connection (2) I218-V | 2 | 3.57% |
| Realtek RTL8153 Gigabit Ethernet Adapter | 1 | 1.79% |
| Qualcomm Atheros Killer E2500 Gigabit Ethernet Controller | 1 | 1.79% |
| Qualcomm Atheros AR8151 v2.0 Gigabit Ethernet | 1 | 1.79% |
| Intel I210 Gigabit Network Connection | 1 | 1.79% |
| Intel Ethernet Connection (7) I219-V | 1 | 1.79% |
| Intel Ethernet Connection (5) I219-V | 1 | 1.79% |
| Intel Ethernet Connection (2) I218-LM | 1 | 1.79% |
| Intel Ethernet Connection (14) I219-V | 1 | 1.79% |
| Intel 82599ES 10-Gigabit SFI/SFP+ Network Connection | 1 | 1.79% |
| Intel 82579LM Gigabit Network Connection (Lewisville) | 1 | 1.79% |
| HMD Global SDM439-QRD _SN:13A316C0 | 1 | 1.79% |
Net Controller Kind
Ethernet, WiFi or modem


| Kind | Desktops | Percent |
|---|---|---|
| Ethernet | 51 | 68.92% |
| WiFi | 23 | 31.08% |
Used Controller
Currently used network controller


| Kind | Desktops | Percent |
|---|---|---|
| Ethernet | 47 | 77.05% |
| WiFi | 14 | 22.95% |
NICs
Total network controllers on board


| Total | Desktops | Percent |
|---|---|---|
| 1 | 29 | 55.77% |
| 2 | 18 | 34.62% |
| 3 | 3 | 5.77% |
| 0 | 2 | 3.85% |
IPv6
IPv6 vs IPv4


| Used | Desktops | Percent |
|---|---|---|
| No | 40 | 76.92% |
| Yes | 12 | 23.08% |
Bluetooth
Bluetooth Vendor
Controller vendors


| Vendor | Desktops | Percent |
|---|---|---|
| Intel | 10 | 35.71% |
| Cambridge Silicon Radio | 8 | 28.57% |
| Realtek Semiconductor | 5 | 17.86% |
| Broadcom | 3 | 10.71% |
| Qualcomm Atheros Communications | 1 | 3.57% |
| MediaTek | 1 | 3.57% |
Bluetooth Model
Controller models


| Model | Desktops | Percent |
|---|---|---|
| Cambridge Silicon Radio Bluetooth Dongle (HCI mode) | 8 | 28.57% |
| Realtek Bluetooth Radio | 4 | 14.29% |
| Intel AX200 Bluetooth | 4 | 14.29% |
| Intel Bluetooth Device | 3 | 10.71% |
| Intel Bluetooth wireless interface | 2 | 7.14% |
| Broadcom BCM20702A0 Bluetooth 4.0 | 2 | 7.14% |
| Realtek Bluetooth 4.2 Adapter | 1 | 3.57% |
| Qualcomm Atheros Bluetooth Device | 1 | 3.57% |
| MediaTek Wireless_Device | 1 | 3.57% |
| Intel Wireless-AC 9260 Bluetooth Adapter | 1 | 3.57% |
| Broadcom BCM92045B3 ROM | 1 | 3.57% |
Sound
Sound Vendor
Sound card vendors


| Vendor | Desktops | Percent |
|---|---|---|
| AMD | 29 | 30.85% |
| Intel | 25 | 26.6% |
| Nvidia | 21 | 22.34% |
| C-Media Electronics | 4 | 4.26% |
| BEHRINGER International | 3 | 3.19% |
| Generalplus Technology | 2 | 2.13% |
| Texas Instruments | 1 | 1.06% |
| Sony | 1 | 1.06% |
| Razer USA | 1 | 1.06% |
| Micro Star International | 1 | 1.06% |
| Logitech | 1 | 1.06% |
| Creative Labs | 1 | 1.06% |
| Corsair | 1 | 1.06% |
| Audio-Technica | 1 | 1.06% |
| Audient | 1 | 1.06% |
| ASUSTek Computer | 1 | 1.06% |
Sound Model
Sound card models


| Model | Desktops | Percent |
|---|---|---|
| AMD Starship/Matisse HD Audio Controller | 12 | 10.62% |
| Intel 8 Series/C220 Series Chipset High Definition Audio Controller | 5 | 4.42% |
| AMD Family 17h/19h HD Audio Controller | 5 | 4.42% |
| AMD Navi 10 HDMI Audio | 4 | 3.54% |
| AMD Ellesmere HDMI Audio [Radeon RX 470/480 / 570/580/590] | 4 | 3.54% |
| Nvidia GP107GL High Definition Audio Controller | 3 | 2.65% |
| Intel Xeon E3-1200 v3/4th Gen Core Processor HD Audio Controller | 3 | 2.65% |
| Nvidia TU116 High Definition Audio Controller | 2 | 1.77% |
| Nvidia GP108 High Definition Audio Controller | 2 | 1.77% |
| Nvidia GP104 High Definition Audio Controller | 2 | 1.77% |
| Nvidia GK106 HDMI Audio Controller | 2 | 1.77% |
| Intel Tiger Lake-H HD Audio Controller | 2 | 1.77% |
| Intel Comet Lake PCH-V cAVS | 2 | 1.77% |
| Intel Cannon Lake PCH cAVS | 2 | 1.77% |
| Intel 7 Series/C216 Chipset Family High Definition Audio Controller | 2 | 1.77% |
| Intel 200 Series PCH HD Audio | 2 | 1.77% |
| Intel 100 Series/C230 Series Chipset Family HD Audio Controller | 2 | 1.77% |
| Generalplus Technology USB Audio Device | 2 | 1.77% |
| BEHRINGER International UMC202HD 192k | 2 | 1.77% |
| AMD Vega 10 HDMI Audio [Radeon Vega 56/64] | 2 | 1.77% |
| AMD Renoir Radeon High Definition Audio Controller | 2 | 1.77% |
| AMD Raven/Raven2/Fenghuang HDMI/DP Audio Controller | 2 | 1.77% |
| AMD Navi 21 HDMI Audio [Radeon RX 6800/6800 XT / 6900 XT] | 2 | 1.77% |
| AMD FCH Azalia Controller | 2 | 1.77% |
| AMD Family 17h (Models 00h-0fh) HD Audio Controller | 2 | 1.77% |
| AMD Caicos HDMI Audio [Radeon HD 6450 / 7450/8450/8490 OEM / R5 230/235/235X OEM] | 2 | 1.77% |
| Texas Instruments PCM2902 Audio Codec | 1 | 0.88% |
| Sony DualSense wireless controller (PS5) | 1 | 0.88% |
| Razer USA Kraken 7.1 V2 | 1 | 0.88% |
| Nvidia TU106 High Definition Audio Controller | 1 | 0.88% |
| Nvidia TU104 HD Audio Controller | 1 | 0.88% |
| Nvidia GM206 High Definition Audio Controller | 1 | 0.88% |
| Nvidia GM200 High Definition Audio | 1 | 0.88% |
| Nvidia GM107 High Definition Audio Controller [GeForce 940MX] | 1 | 0.88% |
| Nvidia GK107 HDMI Audio Controller | 1 | 0.88% |
| Nvidia GK104 HDMI Audio Controller | 1 | 0.88% |
| Nvidia GF108 High Definition Audio Controller | 1 | 0.88% |
| Nvidia GF104 High Definition Audio Controller | 1 | 0.88% |
| Nvidia Audio device | 1 | 0.88% |
| Micro Star International USB Audio | 1 | 0.88% |
| Logitech Yeti X | 1 | 0.88% |
| Intel NM10/ICH7 Family High Definition Audio Controller | 1 | 0.88% |
| Intel Celeron N3350/Pentium N4200/Atom E3900 Series Audio Cluster | 1 | 0.88% |
| Intel C610/X99 series chipset HD Audio Controller | 1 | 0.88% |
| Intel C600/X79 series chipset High Definition Audio Controller | 1 | 0.88% |
| Intel Audio device | 1 | 0.88% |
| Intel Atom/Celeron/Pentium Processor x5-E8000/J3xxx/N3xxx Series High Definition Audio Controller | 1 | 0.88% |
| Intel 9 Series Chipset Family HD Audio Controller | 1 | 0.88% |
| Intel 6 Series/C200 Series Chipset Family High Definition Audio Controller | 1 | 0.88% |
| Creative Labs Sound Core3D [Sound Blaster Recon3D / Z-Series] | 1 | 0.88% |
| Corsair Corsair Gaming H1500 Headset | 1 | 0.88% |
| C-Media Electronics USB-LCS Audio | 1 | 0.88% |
| C-Media Electronics TONOR TC30 Audio Device | 1 | 0.88% |
| C-Media Electronics CMI8788 [Oxygen HD Audio] | 1 | 0.88% |
| C-Media Electronics CM108 Audio Controller | 1 | 0.88% |
| BEHRINGER International UMC404HD 192k | 1 | 0.88% |
| Audio-Technica AT2020USB+ | 1 | 0.88% |
| Audient EVO4 | 1 | 0.88% |
| ASUSTek Computer USB Audio | 1 | 0.88% |
| AMD Turks HDMI Audio [Radeon HD 6500/6600 / 6700M Series] | 1 | 0.88% |
Memory
Memory Vendor
Memory module vendors


| Vendor | Desktops | Percent |
|---|---|---|
| Corsair | 10 | 21.74% |
| Kingston | 7 | 15.22% |
| Crucial | 6 | 13.04% |
| G.Skill | 5 | 10.87% |
| Samsung Electronics | 4 | 8.7% |
| Team | 3 | 6.52% |
| SK Hynix | 3 | 6.52% |
| Unknown | 2 | 4.35% |
| Patriot | 2 | 4.35% |
| Micron Technology | 1 | 2.17% |
| Atermiter | 1 | 2.17% |
| Apacer | 1 | 2.17% |
| A-DATA Technology | 1 | 2.17% |
Memory Model
Memory module models


| Model | Desktops | Percent |
|---|---|---|
| Corsair RAM CMK8GX4M1E3200C16 8GB DIMM DDR4 3200MT/s | 2 | 3.7% |
| Unknown RAM Module 4GB DIMM DDR3 1333MT/s | 1 | 1.85% |
| Unknown RAM Module 2048MB DIMM 800MT/s | 1 | 1.85% |
| Team RAM TEAMGROUP-UD4-3200 16GB DIMM DDR4 3200MT/s | 1 | 1.85% |
| Team RAM TEAMGROUP-UD4-3000 8GB DIMM DDR4 3067MT/s | 1 | 1.85% |
| Team RAM TEAMGROUP-SD3-1600 8GB DIMM DDR3 1600MT/s | 1 | 1.85% |
| SK Hynix RAM HMT41GU6BFR8C-PB 8GB DIMM DDR3 1600MT/s | 1 | 1.85% |
| SK Hynix RAM HMT351U6BFR8C-H9 4GB DIMM DDR3 1333MT/s | 1 | 1.85% |
| SK Hynix RAM HMA851U6AFR6N-UH 4GB DIMM DDR4 2400MT/s | 1 | 1.85% |
| Samsung RAM M393A4K40CB1-CRC 32GB DIMM DDR4 2400MT/s | 1 | 1.85% |
| Samsung RAM M393A4K40BB1-CRC 32GB DIMM DDR4 2400MT/s | 1 | 1.85% |
| Samsung RAM M378B5273DH0-CH9 4096MB DIMM DDR3 2133MT/s | 1 | 1.85% |
| Samsung RAM M378B5273CH0-CH9 4GB DIMM DDR3 1867MT/s | 1 | 1.85% |
| Samsung RAM M378B1G73EB0-CK0 8GB DIMM DDR3 1600MT/s | 1 | 1.85% |
| Samsung RAM M378A5244CB0-CRC 4GB DIMM DDR4 2400MT/s | 1 | 1.85% |
| Patriot RAM 3200 C16 Series 8GB DIMM DDR4 3200MT/s | 1 | 1.85% |
| Patriot RAM 2400 C15 Series 4GB DIMM DDR4 2400MT/s | 1 | 1.85% |
| Micron RAM 8ATF2G64AZ-3G2E1 16GB DIMM DDR4 3200MT/s | 1 | 1.85% |
| Kingston RAM KHX3466C17D4/16GX 16384MB DIMM DDR4 3466MT/s | 1 | 1.85% |
| Kingston RAM KHX3200C16D4/8GX 8GB DIMM DDR4 3533MT/s | 1 | 1.85% |
| Kingston RAM KHX3200C16D4/16GX 16GB DIMM DDR4 3600MT/s | 1 | 1.85% |
| Kingston RAM KHX2133C14/8G 8GB DIMM DDR4 2400MT/s | 1 | 1.85% |
| Kingston RAM KHX1866C10D3/8G 8GB DIMM DDR3 1867MT/s | 1 | 1.85% |
| Kingston RAM KHX1600C10D3/4G 4GB DIMM DDR3 1866MT/s | 1 | 1.85% |
| Kingston RAM 99U5474-028.A00LF 4GB DIMM DDR3 1600MT/s | 1 | 1.85% |
| G.Skill RAM F4-3000C16-8GISB 8GB DIMM DDR4 3200MT/s | 1 | 1.85% |
| G.Skill RAM F4-3000C16-16GRS 16GB SODIMM DDR4 2400MT/s | 1 | 1.85% |
| G.Skill RAM F4-3000C15-8GVKB 8GB DIMM DDR4 3066MT/s | 1 | 1.85% |
| G.Skill RAM F4-3000C15-8GVGB 8GB DIMM DDR4 3066MT/s | 1 | 1.85% |
| G.Skill RAM F4-2400C15-8GFX 8GB DIMM DDR4 3000MT/s | 1 | 1.85% |
| G.Skill RAM F4-2400C15-4GIS 4GB DIMM DDR4 3000MT/s | 1 | 1.85% |
| Crucial RAM CT8G4DFS824A.C8FP 8GB DIMM DDR4 2400MT/s | 1 | 1.85% |
| Crucial RAM CT8G4DFS824A.C8FHD1 8GB DIMM DDR4 2667MT/s | 1 | 1.85% |
| Crucial RAM CT8G4DFS824A.C8FE 8GB DIMM DDR4 3000MT/s | 1 | 1.85% |
| Crucial RAM CT8G4DFS824A.C8FBD1 8GB DIMM DDR4 3000MT/s | 1 | 1.85% |
| Crucial RAM CT8G4DFS824A.C8FAD1 8GB DIMM DDR4 2667MT/s | 1 | 1.85% |
| Crucial RAM CT4G4DFS824A.M8FB 4GB DIMM DDR4 2400MT/s | 1 | 1.85% |
| Crucial RAM CT16G4DFRA32A.C8FE 16384MB DIMM DDR4 3200MT/s | 1 | 1.85% |
| Crucial RAM BLS8G4D240FSB.16FARG 8GB DIMM DDR4 2600MT/s | 1 | 1.85% |
| Crucial RAM BL8G32C16U4R.M8FE 8GB DIMM DDR4 2400MT/s | 1 | 1.85% |
| Corsair RAM CMY16GX3M2A1866C9 8GB DIMM DDR3 2400MT/s | 1 | 1.85% |
| Corsair RAM CMX8GX3M2A1600C9 4GB DIMM DDR3 1800MT/s | 1 | 1.85% |
| Corsair RAM CMX8GX3M2A1333C9 4GB DIMM DDR3 1333MT/s | 1 | 1.85% |
| Corsair RAM CMT64GX4M4Z3600C16 16GB DIMM DDR4 3600MT/s | 1 | 1.85% |
| Corsair RAM CMSX4GX3M1A1600C9 4GB SODIMM DDR3 1600MT/s | 1 | 1.85% |
| Corsair RAM CMSX16GX3M2B1866C1 8GB SODIMM DDR3 1867MT/s | 1 | 1.85% |
| Corsair RAM CMK8GX4M1A2400C14 8GB DIMM DDR4 2667MT/s | 1 | 1.85% |
| Corsair RAM CMK32GX4M2A2666C16 16GB DIMM DDR4 3100MT/s | 1 | 1.85% |
| Corsair RAM CMK16GX4M2E3200C16 8GB DIMM DDR4 3200MT/s | 1 | 1.85% |
| Corsair RAM CMK16GX4M2D3000C16 8GB DIMM DDR4 3200MT/s | 1 | 1.85% |
| Atermiter RAM Module 8GB DIMM DDR3 800MT/s | 1 | 1.85% |
| Apacer RAM 78.C1GMM.AUW0C 8GB DIMM DDR4 2666MT/s | 1 | 1.85% |
| A-DATA RAM Module 4GB DIMM DDR4 2667MT/s | 1 | 1.85% |
Memory Kind
Memory module kinds


| Kind | Desktops | Percent |
|---|---|---|
| DDR4 | 27 | 71.05% |
| DDR3 | 10 | 26.32% |
| Unknown | 1 | 2.63% |
Memory Form Factor
Physical design of the memory module


| Name | Desktops | Percent |
|---|---|---|
| DIMM | 36 | 94.74% |
| SODIMM | 2 | 5.26% |
Memory Size
Memory module size


| Size | Desktops | Percent |
|---|---|---|
| 8192 | 22 | 51.16% |
| 4096 | 9 | 20.93% |
| 16384 | 8 | 18.6% |
| 32768 | 3 | 6.98% |
| 2048 | 1 | 2.33% |
Memory Speed
Memory module speed

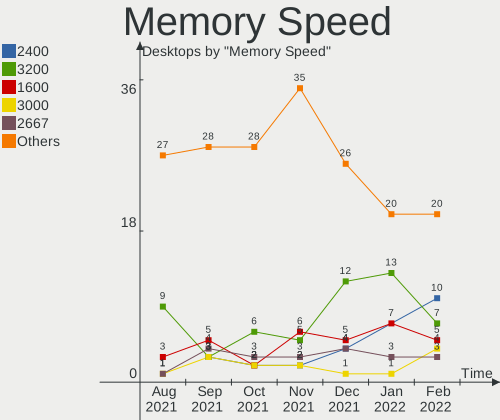
| Speed | Desktops | Percent |
|---|---|---|
| 2400 | 10 | 20.41% |
| 3200 | 7 | 14.29% |
| 1600 | 5 | 10.2% |
| 3000 | 4 | 8.16% |
| 2667 | 3 | 6.12% |
| 1333 | 3 | 6.12% |
| 3600 | 2 | 4.08% |
| 2133 | 2 | 4.08% |
| 1867 | 2 | 4.08% |
| 800 | 2 | 4.08% |
| 3533 | 1 | 2.04% |
| 3466 | 1 | 2.04% |
| 3100 | 1 | 2.04% |
| 3067 | 1 | 2.04% |
| 3066 | 1 | 2.04% |
| 2666 | 1 | 2.04% |
| 2600 | 1 | 2.04% |
| 1866 | 1 | 2.04% |
| 1800 | 1 | 2.04% |
Printers & scanners
Printer Vendor
Printer device vendors


| Vendor | Desktops | Percent |
|---|---|---|
| Prolific Technology | 1 | 50% |
| Hewlett-Packard | 1 | 50% |
Printer Model
Printer device models


| Model | Desktops | Percent |
|---|---|---|
| Prolific PL2305 Parallel Port | 1 | 50% |
| HP LaserJet P2015 series | 1 | 50% |
Scanner Vendor
Scanner device vendors
Zero info for selected period =(
Scanner Model
Scanner device models
Zero info for selected period =(
Camera
Camera Vendor
Camera device vendors


| Vendor | Desktops | Percent |
|---|---|---|
| Logitech | 5 | 33.33% |
| Microsoft | 3 | 20% |
| Trust | 1 | 6.67% |
| Samsung Electronics | 1 | 6.67% |
| Microdia | 1 | 6.67% |
| MacroSilicon | 1 | 6.67% |
| Leap Motion | 1 | 6.67% |
| Generalplus Technology | 1 | 6.67% |
| Arkmicro Technologies | 1 | 6.67% |
Camera Model
Camera device models


| Model | Desktops | Percent |
|---|---|---|
| Microsoft LifeCam HD-3000 | 2 | 13.33% |
| Trust 17676 Webcam | 1 | 6.67% |
| Samsung Galaxy A5 (MTP) | 1 | 6.67% |
| Microsoft LifeCam Cinema | 1 | 6.67% |
| Microdia Defender G-Lens 2577 HD720p Camera | 1 | 6.67% |
| MacroSilicon USB Video | 1 | 6.67% |
| Logitech Webcam C930e | 1 | 6.67% |
| Logitech Webcam C270 | 1 | 6.67% |
| Logitech Webcam C170 | 1 | 6.67% |
| Logitech HD Webcam C525 | 1 | 6.67% |
| Logitech BRIO Ultra HD Webcam | 1 | 6.67% |
| Leap Motion Controller | 1 | 6.67% |
| Generalplus GENERAL WEBCAM | 1 | 6.67% |
| Arkmicro USB2.0 PC CAMERA | 1 | 6.67% |
Security
Fingerprint Vendor
Fingerprint sensor vendors
Zero info for selected period =(
Fingerprint Model
Fingerprint sensor models
Zero info for selected period =(
Chipcard Vendor
Chipcard module vendors
Zero info for selected period =(
Chipcard Model
Chipcard module models
Zero info for selected period =(
Unsupported
Unsupported Devices
Total unsupported devices on board


| Total | Desktops | Percent |
|---|---|---|
| 0 | 45 | 86.54% |
| 1 | 7 | 13.46% |
Unsupported Device Types
Types of unsupported devices


| Type | Desktops | Percent |
|---|---|---|
| Unassigned class | 2 | 28.57% |
| Graphics card | 2 | 28.57% |
| Camera | 2 | 28.57% |
| Net/wireless | 1 | 14.29% |