KDE neon - Hardware Trends (Desktops)
A project to identify most popular hardware characteristics and track their change over time based on data collected by Linux users at https://Linux-Hardware.org.
Anyone can contribute to this report by the hw-probe tool:
sudo -E hw-probe -all -uploadThis report is for one last month. Overall report since the beginning of time: TestDays
Period: Mar, 2023.
Contents
System
OS
Installed operating systems


| Name | Desktops | Percent |
|---|---|---|
| KDE neon 22.04 | 33 | 100% |
OS Family
OS without a version


| Name | Desktops | Percent |
|---|---|---|
| KDE neon | 33 | 100% |
Kernel
Version of the Linux kernel


| Version | Desktops | Percent |
|---|---|---|
| 5.19.0-35-generic | 18 | 54.55% |
| 5.19.0-38-generic | 5 | 15.15% |
| 5.15.0-60-generic | 4 | 12.12% |
| 5.19.0-32-generic | 3 | 9.09% |
| 5.19.0-37-generic | 1 | 3.03% |
| 5.19.0-1018-lowlatency | 1 | 3.03% |
| 5.15.0-67-generic | 1 | 3.03% |
Kernel Family
Linux kernel without a distro release


| Version | Desktops | Percent |
|---|---|---|
| 5.19.0 | 28 | 84.85% |
| 5.15.0 | 5 | 15.15% |
Kernel Major Ver.
Linux kernel major version


| Version | Desktops | Percent |
|---|---|---|
| 5.19 | 28 | 84.85% |
| 5.15 | 5 | 15.15% |
Arch
OS architecture (x86_64, i586, etc.)


| Name | Desktops | Percent |
|---|---|---|
| x86_64 | 33 | 100% |
DE
Desktop Environment


| Name | Desktops | Percent |
|---|---|---|
| KDE5 | 31 | 93.94% |
| KDE | 2 | 6.06% |
Display Server
X11 or Wayland


| Name | Desktops | Percent |
|---|---|---|
| X11 | 32 | 96.97% |
| Wayland | 1 | 3.03% |
Display Manager
SDDM, LightDM, etc.


| Name | Desktops | Percent |
|---|---|---|
| Unknown | 27 | 81.82% |
| SDDM | 6 | 18.18% |
OS Lang
Language


| Lang | Desktops | Percent |
|---|---|---|
| en_US | 17 | 51.52% |
| es_MX | 4 | 12.12% |
| de_DE | 4 | 12.12% |
| pl_PL | 1 | 3.03% |
| nl_BE | 1 | 3.03% |
| it_IT | 1 | 3.03% |
| fr_FR | 1 | 3.03% |
| es_ES | 1 | 3.03% |
| en_PH | 1 | 3.03% |
| en_CA | 1 | 3.03% |
| C | 1 | 3.03% |
Boot Mode
EFI or BIOS


| Mode | Desktops | Percent |
|---|---|---|
| BIOS | 28 | 84.85% |
| EFI | 5 | 15.15% |
Filesystem
Type of filesystem


| Type | Desktops | Percent |
|---|---|---|
| Ext4 | 29 | 87.88% |
| Zfs | 1 | 3.03% |
| Overlay | 1 | 3.03% |
| Ext3 | 1 | 3.03% |
| Btrfs | 1 | 3.03% |
Part. scheme
Scheme of partitioning


| Type | Desktops | Percent |
|---|---|---|
| Unknown | 26 | 78.79% |
| GPT | 6 | 18.18% |
| MBR | 1 | 3.03% |
Dual Boot with Linux/BSD
Hosting more than one Linux/BSD


| Dual boot | Desktops | Percent |
|---|---|---|
| No | 29 | 87.88% |
| Yes | 4 | 12.12% |
Dual Boot (Win)
Hosting Linux and Windows


| Dual boot | Desktops | Percent |
|---|---|---|
| No | 29 | 87.88% |
| Yes | 4 | 12.12% |
Board
Vendor
Motherboard manufacturer


| Name | Desktops | Percent |
|---|---|---|
| MSI | 8 | 24.24% |
| ASUSTek Computer | 8 | 24.24% |
| Gigabyte Technology | 7 | 21.21% |
| Biostar | 3 | 9.09% |
| Hewlett-Packard | 2 | 6.06% |
| Lenovo | 1 | 3.03% |
| Fujitsu | 1 | 3.03% |
| EMAXX TECHNOLOGY | 1 | 3.03% |
| Dell | 1 | 3.03% |
| Apple | 1 | 3.03% |
Model
Motherboard model


| Name | Desktops | Percent |
|---|---|---|
| ASUS All Series | 2 | 6.06% |
| MSI MS-7C52 | 1 | 3.03% |
| MSI MS-7C37 | 1 | 3.03% |
| MSI MS-7C02 | 1 | 3.03% |
| MSI MS-7B86 | 1 | 3.03% |
| MSI MS-7A62 | 1 | 3.03% |
| MSI MS-7845 | 1 | 3.03% |
| MSI MS-7592 | 1 | 3.03% |
| MSI MS-7586 | 1 | 3.03% |
| Lenovo ThinkCentre M73 10AXS04G01 | 1 | 3.03% |
| HP Compaq Pro 6300 SFF | 1 | 3.03% |
| HP 750-437cb | 1 | 3.03% |
| Gigabyte Z390 M | 1 | 3.03% |
| Gigabyte X299 AORUS Gaming 3 | 1 | 3.03% |
| Gigabyte H81M-S2PV | 1 | 3.03% |
| Gigabyte H410M H V3 | 1 | 3.03% |
| Gigabyte B75M-D3H | 1 | 3.03% |
| Gigabyte B550 AORUS PRO AC | 1 | 3.03% |
| Gigabyte 965P-DS4 | 1 | 3.03% |
| Fujitsu ESPRIMO P710 | 1 | 3.03% |
| EMAXX TECHNOLOGY EMX-B450M-GAMING | 1 | 3.03% |
| Dell Inspiron One 2020 | 1 | 3.03% |
| Biostar H61MHV | 1 | 3.03% |
| Biostar A68N-5545 | 1 | 3.03% |
| Biostar A10N-9630E | 1 | 3.03% |
| ASUS TUF Gaming X570-PLUS | 1 | 3.03% |
| ASUS PRIME B550M-A | 1 | 3.03% |
| ASUS PRIME B450M-A II | 1 | 3.03% |
| ASUS P9X79 PRO | 1 | 3.03% |
| ASUS P8Z77-V LK | 1 | 3.03% |
| ASUS P5P43TD | 1 | 3.03% |
| Apple MacPro5,1 | 1 | 3.03% |
Model Family
Motherboard model prefix


| Name | Desktops | Percent |
|---|---|---|
| ASUS PRIME | 2 | 6.06% |
| ASUS All | 2 | 6.06% |
| MSI MS-7C52 | 1 | 3.03% |
| MSI MS-7C37 | 1 | 3.03% |
| MSI MS-7C02 | 1 | 3.03% |
| MSI MS-7B86 | 1 | 3.03% |
| MSI MS-7A62 | 1 | 3.03% |
| MSI MS-7845 | 1 | 3.03% |
| MSI MS-7592 | 1 | 3.03% |
| MSI MS-7586 | 1 | 3.03% |
| Lenovo ThinkCentre | 1 | 3.03% |
| HP Compaq | 1 | 3.03% |
| HP 750-437cb | 1 | 3.03% |
| Gigabyte Z390 | 1 | 3.03% |
| Gigabyte X299 | 1 | 3.03% |
| Gigabyte H81M-S2PV | 1 | 3.03% |
| Gigabyte H410M | 1 | 3.03% |
| Gigabyte B75M-D3H | 1 | 3.03% |
| Gigabyte B550 | 1 | 3.03% |
| Gigabyte 965P-DS4 | 1 | 3.03% |
| Fujitsu ESPRIMO | 1 | 3.03% |
| EMAXX TECHNOLOGY EMX-B450M-GAMING | 1 | 3.03% |
| Dell Inspiron | 1 | 3.03% |
| Biostar H61MHV | 1 | 3.03% |
| Biostar A68N-5545 | 1 | 3.03% |
| Biostar A10N-9630E | 1 | 3.03% |
| ASUS TUF | 1 | 3.03% |
| ASUS P9X79 | 1 | 3.03% |
| ASUS P8Z77-V | 1 | 3.03% |
| ASUS P5P43TD | 1 | 3.03% |
| Apple MacPro5 | 1 | 3.03% |
MFG Year
Motherboard manufacture year


| Year | Desktops | Percent |
|---|---|---|
| 2019 | 7 | 21.21% |
| 2012 | 6 | 18.18% |
| 2020 | 4 | 12.12% |
| 2013 | 3 | 9.09% |
| 2022 | 2 | 6.06% |
| 2017 | 2 | 6.06% |
| 2016 | 2 | 6.06% |
| 2009 | 2 | 6.06% |
| 2021 | 1 | 3.03% |
| 2015 | 1 | 3.03% |
| 2014 | 1 | 3.03% |
| 2011 | 1 | 3.03% |
| 2006 | 1 | 3.03% |
Form Factor
Physical design of the computer


| Name | Desktops | Percent |
|---|---|---|
| Desktop | 33 | 100% |
Secure Boot
Enabled or disabled


| State | Desktops | Percent |
|---|---|---|
| Disabled | 33 | 100% |
Coreboot
Have coreboot on board


| Used | Desktops | Percent |
|---|---|---|
| No | 33 | 100% |
RAM Size
Total RAM memory


| Size in GB | Desktops | Percent |
|---|---|---|
| 32.01-64.0 | 11 | 33.33% |
| 8.01-16.0 | 8 | 24.24% |
| 4.01-8.0 | 7 | 21.21% |
| 16.01-24.0 | 5 | 15.15% |
| 3.01-4.0 | 2 | 6.06% |
RAM Used
Used RAM memory


| Used GB | Desktops | Percent |
|---|---|---|
| 2.01-3.0 | 13 | 39.39% |
| 1.01-2.0 | 7 | 21.21% |
| 4.01-8.0 | 6 | 18.18% |
| 3.01-4.0 | 6 | 18.18% |
| 24.01-32.0 | 1 | 3.03% |
Total Drives
Number of drives on board


| Drives | Desktops | Percent |
|---|---|---|
| 2 | 10 | 30.3% |
| 4 | 7 | 21.21% |
| 1 | 7 | 21.21% |
| 6 | 4 | 12.12% |
| 3 | 3 | 9.09% |
| 14 | 1 | 3.03% |
| 7 | 1 | 3.03% |
Has CD-ROM
Has CD-ROM on board


| Presented | Desktops | Percent |
|---|---|---|
| No | 20 | 60.61% |
| Yes | 13 | 39.39% |
Has Ethernet
Has Ethernet on board


| Presented | Desktops | Percent |
|---|---|---|
| Yes | 31 | 93.94% |
| No | 2 | 6.06% |
Has WiFi
Has WiFi module


| Presented | Desktops | Percent |
|---|---|---|
| Yes | 17 | 51.52% |
| No | 16 | 48.48% |
Has Bluetooth
Has Bluetooth module


| Presented | Desktops | Percent |
|---|---|---|
| No | 18 | 54.55% |
| Yes | 15 | 45.45% |
Location
Country
Geographic location (country)


| Country | Desktops | Percent |
|---|---|---|
| USA | 8 | 24.24% |
| Germany | 4 | 12.12% |
| Spain | 2 | 6.06% |
| Mexico | 2 | 6.06% |
| France | 2 | 6.06% |
| Colombia | 2 | 6.06% |
| Thailand | 1 | 3.03% |
| Russia | 1 | 3.03% |
| Romania | 1 | 3.03% |
| Poland | 1 | 3.03% |
| Philippines | 1 | 3.03% |
| Peru | 1 | 3.03% |
| Malaysia | 1 | 3.03% |
| Italy | 1 | 3.03% |
| Iran | 1 | 3.03% |
| Indonesia | 1 | 3.03% |
| Canada | 1 | 3.03% |
| Bulgaria | 1 | 3.03% |
| Belgium | 1 | 3.03% |
City
Geographic location (city)


| City | Desktops | Percent |
|---|---|---|
| Zapopan | 1 | 3.03% |
| Yambol | 1 | 3.03% |
| Wroclaw | 1 | 3.03% |
| Vicenza | 1 | 3.03% |
| Tuscola | 1 | 3.03% |
| Tulcea | 1 | 3.03% |
| Tehran | 1 | 3.03% |
| Skowhegan | 1 | 3.03% |
| Septemes-les-Vallons | 1 | 3.03% |
| Santiago de Cali | 1 | 3.03% |
| Rockford | 1 | 3.03% |
| Puebla City | 1 | 3.03% |
| Portage la Prairie | 1 | 3.03% |
| Perai | 1 | 3.03% |
| Munich | 1 | 3.03% |
| Milledgeville | 1 | 3.03% |
| Medellín | 1 | 3.03% |
| Malolos | 1 | 3.03% |
| Madrid | 1 | 3.03% |
| Labergement-Sainte-Marie | 1 | 3.03% |
| Juliaca | 1 | 3.03% |
| Jakarta | 1 | 3.03% |
| Irkutsk | 1 | 3.03% |
| Ilmenau | 1 | 3.03% |
| Findlay | 1 | 3.03% |
| Elche | 1 | 3.03% |
| Brooklyn | 1 | 3.03% |
| Bristol | 1 | 3.03% |
| Boutersem | 1 | 3.03% |
| Biloxi | 1 | 3.03% |
| Berlin | 1 | 3.03% |
| Bangkok | 1 | 3.03% |
| Arnsberg | 1 | 3.03% |
Drives
Drive Vendor
Hard drive vendors


| Vendor | Desktops | Drives | Percent |
|---|---|---|---|
| Seagate | 17 | 25 | 20.24% |
| WDC | 11 | 16 | 13.1% |
| Samsung Electronics | 8 | 14 | 9.52% |
| Kingston | 7 | 7 | 8.33% |
| Crucial | 5 | 6 | 5.95% |
| A-DATA Technology | 4 | 4 | 4.76% |
| Phison Electronics | 3 | 3 | 3.57% |
| Toshiba | 2 | 2 | 2.38% |
| SanDisk | 2 | 2 | 2.38% |
| PNY | 2 | 2 | 2.38% |
| walram | 1 | 1 | 1.19% |
| Unknown | 1 | 1 | 1.19% |
| Silicon Motion | 1 | 1 | 1.19% |
| Realtek Semiconductor | 1 | 1 | 1.19% |
| POLION | 1 | 1 | 1.19% |
| Patriot | 1 | 1 | 1.19% |
| OCZ | 1 | 1 | 1.19% |
| Mushkin | 1 | 1 | 1.19% |
| Micron/Crucial Technology | 1 | 1 | 1.19% |
| Maxtor | 1 | 1 | 1.19% |
| MAXIO Technology (Hangzhou) | 1 | 1 | 1.19% |
| Magnetic Data | 1 | 1 | 1.19% |
| LITEONIT | 1 | 1 | 1.19% |
| KingSpec | 1 | 1 | 1.19% |
| Intel | 1 | 1 | 1.19% |
| Hitachi | 1 | 2 | 1.19% |
| Hikvision | 1 | 1 | 1.19% |
| HGST | 1 | 1 | 1.19% |
| GOODRAM | 1 | 1 | 1.19% |
| Gigabyte Technology | 1 | 1 | 1.19% |
| Corsair | 1 | 1 | 1.19% |
| China | 1 | 5 | 1.19% |
| Unknown | 1 | 1 | 1.19% |
Drive Model
Hard drive models


| Model | Desktops | Percent |
|---|---|---|
| Seagate ST500DM002-1BD142 500GB | 3 | 3.06% |
| Seagate ST2000DM008-2FR102 2TB | 3 | 3.06% |
| Samsung NVMe SSD Controller SM981/PM981/PM983 250GB | 3 | 3.06% |
| Crucial CT1000MX500SSD1 1TB | 3 | 3.06% |
| Seagate ST4000DM004-2CV104 4TB | 2 | 2.04% |
| Seagate ST2000DM001-1ER164 2TB | 2 | 2.04% |
| Seagate ST1000DM010-2EP102 1TB | 2 | 2.04% |
| Seagate ST1000DM003-1CH162 1TB | 2 | 2.04% |
| Phison PS5013 E13 NVMe Controller 256GB | 2 | 2.04% |
| Kingston SA400S37240G 240GB SSD | 2 | 2.04% |
| Kingston SA400S37120G 120GB SSD | 2 | 2.04% |
| WDC WDS500G2B0A-00SM50 500GB SSD | 1 | 1.02% |
| WDC WDS480G2G0A-00JH30 480GB SSD | 1 | 1.02% |
| WDC WDS120G1G0A-00SS50 120GB SSD | 1 | 1.02% |
| WDC WD80EDAZ-11TA3A0 8TB | 1 | 1.02% |
| WDC WD7500LPCX-60KHST0 752GB | 1 | 1.02% |
| WDC WD5000AAKX-60U6AA0 500GB | 1 | 1.02% |
| WDC WD40EZRZ-75GXCB0 4TB | 1 | 1.02% |
| WDC WD40EZRZ-22GXCB0 4TB | 1 | 1.02% |
| WDC WD40EZAZ-00SF3B0 4TB | 1 | 1.02% |
| WDC WD4000FYYZ-01UL1B1 4TB | 1 | 1.02% |
| WDC WD3200AAJS-56M0A0 320GB | 1 | 1.02% |
| WDC WD30EZRZ-00Z5HB0 3TB | 1 | 1.02% |
| WDC WD15EARS-00S8B1 1TB | 1 | 1.02% |
| WDC WD10EZEX-08WN4A0 1TB | 1 | 1.02% |
| walram 64G | 1 | 1.02% |
| Unknown SD/MMC/MS PRO 64GB | 1 | 1.02% |
| Toshiba HDWD240 4TB | 1 | 1.02% |
| Toshiba DT01ACA100 1TB | 1 | 1.02% |
| Silicon Motion SM2263EN/SM2263XT SSD Controller 1024GB | 1 | 1.02% |
| Seagate ST4000VN008-2DR166 4TB | 1 | 1.02% |
| Seagate ST380815AS 80GB | 1 | 1.02% |
| Seagate ST3250318AS 250GB | 1 | 1.02% |
| Seagate ST3000DM001-1CH166 3TB | 1 | 1.02% |
| Seagate ST2000DM001-1CH164 2TB | 1 | 1.02% |
| Seagate ST1000DM003-1SB102 1TB | 1 | 1.02% |
| Seagate ST1000DM003-1ER162 1TB | 1 | 1.02% |
| Seagate Expansion+ 2TB | 1 | 1.02% |
| SanDisk Ultra II 960GB SSD | 1 | 1.02% |
| SanDisk SDSSDH3 500G | 1 | 1.02% |
HDD Vendor
Hard disk drive vendors


| Vendor | Desktops | Drives | Percent |
|---|---|---|---|
| Seagate | 17 | 25 | 53.13% |
| WDC | 9 | 13 | 28.13% |
| Toshiba | 2 | 2 | 6.25% |
| Unknown | 1 | 1 | 3.13% |
| Maxtor | 1 | 1 | 3.13% |
| Hitachi | 1 | 2 | 3.13% |
| HGST | 1 | 1 | 3.13% |
SSD Vendor
Solid state drive vendors


| Vendor | Desktops | Drives | Percent |
|---|---|---|---|
| Samsung Electronics | 6 | 9 | 15.79% |
| Kingston | 6 | 6 | 15.79% |
| Crucial | 5 | 6 | 13.16% |
| A-DATA Technology | 4 | 4 | 10.53% |
| WDC | 3 | 3 | 7.89% |
| SanDisk | 2 | 2 | 5.26% |
| PNY | 2 | 2 | 5.26% |
| Patriot | 1 | 1 | 2.63% |
| OCZ | 1 | 1 | 2.63% |
| Mushkin | 1 | 1 | 2.63% |
| LITEONIT | 1 | 1 | 2.63% |
| KingSpec | 1 | 1 | 2.63% |
| Intel | 1 | 1 | 2.63% |
| Hikvision | 1 | 1 | 2.63% |
| GOODRAM | 1 | 1 | 2.63% |
| Gigabyte Technology | 1 | 1 | 2.63% |
| China | 1 | 5 | 2.63% |
Drive Kind
HDD or SSD


| Kind | Desktops | Drives | Percent |
|---|---|---|---|
| HDD | 26 | 45 | 42.62% |
| SSD | 20 | 46 | 32.79% |
| NVMe | 12 | 14 | 19.67% |
| Unknown | 3 | 4 | 4.92% |
Drive Connector
SATA, SAS, NVMe, etc.


| Type | Desktops | Drives | Percent |
|---|---|---|---|
| SATA | 32 | 92 | 68.09% |
| NVMe | 12 | 14 | 25.53% |
| SAS | 3 | 3 | 6.38% |
Drive Size
Size of hard drive


| Size in TB | Desktops | Drives | Percent |
|---|---|---|---|
| 0.01-0.5 | 24 | 50 | 42.86% |
| 0.51-1.0 | 16 | 20 | 28.57% |
| 1.01-2.0 | 7 | 7 | 12.5% |
| 3.01-4.0 | 6 | 10 | 10.71% |
| 2.01-3.0 | 2 | 2 | 3.57% |
| 4.01-10.0 | 1 | 2 | 1.79% |
Space Total
Amount of disk space available on the file system


| Size in GB | Desktops | Percent |
|---|---|---|
| 51-100 | 7 | 21.21% |
| 1001-2000 | 6 | 18.18% |
| 251-500 | 5 | 15.15% |
| 501-1000 | 5 | 15.15% |
| 101-250 | 4 | 12.12% |
| More than 3000 | 2 | 6.06% |
| 1-20 | 2 | 6.06% |
| 2001-3000 | 1 | 3.03% |
| Unknown | 1 | 3.03% |
Space Used
Amount of used disk space


| Used GB | Desktops | Percent |
|---|---|---|
| 1-20 | 15 | 45.45% |
| 251-500 | 4 | 12.12% |
| 21-50 | 4 | 12.12% |
| 501-1000 | 3 | 9.09% |
| 101-250 | 2 | 6.06% |
| 51-100 | 2 | 6.06% |
| More than 3000 | 1 | 3.03% |
| 1001-2000 | 1 | 3.03% |
| Unknown | 1 | 3.03% |
Malfunc. Drives
Drive models with a malfunction


| Model | Desktops | Drives | Percent |
|---|---|---|---|
| WDC WD3200AAJS-56M0A0 320GB | 1 | 1 | 25% |
| Seagate ST1000DM003-1ER162 1TB | 1 | 1 | 25% |
| Seagate ST1000DM003-1CH162 1TB | 1 | 1 | 25% |
| Samsung Electronics NVMe SSD Controller SM961/PM961/SM963 256GB | 1 | 1 | 25% |
Malfunc. Drive Vendor
Vendors of faulty drives


| Vendor | Desktops | Drives | Percent |
|---|---|---|---|
| Seagate | 2 | 2 | 50% |
| WDC | 1 | 1 | 25% |
| Samsung Electronics | 1 | 1 | 25% |
Malfunc. HDD Vendor
Vendors of faulty HDD drives


| Vendor | Desktops | Drives | Percent |
|---|---|---|---|
| Seagate | 2 | 2 | 66.67% |
| WDC | 1 | 1 | 33.33% |
Malfunc. Drive Kind
Kinds of faulty drives


| Kind | Desktops | Drives | Percent |
|---|---|---|---|
| HDD | 2 | 3 | 66.67% |
| NVMe | 1 | 1 | 33.33% |
Failed Drives
Failed drive models
Zero info for selected period =(
Failed Drive Vendor
Failed drive vendors
Zero info for selected period =(
Drive Status
Number of failed and malfunc. drives


| Status | Desktops | Drives | Percent |
|---|---|---|---|
| Detected | 27 | 95 | 75% |
| Works | 6 | 10 | 16.67% |
| Malfunc | 3 | 4 | 8.33% |
Storage controller
Storage Vendor
Storage controller vendors


| Vendor | Desktops | Percent |
|---|---|---|
| Intel | 22 | 39.29% |
| AMD | 10 | 17.86% |
| ASMedia Technology | 6 | 10.71% |
| Samsung Electronics | 5 | 8.93% |
| Phison Electronics | 4 | 7.14% |
| JMicron Technology | 3 | 5.36% |
| Silicon Motion | 1 | 1.79% |
| Realtek Semiconductor | 1 | 1.79% |
| Micron/Crucial Technology | 1 | 1.79% |
| MAXIO Technology (Hangzhou) | 1 | 1.79% |
| Marvell Technology Group | 1 | 1.79% |
| Kingston Technology Company | 1 | 1.79% |
Storage Model
Storage controller models


| Model | Desktops | Percent |
|---|---|---|
| Samsung NVMe SSD Controller SM981/PM981/PM983 | 4 | 6.56% |
| Intel 8 Series/C220 Series Chipset Family 6-port SATA Controller 1 [AHCI mode] | 4 | 6.56% |
| Intel 7 Series/C210 Series Chipset Family 6-port SATA Controller [AHCI mode] | 4 | 6.56% |
| ASMedia ASM1062 Serial ATA Controller | 4 | 6.56% |
| AMD 400 Series Chipset SATA Controller | 4 | 6.56% |
| AMD FCH SATA Controller [AHCI mode] | 3 | 4.92% |
| AMD 500 Series Chipset SATA Controller | 3 | 4.92% |
| Phison PS5013 E13 NVMe Controller | 2 | 3.28% |
| JMicron JMB363 SATA/IDE Controller | 2 | 3.28% |
| Intel 82801JI (ICH10 Family) SATA AHCI Controller | 2 | 3.28% |
| Intel 6 Series/C200 Series Chipset Family Desktop SATA Controller (IDE mode, ports 4-5) | 2 | 3.28% |
| Intel 6 Series/C200 Series Chipset Family Desktop SATA Controller (IDE mode, ports 0-3) | 2 | 3.28% |
| Intel 200 Series PCH SATA controller [AHCI mode] | 2 | 3.28% |
| Silicon Motion SM2263EN/SM2263XT SSD Controller | 1 | 1.64% |
| Samsung NVMe SSD Controller SM961/PM961/SM963 | 1 | 1.64% |
| Realtek RTS5763DL NVMe SSD Controller | 1 | 1.64% |
| Phison E16 PCIe4 NVMe Controller | 1 | 1.64% |
| Phison E12 NVMe Controller | 1 | 1.64% |
| Micron/Crucial P2 NVMe PCIe SSD | 1 | 1.64% |
| MAXIO (Hangzhou) NVMe SSD Controller MAP1202 | 1 | 1.64% |
| Marvell Group 88SE9230 PCIe 2.0 x2 4-port SATA 6 Gb/s RAID Controller | 1 | 1.64% |
| Kingston Company SNVS2000G [NV1 NVMe PCIe SSD 2TB] | 1 | 1.64% |
| JMicron JMB58x AHCI SATA controller | 1 | 1.64% |
| Intel Q170/Q150/B150/H170/H110/Z170/CM236 Chipset SATA Controller [AHCI Mode] | 1 | 1.64% |
| Intel NM10/ICH7 Family SATA Controller [IDE mode] | 1 | 1.64% |
| Intel Cannon Lake PCH SATA AHCI Controller | 1 | 1.64% |
| Intel C600/X79 series chipset 6-Port SATA AHCI Controller | 1 | 1.64% |
| Intel 9 Series Chipset Family SATA Controller [AHCI Mode] | 1 | 1.64% |
| Intel 82801HR/HO/HH (ICH8R/DO/DH) 2 port SATA Controller [IDE mode] | 1 | 1.64% |
| Intel 82801H (ICH8 Family) 4 port SATA Controller [IDE mode] | 1 | 1.64% |
| Intel 500 Series Chipset Family SATA AHCI Controller | 1 | 1.64% |
| Intel 5 Series/3400 Series Chipset 4 port SATA IDE Controller | 1 | 1.64% |
| Intel 5 Series/3400 Series Chipset 2 port SATA IDE Controller | 1 | 1.64% |
| ASMedia 106x SATA/RAID Controller | 1 | 1.64% |
| ASMedia 1064 SATA Controller | 1 | 1.64% |
| AMD FCH SATA Controller [IDE mode] | 1 | 1.64% |
Storage Kind
Kind of storage controller (IDE, SATA, NVMe, SAS, ...)


| Kind | Desktops | Percent |
|---|---|---|
| SATA | 27 | 61.36% |
| NVMe | 12 | 27.27% |
| IDE | 5 | 11.36% |
Processor
CPU Vendor
Processor vendors


| Vendor | Desktops | Percent |
|---|---|---|
| Intel | 22 | 66.67% |
| AMD | 11 | 33.33% |
CPU Model
Processor models


| Model | Desktops | Percent |
|---|---|---|
| Intel Core i7-4770K CPU @ 3.50GHz | 3 | 9.09% |
| Intel Celeron CPU G1610 @ 2.60GHz | 2 | 6.06% |
| Intel Xeon CPU X5690 @ 3.47GHz | 1 | 3.03% |
| Intel Pentium Gold G6400 CPU @ 4.00GHz | 1 | 3.03% |
| Intel Pentium CPU G2030T @ 2.60GHz | 1 | 3.03% |
| Intel Core i7-7820X CPU @ 3.60GHz | 1 | 3.03% |
| Intel Core i7-6700 CPU @ 3.40GHz | 1 | 3.03% |
| Intel Core i7-4790 CPU @ 3.60GHz | 1 | 3.03% |
| Intel Core i7-3930K CPU @ 3.20GHz | 1 | 3.03% |
| Intel Core i5-9600K CPU @ 3.70GHz | 1 | 3.03% |
| Intel Core i5-7400 CPU @ 3.00GHz | 1 | 3.03% |
| Intel Core i5-4570T CPU @ 2.90GHz | 1 | 3.03% |
| Intel Core i5-3470 CPU @ 3.20GHz | 1 | 3.03% |
| Intel Core i5-3350P CPU @ 3.10GHz | 1 | 3.03% |
| Intel Core i5 CPU 750 @ 2.67GHz | 1 | 3.03% |
| Intel Core i3-3220 CPU @ 3.30GHz | 1 | 3.03% |
| Intel Core 2 Quad CPU Q9650 @ 3.00GHz | 1 | 3.03% |
| Intel Core 2 Quad CPU Q6600 @ 2.40GHz | 1 | 3.03% |
| Intel Core 2 Duo CPU E8500 @ 3.16GHz | 1 | 3.03% |
| AMD Ryzen 9 3900X 12-Core Processor | 1 | 3.03% |
| AMD Ryzen 7 5700X 8-Core Processor | 1 | 3.03% |
| AMD Ryzen 7 3800X 8-Core Processor | 1 | 3.03% |
| AMD Ryzen 7 3700X 8-Core Processor | 1 | 3.03% |
| AMD Ryzen 5 5600G with Radeon Graphics | 1 | 3.03% |
| AMD Ryzen 5 5500 | 1 | 3.03% |
| AMD Ryzen 5 3600 6-Core Processor | 1 | 3.03% |
| AMD Ryzen 5 2400G with Radeon Vega Graphics | 1 | 3.03% |
| AMD Ryzen 3 3200G with Radeon Vega Graphics | 1 | 3.03% |
| AMD A8-5545M APU with Radeon HD Graphics | 1 | 3.03% |
| AMD A10-9630P RADEON R5, 10 COMPUTE CORES 4C+6G | 1 | 3.03% |
CPU Model Family
Processor model prefix


| Model | Desktops | Percent |
|---|---|---|
| Intel Core i7 | 7 | 21.21% |
| Intel Core i5 | 6 | 18.18% |
| AMD Ryzen 5 | 4 | 12.12% |
| AMD Ryzen 7 | 3 | 9.09% |
| Intel Core 2 Quad | 2 | 6.06% |
| Intel Celeron | 2 | 6.06% |
| Intel Xeon | 1 | 3.03% |
| Intel Pentium Gold | 1 | 3.03% |
| Intel Pentium | 1 | 3.03% |
| Intel Core i3 | 1 | 3.03% |
| Intel Core 2 Duo | 1 | 3.03% |
| AMD Ryzen 9 | 1 | 3.03% |
| AMD Ryzen 3 | 1 | 3.03% |
| AMD A8 | 1 | 3.03% |
| AMD A10 | 1 | 3.03% |
CPU Cores
Number of processor cores


| Number | Desktops | Percent |
|---|---|---|
| 4 | 13 | 39.39% |
| 2 | 9 | 27.27% |
| 6 | 5 | 15.15% |
| 8 | 4 | 12.12% |
| 12 | 2 | 6.06% |
CPU Sockets
Number of sockets


| Number | Desktops | Percent |
|---|---|---|
| 1 | 32 | 96.97% |
| 2 | 1 | 3.03% |
CPU Threads
Threads per core (Hyper-Threading)


| Number | Desktops | Percent |
|---|---|---|
| 2 | 20 | 60.61% |
| 1 | 13 | 39.39% |
CPU Op-Modes
CPU Operation Modes (32-bit, 64-bit)


| Op mode | Desktops | Percent |
|---|---|---|
| 32-bit, 64-bit | 33 | 100% |
CPU Microcode
Microcode number


| Number | Desktops | Percent |
|---|---|---|
| Unknown | 27 | 81.82% |
| 0x306a9 | 2 | 6.06% |
| 0x906ed | 1 | 3.03% |
| 0x50654 | 1 | 3.03% |
| 0x306c3 | 1 | 3.03% |
| 0x08701021 | 1 | 3.03% |
CPU Microarch
Microarchitecture


| Name | Desktops | Percent |
|---|---|---|
| IvyBridge | 6 | 18.18% |
| Haswell | 5 | 15.15% |
| Zen 2 | 4 | 12.12% |
| Zen 3 | 3 | 9.09% |
| Skylake | 2 | 6.06% |
| Penryn | 2 | 6.06% |
| KabyLake | 2 | 6.06% |
| Zen+ | 1 | 3.03% |
| Zen | 1 | 3.03% |
| Westmere | 1 | 3.03% |
| SandyBridge | 1 | 3.03% |
| Piledriver | 1 | 3.03% |
| Nehalem | 1 | 3.03% |
| Excavator | 1 | 3.03% |
| Core | 1 | 3.03% |
| CometLake | 1 | 3.03% |
Graphics
GPU Vendor
Vendors of graphics cards


| Vendor | Desktops | Percent |
|---|---|---|
| Nvidia | 17 | 48.57% |
| AMD | 11 | 31.43% |
| Intel | 7 | 20% |
GPU Model
Graphics card models


| Model | Desktops | Percent |
|---|---|---|
| Intel Xeon E3-1200 v2/3rd Gen Core processor Graphics Controller | 4 | 11.43% |
| AMD Ellesmere [Radeon RX 470/480/570/570X/580/580X/590] | 4 | 11.43% |
| Nvidia TU104 [GeForce RTX 2060] | 2 | 5.71% |
| Nvidia GP102 [GeForce GTX 1080 Ti] | 2 | 5.71% |
| Nvidia TU116 [GeForce GTX 1650 SUPER] | 1 | 2.86% |
| Nvidia TU102 [GeForce RTX 2080 Ti] | 1 | 2.86% |
| Nvidia GP107 [GeForce GTX 1050] | 1 | 2.86% |
| Nvidia GP106 [GeForce GTX 1060 6GB] | 1 | 2.86% |
| Nvidia GM206GL [Quadro M2000] | 1 | 2.86% |
| Nvidia GM206 [GeForce GTX 960] | 1 | 2.86% |
| Nvidia GM206 [GeForce GTX 950] | 1 | 2.86% |
| Nvidia GM107GL [Quadro K2200] | 1 | 2.86% |
| Nvidia GK104 [GeForce GTX 660 OEM] | 1 | 2.86% |
| Nvidia GA106 [GeForce RTX 3060 Lite Hash Rate] | 1 | 2.86% |
| Nvidia GA104 [GeForce RTX 3060 Ti] | 1 | 2.86% |
| Nvidia G96C [GeForce 9500 GT] | 1 | 2.86% |
| Nvidia G86 [Quadro NVS 290] | 1 | 2.86% |
| Intel Xeon E3-1200 v3/4th Gen Core Processor Integrated Graphics Controller | 1 | 2.86% |
| Intel HD Graphics 530 | 1 | 2.86% |
| Intel CometLake-S GT1 [UHD Graphics 610] | 1 | 2.86% |
| AMD Wani [Radeon R5/R6/R7 Graphics] | 1 | 2.86% |
| AMD Richland [Radeon HD 8510G] | 1 | 2.86% |
| AMD Raven Ridge [Radeon Vega Series / Radeon Vega Mobile Series] | 1 | 2.86% |
| AMD Picasso/Raven 2 [Radeon Vega Series / Radeon Vega Mobile Series] | 1 | 2.86% |
| AMD Navi 21 [Radeon RX 6800/6800 XT / 6900 XT] | 1 | 2.86% |
| AMD Cypress PRO [Radeon HD 5850] | 1 | 2.86% |
| AMD Cezanne [Radeon Vega Series / Radeon Vega Mobile Series] | 1 | 2.86% |
GPU Combo
Combinations of graphics cards


| Name | Desktops | Percent |
|---|---|---|
| 1 x Nvidia | 15 | 45.45% |
| 1 x AMD | 10 | 30.3% |
| 1 x Intel | 6 | 18.18% |
| Intel + Nvidia | 1 | 3.03% |
| AMD + Nvidia | 1 | 3.03% |
GPU Driver
Free vs proprietary


| Driver | Desktops | Percent |
|---|---|---|
| Free | 27 | 81.82% |
| Proprietary | 6 | 18.18% |
GPU Memory
Total video memory


| Size in GB | Desktops | Percent |
|---|---|---|
| Unknown | 25 | 75.76% |
| 7.01-8.0 | 2 | 6.06% |
| 3.01-4.0 | 2 | 6.06% |
| 8.01-16.0 | 2 | 6.06% |
| 5.01-6.0 | 1 | 3.03% |
| 1.01-2.0 | 1 | 3.03% |
Monitor
Monitor Vendor
Monitor vendors


| Vendor | Desktops | Percent |
|---|---|---|
| Samsung Electronics | 3 | 10.34% |
| Hewlett-Packard | 3 | 10.34% |
| Dell | 3 | 10.34% |
| LG Electronics | 2 | 6.9% |
| BenQ | 2 | 6.9% |
| Xiaomi | 1 | 3.45% |
| Toshiba | 1 | 3.45% |
| Sony | 1 | 3.45% |
| OEM | 1 | 3.45% |
| Marantz | 1 | 3.45% |
| Lenovo | 1 | 3.45% |
| Iiyama | 1 | 3.45% |
| Huion | 1 | 3.45% |
| Goldstar | 1 | 3.45% |
| Fujitsu Siemens | 1 | 3.45% |
| Eizo | 1 | 3.45% |
| ASUSTek Computer | 1 | 3.45% |
| AOC | 1 | 3.45% |
| Ancor Communications | 1 | 3.45% |
| AGO | 1 | 3.45% |
| Acer | 1 | 3.45% |
Monitor Model
Monitor models


| Model | Desktops | Percent |
|---|---|---|
| LG Electronics LCD Monitor 27GL850 2560x1440 | 2 | 6.45% |
| Xiaomi Mi TV XMD00E1 1360x768 708x398mm 32.0-inch | 1 | 3.23% |
| Toshiba TV TSB0206 1920x1080 | 1 | 3.23% |
| Sony TV SNY1503 1360x768 | 1 | 3.23% |
| Samsung Electronics SMBX2231 SAM076D 1920x1080 477x268mm 21.5-inch | 1 | 3.23% |
| Samsung Electronics LCD Monitor SAM0F14 3840x2160 1872x1053mm 84.6-inch | 1 | 3.23% |
| Samsung Electronics LCD Monitor SAM0F13 3840x2160 1872x1053mm 84.6-inch | 1 | 3.23% |
| Samsung Electronics LCD Monitor SAM0D3B 3840x2160 1020x570mm 46.0-inch | 1 | 3.23% |
| OEM 32W_LCD_TV OEM3700 1920x540 | 1 | 3.23% |
| Marantz AVR MJI004E 1920x1080 708x398mm 32.0-inch | 1 | 3.23% |
| Lenovo LEN L24q-30 LEN65FB 2560x1440 527x296mm 23.8-inch | 1 | 3.23% |
| Iiyama PL2083H IVM53A1 1600x900 434x236mm 19.4-inch | 1 | 3.23% |
| Huion Kamvas Pro 16 HAT1602 2560x1440 349x208mm 16.0-inch | 1 | 3.23% |
| Hewlett-Packard S2031 HWP2903 1600x900 443x249mm 20.0-inch | 1 | 3.23% |
| Hewlett-Packard 27xq HPN3582 2560x1440 597x336mm 27.0-inch | 1 | 3.23% |
| Hewlett-Packard 27ea HPN3395 1920x1080 527x296mm 23.8-inch | 1 | 3.23% |
| Goldstar 24GL600F GSM5B73 1920x1080 531x298mm 24.0-inch | 1 | 3.23% |
| Goldstar 24GL600F GSM5B72 1920x1080 531x298mm 24.0-inch | 1 | 3.23% |
| Fujitsu Siemens B19-5 FUS06AB 1280x1024 376x301mm 19.0-inch | 1 | 3.23% |
| Eizo EV3285 ENC2979 3840x2160 698x393mm 31.5-inch | 1 | 3.23% |
| Dell S2719DM DEL4165 2560x1440 597x336mm 27.0-inch | 1 | 3.23% |
| Dell LCD Monitor U2412M 1920x1200 | 1 | 3.23% |
| Dell 20 DELF112 1600x900 443x249mm 20.0-inch | 1 | 3.23% |
| BenQ GW2780 BNQ78E6 1920x1080 598x336mm 27.0-inch | 1 | 3.23% |
| BenQ GW2270 BNQ78DB 1920x1080 476x268mm 21.5-inch | 1 | 3.23% |
| ASUSTek Computer VZ249 AUS24CC 1920x1080 527x296mm 23.8-inch | 1 | 3.23% |
| AOC 27B2G5 AOC2702 1920x1080 598x336mm 27.0-inch | 1 | 3.23% |
| Ancor Communications ROG PG279Q ACI27EC 2560x1440 598x336mm 27.0-inch | 1 | 3.23% |
| AGO LCD Monitor AGO0001 1920x1080 256x192mm 12.6-inch | 1 | 3.23% |
| Acer X34 ACR0462 3440x1440 797x333mm 34.0-inch | 1 | 3.23% |
Monitor Resolution
Monitor screen resolution


| Resolution | Desktops | Percent |
|---|---|---|
| 1920x1080 (FHD) | 10 | 35.71% |
| 2560x1440 (QHD) | 6 | 21.43% |
| 3840x2160 (4K) | 5 | 17.86% |
| 1600x900 (HD+) | 2 | 7.14% |
| 3440x1440 | 1 | 3.57% |
| 1920x540 | 1 | 3.57% |
| 1920x1200 (WUXGA) | 1 | 3.57% |
| 1360x768 | 1 | 3.57% |
| 1280x1024 (SXGA) | 1 | 3.57% |
Monitor Diagonal
Diagonal size in inches


| Inches | Desktops | Percent |
|---|---|---|
| 24 | 6 | 20.69% |
| 27 | 5 | 17.24% |
| Unknown | 3 | 10.34% |
| 84 | 2 | 6.9% |
| 21 | 2 | 6.9% |
| 19 | 2 | 6.9% |
| 74 | 1 | 3.45% |
| 72 | 1 | 3.45% |
| 65 | 1 | 3.45% |
| 34 | 1 | 3.45% |
| 32 | 1 | 3.45% |
| 31 | 1 | 3.45% |
| 20 | 1 | 3.45% |
| 16 | 1 | 3.45% |
| 12 | 1 | 3.45% |
Monitor Width
Physical width


| Width in mm | Desktops | Percent |
|---|---|---|
| 501-600 | 11 | 37.93% |
| 401-500 | 4 | 13.79% |
| 1501-2000 | 4 | 13.79% |
| Unknown | 3 | 10.34% |
| 701-800 | 2 | 6.9% |
| 601-700 | 1 | 3.45% |
| 351-400 | 1 | 3.45% |
| 301-350 | 1 | 3.45% |
| 201-300 | 1 | 3.45% |
| 1001-1500 | 1 | 3.45% |
Aspect Ratio
Proportional relationship between the width and the height


| Ratio | Desktops | Percent |
|---|---|---|
| 16/9 | 20 | 74.07% |
| Unknown | 3 | 11.11% |
| 5/4 | 1 | 3.7% |
| 4/3 | 1 | 3.7% |
| 21/9 | 1 | 3.7% |
| 16/10 | 1 | 3.7% |
Monitor Area
Area in inch²


| Area in inch² | Desktops | Percent |
|---|---|---|
| 201-250 | 8 | 27.59% |
| More than 1000 | 5 | 17.24% |
| 301-350 | 5 | 17.24% |
| 351-500 | 3 | 10.34% |
| 151-200 | 3 | 10.34% |
| Unknown | 3 | 10.34% |
| 71-80 | 1 | 3.45% |
| 111-120 | 1 | 3.45% |
Pixel Density
Pixels per inch


| Density | Desktops | Percent |
|---|---|---|
| 51-100 | 13 | 46.43% |
| 101-120 | 6 | 21.43% |
| Unknown | 3 | 10.71% |
| 1-50 | 2 | 7.14% |
| 161-240 | 2 | 7.14% |
| 121-160 | 2 | 7.14% |
Multiple Monitors
Total monitors connected


| Total | Desktops | Percent |
|---|---|---|
| 1 | 30 | 90.91% |
| 2 | 3 | 9.09% |
Network
Net Controller Vendor
Controller vendors


| Vendor | Desktops | Percent |
|---|---|---|
| Realtek Semiconductor | 20 | 38.46% |
| Intel | 13 | 25% |
| Qualcomm Atheros | 4 | 7.69% |
| TP-Link | 2 | 3.85% |
| D-Link System | 2 | 3.85% |
| Broadcom Limited | 2 | 3.85% |
| Samsung Electronics | 1 | 1.92% |
| Ralink Technology | 1 | 1.92% |
| NetGear | 1 | 1.92% |
| Motorola PCS | 1 | 1.92% |
| Microsoft | 1 | 1.92% |
| Marvell Technology Group | 1 | 1.92% |
| D-Link | 1 | 1.92% |
| Broadcom | 1 | 1.92% |
| Aquantia | 1 | 1.92% |
Net Controller Model
Controller models


| Model | Desktops | Percent |
|---|---|---|
| Realtek RTL8111/8168/8411 PCI Express Gigabit Ethernet Controller | 18 | 33.33% |
| Intel Wi-Fi 6 AX210/AX211/AX411 160MHz | 2 | 3.7% |
| Intel Ethernet Connection I217-V | 2 | 3.7% |
| Intel Dual Band Wireless-AC 3168NGW [Stone Peak] | 2 | 3.7% |
| Intel 82579V Gigabit Network Connection | 2 | 3.7% |
| Broadcom Limited BCM4360 802.11ac Wireless Network Adapter | 2 | 3.7% |
| TP-Link AC600 wireless Realtek RTL8811AU [Archer T2U Nano] | 1 | 1.85% |
| TP-Link 802.11ac NIC | 1 | 1.85% |
| Samsung GT-I9070 (network tethering, USB debugging enabled) | 1 | 1.85% |
| Realtek RTL8192CU 802.11n WLAN Adapter | 1 | 1.85% |
| Realtek RTL8125 2.5GbE Controller | 1 | 1.85% |
| Realtek 802.11ac NIC | 1 | 1.85% |
| Ralink RT2870/RT3070 Wireless Adapter | 1 | 1.85% |
| Qualcomm Atheros Killer E2500 Gigabit Ethernet Controller | 1 | 1.85% |
| Qualcomm Atheros Killer E220x Gigabit Ethernet Controller | 1 | 1.85% |
| Qualcomm Atheros AR9485 Wireless Network Adapter | 1 | 1.85% |
| Qualcomm Atheros AR9287 Wireless Network Adapter (PCI-Express) | 1 | 1.85% |
| Qualcomm Atheros AR8121/AR8113/AR8114 Gigabit or Fast Ethernet | 1 | 1.85% |
| NetGear WNA3100(v1) Wireless-N 300 [Broadcom BCM43231] | 1 | 1.85% |
| Motorola PCS moto g pure | 1 | 1.85% |
| Microsoft Xbox360 Wireless N Networking Adapter [Atheros AR7010+AR9280] | 1 | 1.85% |
| Marvell Group 88E8053 PCI-E Gigabit Ethernet Controller | 1 | 1.85% |
| Intel Wi-Fi 6 AX200 | 1 | 1.85% |
| Intel Ethernet Connection (7) I219-V | 1 | 1.85% |
| Intel Ethernet Connection (2) I219-V | 1 | 1.85% |
| Intel 82579LM Gigabit Network Connection (Lewisville) | 1 | 1.85% |
| Intel 82574L Gigabit Network Connection | 1 | 1.85% |
| D-Link System DWA-140 RangeBooster N Adapter(rev.B2) [Ralink RT3072] | 1 | 1.85% |
| D-Link System DGE-528T Gigabit Ethernet Adapter | 1 | 1.85% |
| D-Link 802.11 n WLAN | 1 | 1.85% |
| Broadcom 802.11a/b/g/n/ac Wireless Adapter | 1 | 1.85% |
| Aquantia AQC107 NBase-T/IEEE 802.3bz Ethernet Controller [AQtion] | 1 | 1.85% |
Wireless Vendor
Wireless vendors


| Vendor | Desktops | Percent |
|---|---|---|
| Intel | 5 | 26.32% |
| TP-Link | 2 | 10.53% |
| Realtek Semiconductor | 2 | 10.53% |
| Qualcomm Atheros | 2 | 10.53% |
| Broadcom Limited | 2 | 10.53% |
| Ralink Technology | 1 | 5.26% |
| NetGear | 1 | 5.26% |
| Microsoft | 1 | 5.26% |
| D-Link System | 1 | 5.26% |
| D-Link | 1 | 5.26% |
| Broadcom | 1 | 5.26% |
Wireless Model
Wireless models


| Model | Desktops | Percent |
|---|---|---|
| Intel Wi-Fi 6 AX210/AX211/AX411 160MHz | 2 | 10.53% |
| Intel Dual Band Wireless-AC 3168NGW [Stone Peak] | 2 | 10.53% |
| Broadcom Limited BCM4360 802.11ac Wireless Network Adapter | 2 | 10.53% |
| TP-Link AC600 wireless Realtek RTL8811AU [Archer T2U Nano] | 1 | 5.26% |
| TP-Link 802.11ac NIC | 1 | 5.26% |
| Realtek RTL8192CU 802.11n WLAN Adapter | 1 | 5.26% |
| Realtek 802.11ac NIC | 1 | 5.26% |
| Ralink RT2870/RT3070 Wireless Adapter | 1 | 5.26% |
| Qualcomm Atheros AR9485 Wireless Network Adapter | 1 | 5.26% |
| Qualcomm Atheros AR9287 Wireless Network Adapter (PCI-Express) | 1 | 5.26% |
| NetGear WNA3100(v1) Wireless-N 300 [Broadcom BCM43231] | 1 | 5.26% |
| Microsoft Xbox360 Wireless N Networking Adapter [Atheros AR7010+AR9280] | 1 | 5.26% |
| Intel Wi-Fi 6 AX200 | 1 | 5.26% |
| D-Link System DWA-140 RangeBooster N Adapter(rev.B2) [Ralink RT3072] | 1 | 5.26% |
| D-Link 802.11 n WLAN | 1 | 5.26% |
| Broadcom 802.11a/b/g/n/ac Wireless Adapter | 1 | 5.26% |
Ethernet Vendor
Ethernet vendors


| Vendor | Desktops | Percent |
|---|---|---|
| Realtek Semiconductor | 19 | 54.29% |
| Intel | 8 | 22.86% |
| Qualcomm Atheros | 3 | 8.57% |
| Samsung Electronics | 1 | 2.86% |
| Motorola PCS | 1 | 2.86% |
| Marvell Technology Group | 1 | 2.86% |
| D-Link System | 1 | 2.86% |
| Aquantia | 1 | 2.86% |
Ethernet Model
Ethernet models


| Model | Desktops | Percent |
|---|---|---|
| Realtek RTL8111/8168/8411 PCI Express Gigabit Ethernet Controller | 18 | 51.43% |
| Intel Ethernet Connection I217-V | 2 | 5.71% |
| Intel 82579V Gigabit Network Connection | 2 | 5.71% |
| Samsung GT-I9070 (network tethering, USB debugging enabled) | 1 | 2.86% |
| Realtek RTL8125 2.5GbE Controller | 1 | 2.86% |
| Qualcomm Atheros Killer E2500 Gigabit Ethernet Controller | 1 | 2.86% |
| Qualcomm Atheros Killer E220x Gigabit Ethernet Controller | 1 | 2.86% |
| Qualcomm Atheros AR8121/AR8113/AR8114 Gigabit or Fast Ethernet | 1 | 2.86% |
| Motorola PCS moto g pure | 1 | 2.86% |
| Marvell Group 88E8053 PCI-E Gigabit Ethernet Controller | 1 | 2.86% |
| Intel Ethernet Connection (7) I219-V | 1 | 2.86% |
| Intel Ethernet Connection (2) I219-V | 1 | 2.86% |
| Intel 82579LM Gigabit Network Connection (Lewisville) | 1 | 2.86% |
| Intel 82574L Gigabit Network Connection | 1 | 2.86% |
| D-Link System DGE-528T Gigabit Ethernet Adapter | 1 | 2.86% |
| Aquantia AQC107 NBase-T/IEEE 802.3bz Ethernet Controller [AQtion] | 1 | 2.86% |
Net Controller Kind
Ethernet, WiFi or modem


| Kind | Desktops | Percent |
|---|---|---|
| Ethernet | 31 | 63.27% |
| WiFi | 18 | 36.73% |
Used Controller
Currently used network controller


| Kind | Desktops | Percent |
|---|---|---|
| Ethernet | 22 | 66.67% |
| WiFi | 11 | 33.33% |
NICs
Total network controllers on board


| Total | Desktops | Percent |
|---|---|---|
| 1 | 20 | 60.61% |
| 2 | 10 | 30.3% |
| 0 | 2 | 6.06% |
| 3 | 1 | 3.03% |
IPv6
IPv6 vs IPv4


| Used | Desktops | Percent |
|---|---|---|
| No | 21 | 63.64% |
| Yes | 12 | 36.36% |
Bluetooth
Bluetooth Vendor
Controller vendors


| Vendor | Desktops | Percent |
|---|---|---|
| Intel | 5 | 33.33% |
| Cambridge Silicon Radio | 4 | 26.67% |
| Apple | 2 | 13.33% |
| TP-Link | 1 | 6.67% |
| Realtek Semiconductor | 1 | 6.67% |
| Qualcomm Atheros Communications | 1 | 6.67% |
| ASUSTek Computer | 1 | 6.67% |
Bluetooth Model
Controller models


| Model | Desktops | Percent |
|---|---|---|
| Cambridge Silicon Radio Bluetooth Dongle (HCI mode) | 4 | 26.67% |
| Intel Wireless-AC 3168 Bluetooth | 2 | 13.33% |
| Intel AX210 Bluetooth | 2 | 13.33% |
| Apple Bluetooth USB Host Controller | 2 | 13.33% |
| TP-Link UB500 Adapter | 1 | 6.67% |
| Realtek Bluetooth Radio | 1 | 6.67% |
| Qualcomm Atheros Bluetooth USB Host Controller | 1 | 6.67% |
| Intel AX200 Bluetooth | 1 | 6.67% |
| ASUS Bluetooth Adapter | 1 | 6.67% |
Sound
Sound Vendor
Sound card vendors


| Vendor | Desktops | Percent |
|---|---|---|
| Intel | 20 | 31.75% |
| AMD | 16 | 25.4% |
| Nvidia | 15 | 23.81% |
| Creative Labs | 2 | 3.17% |
| Yamaha | 1 | 1.59% |
| Thesycon Systemsoftware & Consulting | 1 | 1.59% |
| Texas Instruments | 1 | 1.59% |
| SteelSeries ApS | 1 | 1.59% |
| Realtek Semiconductor | 1 | 1.59% |
| Razer USA | 1 | 1.59% |
| Plantronics | 1 | 1.59% |
| Focusrite-Novation | 1 | 1.59% |
| Creative Technology | 1 | 1.59% |
| C-Media Electronics | 1 | 1.59% |
Sound Model
Sound card models

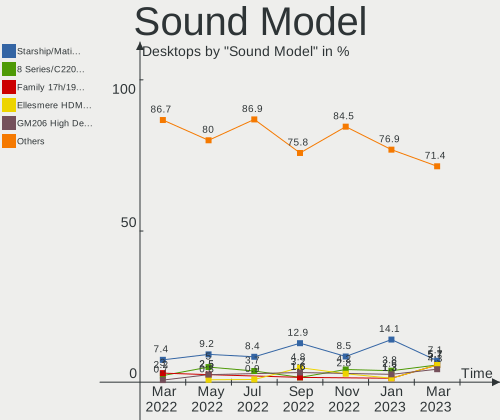
| Model | Desktops | Percent |
|---|---|---|
| AMD Starship/Matisse HD Audio Controller | 5 | 7.14% |
| Intel 8 Series/C220 Series Chipset High Definition Audio Controller | 4 | 5.71% |
| AMD Family 17h/19h HD Audio Controller | 4 | 5.71% |
| AMD Ellesmere HDMI Audio [Radeon RX 470/480 / 570/580/590] | 4 | 5.71% |
| Nvidia GM206 High Definition Audio Controller | 3 | 4.29% |
| Intel 7 Series/C216 Chipset Family High Definition Audio Controller | 3 | 4.29% |
| Nvidia TU104 HD Audio Controller | 2 | 2.86% |
| Nvidia GP102 HDMI Audio Controller | 2 | 2.86% |
| Intel 82801JI (ICH10 Family) HD Audio Controller | 2 | 2.86% |
| Intel 6 Series/C200 Series Chipset Family High Definition Audio Controller | 2 | 2.86% |
| Creative Labs CA0132 Sound Core3D [Sound Blaster Recon3D / Z-Series / Sound BlasterX AE-5 Plus] | 2 | 2.86% |
| AMD Renoir Radeon High Definition Audio Controller | 2 | 2.86% |
| AMD Raven/Raven2/Fenghuang HDMI/DP Audio Controller | 2 | 2.86% |
| Yamaha Steinberg UR22C | 1 | 1.43% |
| Thesycon Systemsoftware & Consulting DX3 Pro+ | 1 | 1.43% |
| Texas Instruments PCM2902 Audio Codec | 1 | 1.43% |
| SteelSeries ApS Arctis Pro Wireless | 1 | 1.43% |
| Realtek Semiconductor Realtek USB2.0 Audio | 1 | 1.43% |
| Razer USA Razer Barracuda X | 1 | 1.43% |
| Plantronics Savi 8200 Office Series | 1 | 1.43% |
| Nvidia TU116 High Definition Audio Controller | 1 | 1.43% |
| Nvidia TU102 High Definition Audio Controller | 1 | 1.43% |
| Nvidia GP107GL High Definition Audio Controller | 1 | 1.43% |
| Nvidia GP106 High Definition Audio Controller | 1 | 1.43% |
| Nvidia GM107 High Definition Audio Controller [GeForce 940MX] | 1 | 1.43% |
| Nvidia GK104 HDMI Audio Controller | 1 | 1.43% |
| Nvidia GA106 High Definition Audio Controller | 1 | 1.43% |
| Nvidia GA104 High Definition Audio Controller | 1 | 1.43% |
| Intel Xeon E3-1200 v3/4th Gen Core Processor HD Audio Controller | 1 | 1.43% |
| Intel Smart Sound Technology (SST) Audio Controller | 1 | 1.43% |
| Intel NM10/ICH7 Family High Definition Audio Controller | 1 | 1.43% |
| Intel Cannon Lake PCH cAVS | 1 | 1.43% |
| Intel C600/X79 series chipset High Definition Audio Controller | 1 | 1.43% |
| Intel 9 Series Chipset Family HD Audio Controller | 1 | 1.43% |
| Intel 82801H (ICH8 Family) HD Audio Controller | 1 | 1.43% |
| Intel 5 Series/3400 Series Chipset High Definition Audio | 1 | 1.43% |
| Intel 200 Series PCH HD Audio | 1 | 1.43% |
| Intel 100 Series/C230 Series Chipset Family HD Audio Controller | 1 | 1.43% |
| Focusrite-Novation Focusrite Scarlett 2i2 | 1 | 1.43% |
| Creative Technology Sound Blaster Play! 3 | 1 | 1.43% |
Memory
Memory Vendor
Memory module vendors


| Vendor | Desktops | Percent |
|---|---|---|
| Unknown | 1 | 20% |
| Samsung Electronics | 1 | 20% |
| Kingston | 1 | 20% |
| G.Skill | 1 | 20% |
| Corsair | 1 | 20% |
Memory Model
Memory module models


| Model | Desktops | Percent |
|---|---|---|
| Unknown RAM Module 8GB DIMM DDR4 3200MT/s | 1 | 16.67% |
| Samsung RAM M378B5173QH0-CK0 4GB DIMM DDR3 1600MT/s | 1 | 16.67% |
| Kingston RAM KHX1866C10D3/8G 8GB DIMM DDR3 2133MT/s | 1 | 16.67% |
| Kingston RAM KHX1600C9D3/4GX 4GB DIMM DDR3 1600MT/s | 1 | 16.67% |
| G.Skill RAM F4-3600C16-16GVKC 16GB DIMM DDR4 3866MT/s | 1 | 16.67% |
| Corsair RAM CMK32GX4M2A2666C16 16GB DIMM DDR4 3100MT/s | 1 | 16.67% |
Memory Kind
Memory module kinds


| Kind | Desktops | Percent |
|---|---|---|
| DDR4 | 3 | 60% |
| DDR3 | 2 | 40% |
Memory Form Factor
Physical design of the memory module


| Name | Desktops | Percent |
|---|---|---|
| DIMM | 5 | 100% |
Memory Size
Memory module size


| Size | Desktops | Percent |
|---|---|---|
| 16384 | 2 | 33.33% |
| 8192 | 2 | 33.33% |
| 4096 | 2 | 33.33% |
Memory Speed
Memory module speed


| Speed | Desktops | Percent |
|---|---|---|
| 3866 | 1 | 16.67% |
| 3200 | 1 | 16.67% |
| 3100 | 1 | 16.67% |
| 2400 | 1 | 16.67% |
| 2133 | 1 | 16.67% |
| 1866 | 1 | 16.67% |
Printers & scanners
Printer Vendor
Printer device vendors


| Vendor | Desktops | Percent |
|---|---|---|
| Seiko Epson | 1 | 100% |
Printer Model
Printer device models


| Model | Desktops | Percent |
|---|---|---|
| Seiko Epson ET-2820 Series | 1 | 100% |
Scanner Vendor
Scanner device vendors
Zero info for selected period =(
Scanner Model
Scanner device models
Zero info for selected period =(
Camera
Camera Vendor
Camera device vendors


| Vendor | Desktops | Percent |
|---|---|---|
| Logitech | 2 | 33.33% |
| Sunplus Innovation Technology | 1 | 16.67% |
| Realtek Semiconductor | 1 | 16.67% |
| IMC Networks | 1 | 16.67% |
| Hopewin Electronic Material | 1 | 16.67% |
Camera Model
Camera device models


| Model | Desktops | Percent |
|---|---|---|
| Sunplus SPCA2281 Web Camera | 1 | 16.67% |
| Realtek Laptop_Integrated_Webcam_HD | 1 | 16.67% |
| Logitech Webcam C270 | 1 | 16.67% |
| Logitech BRIO Ultra HD Webcam | 1 | 16.67% |
| IMC Networks XHC Camera | 1 | 16.67% |
| Hopewin Electronic Material Integrated RGB Camera | 1 | 16.67% |
Security
Fingerprint Vendor
Fingerprint sensor vendors
Zero info for selected period =(
Fingerprint Model
Fingerprint sensor models
Zero info for selected period =(
Chipcard Vendor
Chipcard module vendors
Zero info for selected period =(
Chipcard Model
Chipcard module models
Zero info for selected period =(
Unsupported
Unsupported Devices
Total unsupported devices on board


| Total | Desktops | Percent |
|---|---|---|
| 0 | 29 | 87.88% |
| 1 | 3 | 9.09% |
| 2 | 1 | 3.03% |
Unsupported Device Types
Types of unsupported devices


| Type | Desktops | Percent |
|---|---|---|
| Net/wireless | 4 | 80% |
| Graphics card | 1 | 20% |