Debian - Hardware Trends
A project to identify most popular hardware characteristics and track their change over time based on data collected by Linux users at https://Linux-Hardware.org.
Anyone can contribute to this report by the hw-probe tool:
sudo -E hw-probe -all -uploadThis is a report for all computer types. See also reports for desktops and notebooks.
This report is for one last month. Overall report since the beginning of time: TestDays
Period: Mar, 2023.
Contents
System
OS
Installed operating systems


| Name | Computers | Percent |
|---|---|---|
| Debian 11 | 369 | 77.2% |
| Debian | 61 | 12.76% |
| Debian 12 | 34 | 7.11% |
| Debian 10 | 12 | 2.51% |
| Debian Sid | 1 | 0.21% |
| Debian 11-updates | 1 | 0.21% |
OS Family
OS without a version


| Name | Computers | Percent |
|---|---|---|
| Debian | 478 | 100% |
Kernel
Version of the Linux kernel


| Version | Computers | Percent |
|---|---|---|
| 5.10.0-21-amd64 | 151 | 31.59% |
| 5.10.0-20-amd64 | 69 | 14.44% |
| 6.1.0-6-amd64 | 37 | 7.74% |
| 6.1.0-5-amd64 | 27 | 5.65% |
| 6.0.0-0.deb11.6-amd64 | 24 | 5.02% |
| 5.15.85-1-pve | 14 | 2.93% |
| 5.10.0-2-amd64 | 12 | 2.51% |
| 6.1.0-7-amd64 | 10 | 2.09% |
| 6.1.0-4-amd64 | 9 | 1.88% |
| 5.15.83-1-pve | 8 | 1.67% |
| 6.1.0-3-amd64 | 6 | 1.26% |
| 6.0.0-6mx-amd64 | 6 | 1.26% |
| 5.10.0-21-686-pae | 6 | 1.26% |
| 5.15.84-v8+ | 5 | 1.05% |
| 5.15.74-1-pve | 4 | 0.84% |
| 5.15.102-1-pve | 4 | 0.84% |
| 5.10.0-15-amd64 | 4 | 0.84% |
| 6.1.15-1-pve | 3 | 0.63% |
| 5.19.0-0.deb11.2-amd64 | 3 | 0.63% |
| 5.16.0-0.bpo.4-amd64 | 3 | 0.63% |
| 5.13.19-6-pve | 3 | 0.63% |
| 5.10.0-21-686 | 3 | 0.63% |
| 5.10.0-18-amd64 | 3 | 0.63% |
| 6.1.19-v8+ | 2 | 0.42% |
| 6.0.0-6-amd64 | 2 | 0.42% |
| 5.15.94-starfive2 | 2 | 0.42% |
| 5.15.79+truenas | 2 | 0.42% |
| 5.15.60-1-pve | 2 | 0.42% |
| 5.11.22-5-pve | 2 | 0.42% |
| 4.19.0-23-amd64 | 2 | 0.42% |
| 6.3.0-rc1-recompv5 | 1 | 0.21% |
| 6.2.8-x64v3-xanmod1 | 1 | 0.21% |
| 6.2.8 | 1 | 0.21% |
| 6.2.7-v8+ | 1 | 0.21% |
| 6.2.7-amd64 | 1 | 0.21% |
| 6.2.6-1-pve | 1 | 0.21% |
| 6.2.6-1-liquorix-amd64 | 1 | 0.21% |
| 6.2.2-jason | 1 | 0.21% |
| 6.2.1 | 1 | 0.21% |
| 6.1.3 | 1 | 0.21% |
Kernel Family
Linux kernel without a distro release


| Version | Computers | Percent |
|---|---|---|
| 5.10.0 | 258 | 53.97% |
| 6.1.0 | 91 | 19.04% |
| 6.0.0 | 34 | 7.11% |
| 5.15.85 | 14 | 2.93% |
| 5.15.83 | 8 | 1.67% |
| 4.19.0 | 6 | 1.26% |
| 5.15.84 | 5 | 1.05% |
| 5.15.74 | 4 | 0.84% |
| 5.15.102 | 4 | 0.84% |
| 5.13.19 | 4 | 0.84% |
| 6.1.19 | 3 | 0.63% |
| 6.1.15 | 3 | 0.63% |
| 5.19.0 | 3 | 0.63% |
| 5.16.0 | 3 | 0.63% |
| 5.15.60 | 3 | 0.63% |
| 6.2.8 | 2 | 0.42% |
| 6.2.7 | 2 | 0.42% |
| 6.2.6 | 2 | 0.42% |
| 6.1.11 | 2 | 0.42% |
| 5.15.94 | 2 | 0.42% |
| 5.15.79 | 2 | 0.42% |
| 5.11.22 | 2 | 0.42% |
| 6.3.0 | 1 | 0.21% |
| 6.2.2 | 1 | 0.21% |
| 6.2.1 | 1 | 0.21% |
| 6.1.3 | 1 | 0.21% |
| 6.1.14 | 1 | 0.21% |
| 6.1.12 | 1 | 0.21% |
| 6.1.10 | 1 | 0.21% |
| 6.0.19 | 1 | 0.21% |
| 5.4.203 | 1 | 0.21% |
| 5.3.5 | 1 | 0.21% |
| 5.2.5 | 1 | 0.21% |
| 5.19.17 | 1 | 0.21% |
| 5.16.2 | 1 | 0.21% |
| 5.16.17 | 1 | 0.21% |
| 5.15.96 | 1 | 0.21% |
| 5.15.95 | 1 | 0.21% |
| 5.15.30 | 1 | 0.21% |
| 5.10.103 | 1 | 0.21% |
Kernel Major Ver.
Linux kernel major version


| Version | Computers | Percent |
|---|---|---|
| 5.10 | 260 | 54.39% |
| 6.1 | 103 | 21.55% |
| 5.15 | 45 | 9.41% |
| 6.0 | 35 | 7.32% |
| 6.2 | 8 | 1.67% |
| 4.19 | 7 | 1.46% |
| 5.16 | 5 | 1.05% |
| 5.19 | 4 | 0.84% |
| 5.13 | 4 | 0.84% |
| 5.11 | 2 | 0.42% |
| 6.3 | 1 | 0.21% |
| 5.4 | 1 | 0.21% |
| 5.3 | 1 | 0.21% |
| 5.2 | 1 | 0.21% |
| 4.4 | 1 | 0.21% |
Arch
OS architecture (x86_64, i586, etc.)


| Name | Computers | Percent |
|---|---|---|
| x86_64 | 445 | 93.1% |
| aarch64 | 17 | 3.56% |
| i686 | 12 | 2.51% |
| riscv64 | 2 | 0.42% |
| ppc64 | 1 | 0.21% |
| armv7l | 1 | 0.21% |
DE
Desktop Environment


| Name | Computers | Percent |
|---|---|---|
| Unknown | 166 | 34.73% |
| GNOME | 113 | 23.64% |
| KDE5 | 62 | 12.97% |
| XFCE | 42 | 8.79% |
| X-Cinnamon | 19 | 3.97% |
| LXDE | 17 | 3.56% |
| Cinnamon | 16 | 3.35% |
| MATE | 12 | 2.51% |
| Openbox | 7 | 1.46% |
| i3 | 7 | 1.46% |
| LXQt | 4 | 0.84% |
| GNOME Flashback | 4 | 0.84% |
| Trinity | 2 | 0.42% |
| x-session-manager | 1 | 0.21% |
| sway | 1 | 0.21% |
| KDE | 1 | 0.21% |
| GNOME Classic | 1 | 0.21% |
| Enlightenment | 1 | 0.21% |
| Budgie | 1 | 0.21% |
| awesome | 1 | 0.21% |
Display Server
X11 or Wayland


| Name | Computers | Percent |
|---|---|---|
| X11 | 223 | 46.65% |
| Unknown | 90 | 18.83% |
| Tty | 87 | 18.2% |
| Wayland | 78 | 16.32% |
Display Manager
SDDM, LightDM, etc.


| Name | Computers | Percent |
|---|---|---|
| Unknown | 207 | 43.31% |
| LightDM | 111 | 23.22% |
| GDM | 61 | 12.76% |
| SDDM | 49 | 10.25% |
| GDM3 | 37 | 7.74% |
| NODM | 3 | 0.63% |
| XDM | 2 | 0.42% |
| SLiM | 2 | 0.42% |
| GREETD | 2 | 0.42% |
| TDM | 1 | 0.21% |
| Ly | 1 | 0.21% |
| LXDM | 1 | 0.21% |
| KDM | 1 | 0.21% |
OS Lang
Language


| Lang | Computers | Percent |
|---|---|---|
| en_US | 171 | 35.77% |
| Unknown | 57 | 11.92% |
| de_DE | 54 | 11.3% |
| ru_RU | 39 | 8.16% |
| en_GB | 26 | 5.44% |
| fr_FR | 24 | 5.02% |
| es_ES | 17 | 3.56% |
| it_IT | 14 | 2.93% |
| C | 11 | 2.3% |
| pl_PL | 9 | 1.88% |
| pt_BR | 7 | 1.46% |
| en_CA | 5 | 1.05% |
| en_AU | 5 | 1.05% |
| es_AR | 4 | 0.84% |
| fi_FI | 3 | 0.63% |
| zh_TW | 2 | 0.42% |
| nl_BE | 2 | 0.42% |
| es_MX | 2 | 0.42% |
| es_CL | 2 | 0.42% |
| en_NZ | 2 | 0.42% |
| en_IE | 2 | 0.42% |
| de_CH | 2 | 0.42% |
| de_AT | 2 | 0.42% |
| zh_CN | 1 | 0.21% |
| uk_UA | 1 | 0.21% |
| tr_TR | 1 | 0.21% |
| sv_SE | 1 | 0.21% |
| oc_FR | 1 | 0.21% |
| nl_NL | 1 | 0.21% |
| ja_JP | 1 | 0.21% |
| it_IT@euro | 1 | 0.21% |
| fr_BE | 1 | 0.21% |
| es_VE | 1 | 0.21% |
| es_UY | 1 | 0.21% |
| es_CO | 1 | 0.21% |
| en_SG | 1 | 0.21% |
| en_IL | 1 | 0.21% |
| cs_CZ | 1 | 0.21% |
| be_BY | 1 | 0.21% |
Boot Mode
EFI or BIOS


| Mode | Computers | Percent |
|---|---|---|
| EFI | 317 | 66.32% |
| BIOS | 161 | 33.68% |
Filesystem
Type of filesystem


| Type | Computers | Percent |
|---|---|---|
| Ext4 | 341 | 71.34% |
| Overlay | 90 | 18.83% |
| Zfs | 19 | 3.97% |
| Btrfs | 13 | 2.72% |
| Xfs | 9 | 1.88% |
| Rootfs | 3 | 0.63% |
| Ext3 | 2 | 0.42% |
| Tmpfs | 1 | 0.21% |
Part. scheme
Scheme of partitioning


| Type | Computers | Percent |
|---|---|---|
| GPT | 338 | 70.71% |
| MBR | 95 | 19.87% |
| Unknown | 45 | 9.41% |
Dual Boot with Linux/BSD
Hosting more than one Linux/BSD


| Dual boot | Computers | Percent |
|---|---|---|
| No | 408 | 85.36% |
| Yes | 70 | 14.64% |
Dual Boot (Win)
Hosting Linux and Windows


| Dual boot | Computers | Percent |
|---|---|---|
| No | 354 | 74.06% |
| Yes | 124 | 25.94% |
Board
Vendor
Motherboard manufacturer


| Name | Computers | Percent |
|---|---|---|
| Hewlett-Packard | 65 | 13.6% |
| Lenovo | 57 | 11.92% |
| ASUSTek Computer | 54 | 11.3% |
| Apple | 52 | 10.88% |
| Dell | 50 | 10.46% |
| Gigabyte Technology | 25 | 5.23% |
| Acer | 20 | 4.18% |
| MSI | 19 | 3.97% |
| ASRock | 16 | 3.35% |
| Unknown | 14 | 2.93% |
| Supermicro | 11 | 2.3% |
| Raspberry Pi Foundation | 10 | 2.09% |
| Intel | 9 | 1.88% |
| Fujitsu | 8 | 1.67% |
| AZW | 7 | 1.46% |
| ASRockRack | 6 | 1.26% |
| Samsung Electronics | 4 | 0.84% |
| TUXEDO | 3 | 0.63% |
| Toshiba | 3 | 0.63% |
| Techvision | 3 | 0.63% |
| Medion | 3 | 0.63% |
| ECS | 3 | 0.63% |
| Microsoft | 2 | 0.42% |
| HUAWEI | 2 | 0.42% |
| 2 | 0.42% | |
| ZOTAC | 1 | 0.21% |
| Win element | 1 | 0.21% |
| THUNDEROBOT | 1 | 0.21% |
| System76 | 1 | 0.21% |
| sunxi | 1 | 0.21% |
| Sony | 1 | 0.21% |
| Schenker | 1 | 0.21% |
| SANTECH | 1 | 0.21% |
| Pine Microsystems | 1 | 0.21% |
| Pegatron | 1 | 0.21% |
| PC Specialist | 1 | 0.21% |
| Packard Bell | 1 | 0.21% |
| OEGStone | 1 | 0.21% |
| Notebook | 1 | 0.21% |
| MicroByte | 1 | 0.21% |
Model
Motherboard model


| Name | Computers | Percent |
|---|---|---|
| Apple MacBook5,2 | 47 | 9.83% |
| Unknown | 14 | 2.93% |
| Techvision TVI7309X | 3 | 0.63% |
| Supermicro X11DPi-N(T) | 3 | 0.63% |
| Lenovo ThinkPad 13 2nd Gen 20J10046US | 3 | 0.63% |
| AZW U59 | 3 | 0.63% |
| AZW MINI S | 3 | 0.63% |
| Supermicro X9DR3-F | 2 | 0.42% |
| Supermicro egino BTO Konfig Server | 2 | 0.42% |
| RPi Raspberry Pi Compute Module 4 Rev 1.1 | 2 | 0.42% |
| RPi Raspberry Pi 4 Model B Rev 1.4 | 2 | 0.42% |
| MSI MS-7C91 | 2 | 0.42% |
| MSI MS-7C02 | 2 | 0.42% |
| Lenovo ThinkPad L13 Yoga Gen 2 20VK0019US | 2 | 0.42% |
| Lenovo IdeaPad 5 15ARE05 81YQ | 2 | 0.42% |
| HP ProLiant DL380p Gen8 | 2 | 0.42% |
| HP ProDesk 600 G6 Desktop Mini PC | 2 | 0.42% |
| HP EliteDesk 800 G1 DM | 2 | 0.42% |
| HP EliteBook 840 G6 | 2 | 0.42% |
| HP EliteBook 840 G3 | 2 | 0.42% |
| HP EliteBook 830 G5 | 2 | 0.42% |
| HP Compaq 8200 Elite SFF PC | 2 | 0.42% |
| Gigabyte H97M-HD3 | 2 | 0.42% |
| ECS G31T-M9 | 2 | 0.42% |
| Dell Precision 5570 | 2 | 0.42% |
| Dell OptiPlex 790 | 2 | 0.42% |
| Dell Latitude E6440 | 2 | 0.42% |
| Dell Latitude E6330 | 2 | 0.42% |
| Dell Latitude 3510 | 2 | 0.42% |
| Dell Latitude 3320 | 2 | 0.42% |
| ASUS Zenbook UX535QE_UM535QE | 2 | 0.42% |
| ASUS Pro WS WRX80E-SAGE SE WIFI | 2 | 0.42% |
| ASRockRack B450D4U-V1L | 2 | 0.42% |
| Acer Nitro AN515-43 | 2 | 0.42% |
| ZOTAC ZBOX-CI331NANO | 1 | 0.21% |
| Win element M600 | 1 | 0.21% |
| TUXEDO N13xWU | 1 | 0.21% |
| TUXEDO InfinityBook Pro 14 v4 | 1 | 0.21% |
| TUXEDO Aura 15 Gen2 | 1 | 0.21% |
| Toshiba Satellite C655 | 1 | 0.21% |
Model Family
Motherboard model prefix


| Name | Computers | Percent |
|---|---|---|
| Apple MacBook5 | 47 | 9.83% |
| Lenovo ThinkPad | 28 | 5.86% |
| Dell Latitude | 15 | 3.14% |
| Unknown | 14 | 2.93% |
| Acer Aspire | 13 | 2.72% |
| RPi Raspberry | 10 | 2.09% |
| HP EliteBook | 10 | 2.09% |
| ASUS PRIME | 9 | 1.88% |
| HP Pavilion | 7 | 1.46% |
| Dell Precision | 7 | 1.46% |
| Lenovo ThinkCentre | 6 | 1.26% |
| Lenovo IdeaPad | 6 | 1.26% |
| HP ProDesk | 6 | 1.26% |
| HP Compaq | 6 | 1.26% |
| Dell Inspiron | 6 | 1.26% |
| HP ProLiant | 5 | 1.05% |
| Dell PowerEdge | 5 | 1.05% |
| Dell OptiPlex | 5 | 1.05% |
| ASUS Zenbook | 5 | 1.05% |
| ASUS VivoBook | 5 | 1.05% |
| ASUS ROG | 5 | 1.05% |
| HP ZBook | 4 | 0.84% |
| HP Laptop | 4 | 0.84% |
| HP ENVY | 4 | 0.84% |
| Fujitsu LIFEBOOK | 4 | 0.84% |
| Dell XPS | 4 | 0.84% |
| Toshiba Satellite | 3 | 0.63% |
| Techvision TVI7309X | 3 | 0.63% |
| Supermicro X11DPi-N(T) | 3 | 0.63% |
| Lenovo Yoga | 3 | 0.63% |
| HP ProBook | 3 | 0.63% |
| HP EliteDesk | 3 | 0.63% |
| Gigabyte B550 | 3 | 0.63% |
| Fujitsu ESPRIMO | 3 | 0.63% |
| Dell Vostro | 3 | 0.63% |
| AZW U59 | 3 | 0.63% |
| AZW MINI | 3 | 0.63% |
| ASUS Pro | 3 | 0.63% |
| Acer Nitro | 3 | 0.63% |
| Supermicro X9DR3-F | 2 | 0.42% |
MFG Year
Motherboard manufacture year


| Year | Computers | Percent |
|---|---|---|
| 2022 | 61 | 12.76% |
| 2009 | 57 | 11.92% |
| 2020 | 47 | 9.83% |
| 2021 | 41 | 8.58% |
| 2019 | 37 | 7.74% |
| 2018 | 33 | 6.9% |
| 2012 | 26 | 5.44% |
| 2014 | 22 | 4.6% |
| 2011 | 22 | 4.6% |
| Unknown | 20 | 4.18% |
| 2017 | 19 | 3.97% |
| 2013 | 19 | 3.97% |
| 2016 | 18 | 3.77% |
| 2015 | 15 | 3.14% |
| 2010 | 15 | 3.14% |
| 2007 | 9 | 1.88% |
| 2023 | 6 | 1.26% |
| 2008 | 6 | 1.26% |
| 2006 | 5 | 1.05% |
Form Factor
Physical design of the computer


| Name | Computers | Percent |
|---|---|---|
| Notebook | 241 | 50.42% |
| Desktop | 170 | 35.56% |
| System on chip | 18 | 3.77% |
| Server | 18 | 3.77% |
| Convertible | 12 | 2.51% |
| Mini pc | 12 | 2.51% |
| Tablet | 4 | 0.84% |
| All in one | 2 | 0.42% |
| Phone | 1 | 0.21% |
Secure Boot
Enabled or disabled


| State | Computers | Percent |
|---|---|---|
| Disabled | 452 | 94.56% |
| Enabled | 26 | 5.44% |
Coreboot
Have coreboot on board


| Used | Computers | Percent |
|---|---|---|
| No | 474 | 99.16% |
| Yes | 4 | 0.84% |
RAM Size
Total RAM memory


| Size in GB | Computers | Percent |
|---|---|---|
| 3.01-4.0 | 101 | 21.13% |
| 16.01-24.0 | 99 | 20.71% |
| 4.01-8.0 | 87 | 18.2% |
| 8.01-16.0 | 57 | 11.92% |
| 32.01-64.0 | 43 | 9% |
| 64.01-256.0 | 43 | 9% |
| 1.01-2.0 | 22 | 4.6% |
| 24.01-32.0 | 8 | 1.67% |
| 0.51-1.0 | 7 | 1.46% |
| 2.01-3.0 | 6 | 1.26% |
| More than 256.0 | 4 | 0.84% |
| 0.01-0.5 | 1 | 0.21% |
RAM Used
Used RAM memory


| Used GB | Computers | Percent |
|---|---|---|
| 1.01-2.0 | 141 | 29.5% |
| 2.01-3.0 | 85 | 17.78% |
| 4.01-8.0 | 79 | 16.53% |
| 0.51-1.0 | 48 | 10.04% |
| 3.01-4.0 | 40 | 8.37% |
| 0.01-0.5 | 32 | 6.69% |
| 8.01-16.0 | 23 | 4.81% |
| 32.01-64.0 | 12 | 2.51% |
| 64.01-256.0 | 7 | 1.46% |
| 16.01-24.0 | 7 | 1.46% |
| 24.01-32.0 | 3 | 0.63% |
| More than 256.0 | 1 | 0.21% |
Total Drives
Number of drives on board


| Drives | Computers | Percent |
|---|---|---|
| 1 | 288 | 60.25% |
| 2 | 103 | 21.55% |
| 3 | 26 | 5.44% |
| 4 | 21 | 4.39% |
| 5 | 10 | 2.09% |
| 13 | 6 | 1.26% |
| 8 | 5 | 1.05% |
| 7 | 5 | 1.05% |
| 6 | 5 | 1.05% |
| 0 | 3 | 0.63% |
| 9 | 2 | 0.42% |
| 29 | 1 | 0.21% |
| 22 | 1 | 0.21% |
| 12 | 1 | 0.21% |
| 11 | 1 | 0.21% |
Has CD-ROM
Has CD-ROM on board


| Presented | Computers | Percent |
|---|---|---|
| No | 321 | 67.15% |
| Yes | 157 | 32.85% |
Has Ethernet
Has Ethernet on board


| Presented | Computers | Percent |
|---|---|---|
| Yes | 416 | 87.03% |
| No | 62 | 12.97% |
Has WiFi
Has WiFi module


| Presented | Computers | Percent |
|---|---|---|
| Yes | 341 | 71.34% |
| No | 137 | 28.66% |
Has Bluetooth
Has Bluetooth module


| Presented | Computers | Percent |
|---|---|---|
| Yes | 295 | 61.72% |
| No | 183 | 38.28% |
Location
Country
Geographic location (country)


| Country | Computers | Percent |
|---|---|---|
| USA | 124 | 25.94% |
| Germany | 75 | 15.69% |
| Russia | 47 | 9.83% |
| France | 30 | 6.28% |
| Italy | 22 | 4.6% |
| Spain | 21 | 4.39% |
| Poland | 14 | 2.93% |
| Canada | 13 | 2.72% |
| Brazil | 10 | 2.09% |
| UK | 9 | 1.88% |
| Netherlands | 8 | 1.67% |
| Australia | 8 | 1.67% |
| China | 7 | 1.46% |
| Austria | 7 | 1.46% |
| Switzerland | 5 | 1.05% |
| Malaysia | 5 | 1.05% |
| Mexico | 4 | 0.84% |
| Finland | 4 | 0.84% |
| Argentina | 4 | 0.84% |
| Ukraine | 3 | 0.63% |
| Turkey | 3 | 0.63% |
| Taiwan | 3 | 0.63% |
| Sweden | 3 | 0.63% |
| Norway | 3 | 0.63% |
| Belgium | 3 | 0.63% |
| Belarus | 3 | 0.63% |
| Slovakia | 2 | 0.42% |
| Romania | 2 | 0.42% |
| New Zealand | 2 | 0.42% |
| Morocco | 2 | 0.42% |
| Kazakhstan | 2 | 0.42% |
| Japan | 2 | 0.42% |
| Czechia | 2 | 0.42% |
| Colombia | 2 | 0.42% |
| Chile | 2 | 0.42% |
| Vietnam | 1 | 0.21% |
| Venezuela | 1 | 0.21% |
| Uruguay | 1 | 0.21% |
| Tunisia | 1 | 0.21% |
| Thailand | 1 | 0.21% |
City
Geographic location (city)


| City | Computers | Percent |
|---|---|---|
| Bangor | 53 | 11.09% |
| Voronezh | 22 | 4.6% |
| Vienna | 7 | 1.46% |
| Stuttgart | 7 | 1.46% |
| Paris | 5 | 1.05% |
| Madrid | 5 | 1.05% |
| Kuala Lumpur | 5 | 1.05% |
| St Petersburg | 4 | 0.84% |
| Munich | 4 | 0.84% |
| Moscow | 4 | 0.84% |
| Helsinki | 4 | 0.84% |
| Bonn | 4 | 0.84% |
| Berlin | 4 | 0.84% |
| Ufa | 3 | 0.63% |
| Sydney | 3 | 0.63% |
| London | 3 | 0.63% |
| Kirishi | 3 | 0.63% |
| Frankfurt am Main | 3 | 0.63% |
| Courtice | 3 | 0.63% |
| Bieligutai | 3 | 0.63% |
| Barcelona | 3 | 0.63% |
| Amsterdam | 3 | 0.63% |
| Zurich | 2 | 0.42% |
| Wroclaw | 2 | 0.42% |
| Vila Velha | 2 | 0.42% |
| Toronto | 2 | 0.42% |
| Taipei | 2 | 0.42% |
| Seville | 2 | 0.42% |
| Sao Paulo | 2 | 0.42% |
| San Jose | 2 | 0.42% |
| Roubaix | 2 | 0.42% |
| Rhede | 2 | 0.42% |
| Puyallup | 2 | 0.42% |
| Onalaska | 2 | 0.42% |
| Nizhniy Novgorod | 2 | 0.42% |
| Milano | 2 | 0.42% |
| Mexico City | 2 | 0.42% |
| Melbourne | 2 | 0.42% |
| Leipzig | 2 | 0.42% |
| Košice | 2 | 0.42% |
Drives
Drive Vendor
Hard drive vendors


| Vendor | Computers | Drives | Percent |
|---|---|---|---|
| Samsung Electronics | 121 | 153 | 17.26% |
| Seagate | 84 | 145 | 11.98% |
| WDC | 80 | 135 | 11.41% |
| Toshiba | 49 | 70 | 6.99% |
| SanDisk | 36 | 41 | 5.14% |
| Fujitsu | 36 | 36 | 5.14% |
| Kingston | 33 | 43 | 4.71% |
| Unknown | 32 | 36 | 4.56% |
| Intel | 26 | 42 | 3.71% |
| Hitachi | 19 | 22 | 2.71% |
| Crucial | 19 | 22 | 2.71% |
| Micron Technology | 13 | 28 | 1.85% |
| HGST | 13 | 15 | 1.85% |
| SK hynix | 12 | 12 | 1.71% |
| PNY | 11 | 21 | 1.57% |
| A-DATA Technology | 10 | 11 | 1.43% |
| Phison | 7 | 7 | 1% |
| LITEON | 6 | 6 | 0.86% |
| China | 6 | 6 | 0.86% |
| Corsair | 5 | 7 | 0.71% |
| Team | 4 | 4 | 0.57% |
| Intenso | 4 | 4 | 0.57% |
| GOODRAM | 4 | 7 | 0.57% |
| Unknown | 4 | 4 | 0.57% |
| TO Exter | 3 | 3 | 0.43% |
| SSSTC | 3 | 3 | 0.43% |
| SPCC | 3 | 3 | 0.43% |
| KIOXIA | 3 | 3 | 0.43% |
| JMicron Technology | 3 | 3 | 0.43% |
| Fanxiang | 3 | 3 | 0.43% |
| Apple | 3 | 3 | 0.43% |
| XPG | 2 | 2 | 0.29% |
| Xinhaike | 2 | 2 | 0.29% |
| Transcend | 2 | 2 | 0.29% |
| Patriot | 2 | 2 | 0.29% |
| NGFF | 2 | 2 | 0.29% |
| Netac | 2 | 2 | 0.29% |
| LITEONIT | 2 | 2 | 0.29% |
| KIOXIA-EXCERIA | 2 | 2 | 0.29% |
| INNOVATION IT | 2 | 2 | 0.29% |
Drive Model
Hard drive models


| Model | Computers | Percent |
|---|---|---|
| Fujitsu MHZ2160BH FFS G1 160GB | 35 | 4.4% |
| Samsung SSD 970 EVO Plus 1TB | 8 | 1.01% |
| Samsung SSD 850 EVO 250GB | 8 | 1.01% |
| Kingston SA400S37240G 240GB SSD | 8 | 1.01% |
| Seagate Expansion+ 2TB | 7 | 0.88% |
| Samsung SSD 980 PRO 1TB | 7 | 0.88% |
| Toshiba MK1655GSXF 160GB | 6 | 0.75% |
| Kingston SA400S37120G 120GB SSD | 6 | 0.75% |
| Toshiba MQ01ABD100 1TB | 5 | 0.63% |
| Toshiba DT01ACA100 1TB | 5 | 0.63% |
| Kingston SV300S37A120G 120GB SSD | 5 | 0.63% |
| Hitachi HTS543216L9SA02 160GB | 5 | 0.63% |
| Crucial CT1000MX500SSD1 1TB | 5 | 0.63% |
| Unknown SD32G 32GB | 4 | 0.5% |
| Unknown MMC Card 32GB | 4 | 0.5% |
| Seagate ST2000DM008-2UB102 2TB | 4 | 0.5% |
| Seagate ST1000LM035-1RK172 1TB | 4 | 0.5% |
| Seagate ST1000LM024 HN-M101MBB 1TB | 4 | 0.5% |
| SanDisk NVMe SSD Drive 500GB | 4 | 0.5% |
| Samsung SSD 980 PRO 2TB | 4 | 0.5% |
| Samsung SSD 980 1TB | 4 | 0.5% |
| Samsung SSD 850 EVO 500GB | 4 | 0.5% |
| Samsung NVMe SSD Controller SM981/PM981/PM983 250GB | 4 | 0.5% |
| PNY 1TB SATA SSD | 4 | 0.5% |
| Kingston SA400S37480G 480GB SSD | 4 | 0.5% |
| HGST HUS726060ALE610 6TB | 4 | 0.5% |
| Unknown | 4 | 0.5% |
| Toshiba MQ01ABF050 500GB | 3 | 0.38% |
| Toshiba MK2555GSXF 250GB | 3 | 0.38% |
| Toshiba DT01ACA050 500GB | 3 | 0.38% |
| TO Exter nal USB 3.0 1TB | 3 | 0.38% |
| Seagate ST500LT012-1DG142 500GB | 3 | 0.38% |
| Seagate ST2000DM008-2FR102 2TB | 3 | 0.38% |
| Seagate ST1000LM048-2E7172 1TB | 3 | 0.38% |
| Sandisk WD Blue SN550 NVMe SSD 256GB | 3 | 0.38% |
| SanDisk SDSSDH3 4T00 4TB | 3 | 0.38% |
| Samsung SSD 970 EVO Plus 500GB | 3 | 0.38% |
| Samsung SSD 860 EVO 500GB | 3 | 0.38% |
| Samsung SSD 860 EVO 250GB | 3 | 0.38% |
| Samsung PM9A1 NVMe 1024GB | 3 | 0.38% |
HDD Vendor
Hard disk drive vendors


| Vendor | Computers | Drives | Percent |
|---|---|---|---|
| Seagate | 84 | 144 | 32.06% |
| WDC | 55 | 106 | 20.99% |
| Toshiba | 41 | 55 | 15.65% |
| Fujitsu | 36 | 36 | 13.74% |
| Hitachi | 19 | 22 | 7.25% |
| HGST | 13 | 15 | 4.96% |
| Samsung Electronics | 6 | 6 | 2.29% |
| Apple | 2 | 2 | 0.76% |
| USB | 1 | 1 | 0.38% |
| Unknown | 1 | 1 | 0.38% |
| SD | 1 | 1 | 0.38% |
| SABRENT | 1 | 1 | 0.38% |
| QNAP | 1 | 2 | 0.38% |
| ASMT | 1 | 1 | 0.38% |
SSD Vendor
Solid state drive vendors


| Vendor | Computers | Drives | Percent |
|---|---|---|---|
| Samsung Electronics | 52 | 65 | 23.85% |
| Kingston | 29 | 39 | 13.3% |
| SanDisk | 20 | 22 | 9.17% |
| Crucial | 15 | 18 | 6.88% |
| Intel | 14 | 29 | 6.42% |
| WDC | 8 | 9 | 3.67% |
| PNY | 8 | 16 | 3.67% |
| China | 6 | 6 | 2.75% |
| Micron Technology | 5 | 20 | 2.29% |
| LITEON | 5 | 5 | 2.29% |
| A-DATA Technology | 5 | 5 | 2.29% |
| Team | 4 | 4 | 1.83% |
| Intenso | 4 | 4 | 1.83% |
| Toshiba | 3 | 5 | 1.38% |
| TO Exter | 3 | 3 | 1.38% |
| GOODRAM | 3 | 3 | 1.38% |
| Xinhaike | 2 | 2 | 0.92% |
| Transcend | 2 | 2 | 0.92% |
| SPCC | 2 | 2 | 0.92% |
| SK hynix | 2 | 2 | 0.92% |
| Phison | 2 | 2 | 0.92% |
| NGFF | 2 | 2 | 0.92% |
| Netac | 2 | 2 | 0.92% |
| LITEONIT | 2 | 2 | 0.92% |
| JMicron Technology | 2 | 2 | 0.92% |
| INNOVATION IT | 2 | 2 | 0.92% |
| WDC WDS | 1 | 1 | 0.46% |
| sk600 | 1 | 1 | 0.46% |
| ShiJi | 1 | 1 | 0.46% |
| Patriot | 1 | 1 | 0.46% |
| Maxtor | 1 | 1 | 0.46% |
| Kimtigo | 1 | 1 | 0.46% |
| iODD | 1 | 1 | 0.46% |
| Hewlett-Packard | 1 | 1 | 0.46% |
| Gigabyte Technology | 1 | 1 | 0.46% |
| Corsair | 1 | 1 | 0.46% |
| Colorful | 1 | 1 | 0.46% |
| CIS | 1 | 1 | 0.46% |
| Apple | 1 | 1 | 0.46% |
| ADATA SU | 1 | 1 | 0.46% |
Drive Kind
HDD or SSD


| Kind | Computers | Drives | Percent |
|---|---|---|---|
| HDD | 222 | 393 | 35.46% |
| SSD | 183 | 287 | 29.23% |
| NVMe | 178 | 219 | 28.43% |
| MMC | 36 | 40 | 5.75% |
| Unknown | 7 | 7 | 1.12% |
Drive Connector
SATA, SAS, NVMe, etc.


| Type | Computers | Drives | Percent |
|---|---|---|---|
| SATA | 328 | 644 | 57.04% |
| NVMe | 178 | 219 | 30.96% |
| MMC | 36 | 40 | 6.26% |
| SAS | 33 | 43 | 5.74% |
Drive Size
Size of hard drive


| Size in TB | Computers | Drives | Percent |
|---|---|---|---|
| 0.01-0.5 | 252 | 313 | 55.88% |
| 0.51-1.0 | 103 | 141 | 22.84% |
| 1.01-2.0 | 43 | 80 | 9.53% |
| 4.01-10.0 | 24 | 63 | 5.32% |
| 3.01-4.0 | 15 | 28 | 3.33% |
| 2.01-3.0 | 7 | 23 | 1.55% |
| 10.01-20.0 | 7 | 32 | 1.55% |
Space Total
Amount of disk space available on the file system


| Size in GB | Computers | Percent |
|---|---|---|
| 101-250 | 100 | 20.92% |
| Unknown | 92 | 19.25% |
| 251-500 | 75 | 15.69% |
| 501-1000 | 54 | 11.3% |
| 1001-2000 | 41 | 8.58% |
| 51-100 | 29 | 6.07% |
| More than 3000 | 28 | 5.86% |
| 21-50 | 28 | 5.86% |
| 1-20 | 20 | 4.18% |
| 2001-3000 | 11 | 2.3% |
Space Used
Amount of used disk space


| Used GB | Computers | Percent |
|---|---|---|
| 1-20 | 161 | 33.68% |
| Unknown | 92 | 19.25% |
| 101-250 | 53 | 11.09% |
| 21-50 | 45 | 9.41% |
| 51-100 | 38 | 7.95% |
| 501-1000 | 29 | 6.07% |
| 251-500 | 28 | 5.86% |
| More than 3000 | 15 | 3.14% |
| 1001-2000 | 12 | 2.51% |
| 2001-3000 | 4 | 0.84% |
| 0 | 1 | 0.21% |
Malfunc. Drives
Drive models with a malfunction


| Model | Computers | Drives | Percent |
|---|---|---|---|
| Hitachi HTS543216L9SA02 160GB | 5 | 5 | 6.49% |
| Fujitsu MHZ2160BH FFS G1 160GB | 5 | 5 | 6.49% |
| Toshiba MQ01ABD100 1TB | 3 | 3 | 3.9% |
| Toshiba MK2555GSXF 250GB | 3 | 3 | 3.9% |
| WDC WD20EARX-00PASB0 2TB | 2 | 2 | 2.6% |
| Kingston SV300S37A120G 120GB SSD | 2 | 2 | 2.6% |
| WDC WD5001AALS-00L3B2 500GB | 1 | 1 | 1.3% |
| WDC WD5000AAKX-60U6AA0 500GB | 1 | 1 | 1.3% |
| WDC WD4001FFSX-68JNUN0 4TB | 1 | 1 | 1.3% |
| WDC WD3200BPVT-22JJ5T0 320GB | 1 | 1 | 1.3% |
| WDC WD3200AAJS-00L7A0 320GB | 1 | 1 | 1.3% |
| WDC WD2500AAJS-00B4A0 250GB | 1 | 1 | 1.3% |
| WDC WD10SPZX-60Z10T0 1TB | 1 | 1 | 1.3% |
| WDC WD10EADS-00P8B0 1TB | 1 | 1 | 1.3% |
| WDC WD1000DHTZ-04N21V0 1TB | 1 | 1 | 1.3% |
| Transcend TS32GMTS400 32GB SSD | 1 | 1 | 1.3% |
| Toshiba MQ02ABD100H 1TB | 1 | 1 | 1.3% |
| Toshiba MQ01ABD050 500GB | 1 | 1 | 1.3% |
| Toshiba MK2035GSS 200GB | 1 | 1 | 1.3% |
| Toshiba MK1655GSXF 160GB | 1 | 1 | 1.3% |
| Toshiba DT01ACA100 1TB | 1 | 1 | 1.3% |
| Toshiba DT01ACA050 500GB | 1 | 1 | 1.3% |
| SK hynix BC711 HFM512GD3JX013N 512GB | 1 | 1 | 1.3% |
| Seagate ST9320423AS 320GB | 1 | 1 | 1.3% |
| Seagate ST9320421AS 320GB | 1 | 1 | 1.3% |
| Seagate ST9250827AS 250GB | 1 | 1 | 1.3% |
| Seagate ST500LM021-1KJ152 500GB | 1 | 1 | 1.3% |
| Seagate ST500LM012 HN-M500MBB 500GB | 1 | 1 | 1.3% |
| Seagate ST500DM002-1BD142 500GB | 1 | 4 | 1.3% |
| Seagate ST3320820SCE 320GB | 1 | 1 | 1.3% |
| Seagate ST3320613AS 320GB | 1 | 1 | 1.3% |
| Seagate ST3250824AS 250GB | 1 | 1 | 1.3% |
| Seagate ST3250410AS 250GB | 1 | 1 | 1.3% |
| Seagate ST320LT007-9ZV142 320GB | 1 | 1 | 1.3% |
| Seagate ST2000DM006-2DM164 2TB | 1 | 1 | 1.3% |
| Seagate ST14000NM001G-2KJ103 14TB | 1 | 5 | 1.3% |
| Seagate ST1000VM002-1CT162 1TB | 1 | 3 | 1.3% |
| Seagate ST1000LM049-2GH172 1TB | 1 | 1 | 1.3% |
| Seagate ST1000LM048-2E7172 1TB | 1 | 1 | 1.3% |
| Seagate ST1000LM035-1RK172 1TB | 1 | 1 | 1.3% |
Malfunc. Drive Vendor
Vendors of faulty drives


| Vendor | Computers | Drives | Percent |
|---|---|---|---|
| Seagate | 16 | 27 | 21.92% |
| Toshiba | 12 | 12 | 16.44% |
| WDC | 11 | 11 | 15.07% |
| Hitachi | 8 | 8 | 10.96% |
| Kingston | 5 | 5 | 6.85% |
| Fujitsu | 5 | 5 | 6.85% |
| SanDisk | 4 | 4 | 5.48% |
| Samsung Electronics | 3 | 3 | 4.11% |
| Intel | 3 | 3 | 4.11% |
| Crucial | 2 | 3 | 2.74% |
| Transcend | 1 | 1 | 1.37% |
| SK hynix | 1 | 1 | 1.37% |
| PNY | 1 | 3 | 1.37% |
| Micron Technology | 1 | 6 | 1.37% |
Malfunc. HDD Vendor
Vendors of faulty HDD drives


| Vendor | Computers | Drives | Percent |
|---|---|---|---|
| Seagate | 16 | 27 | 29.63% |
| Toshiba | 12 | 12 | 22.22% |
| WDC | 11 | 11 | 20.37% |
| Hitachi | 8 | 8 | 14.81% |
| Fujitsu | 5 | 5 | 9.26% |
| Samsung Electronics | 2 | 2 | 3.7% |
Malfunc. Drive Kind
Kinds of faulty drives


| Kind | Computers | Drives | Percent |
|---|---|---|---|
| HDD | 52 | 65 | 73.24% |
| SSD | 17 | 25 | 23.94% |
| NVMe | 2 | 2 | 2.82% |
Failed Drives
Failed drive models


| Model | Computers | Drives | Percent |
|---|---|---|---|
| Samsung Electronics SSD 980 250GB | 1 | 1 | 100% |
Failed Drive Vendor
Failed drive vendors


| Vendor | Computers | Drives | Percent |
|---|---|---|---|
| Samsung Electronics | 1 | 1 | 100% |
Drive Status
Number of failed and malfunc. drives


| Status | Computers | Drives | Percent |
|---|---|---|---|
| Works | 357 | 667 | 66.11% |
| Detected | 114 | 186 | 21.11% |
| Malfunc | 68 | 92 | 12.59% |
| Failed | 1 | 1 | 0.19% |
Storage controller
Storage Vendor
Storage controller vendors


| Vendor | Computers | Percent |
|---|---|---|
| Intel | 263 | 41.95% |
| AMD | 83 | 13.24% |
| Samsung Electronics | 70 | 11.16% |
| Nvidia | 52 | 8.29% |
| SanDisk | 33 | 5.26% |
| Phison Electronics | 15 | 2.39% |
| Broadcom / LSI | 12 | 1.91% |
| ASMedia Technology | 10 | 1.59% |
| SK hynix | 9 | 1.44% |
| Micron Technology | 8 | 1.28% |
| Marvell Technology Group | 7 | 1.12% |
| LSI Logic / Symbios Logic | 7 | 1.12% |
| ADATA Technology | 7 | 1.12% |
| Toshiba America Info Systems | 6 | 0.96% |
| KIOXIA | 5 | 0.8% |
| Micron/Crucial Technology | 4 | 0.64% |
| Kingston Technology Company | 4 | 0.64% |
| JMicron Technology | 4 | 0.64% |
| Hewlett-Packard | 4 | 0.64% |
| VIA Technologies | 3 | 0.48% |
| Solid State Storage Technology | 3 | 0.48% |
| Silicon Motion | 3 | 0.48% |
| MAXIO Technology (Hangzhou) | 3 | 0.48% |
| Adaptec | 3 | 0.48% |
| Lite-On Technology | 2 | 0.32% |
| INNOGRIT | 2 | 0.32% |
| Yangtze Memory Technologies | 1 | 0.16% |
| Silicon Image | 1 | 0.16% |
| Realtek Semiconductor | 1 | 0.16% |
| IBM | 1 | 0.16% |
| Biwin Storage Technology | 1 | 0.16% |
Storage Model
Storage controller models


| Model | Computers | Percent |
|---|---|---|
| AMD FCH SATA Controller [AHCI mode] | 59 | 8.21% |
| Nvidia MCP79 AHCI Controller | 49 | 6.82% |
| Samsung NVMe SSD Controller SM981/PM981/PM983 | 30 | 4.17% |
| Samsung NVMe SSD Controller PM9A1/PM9A3/980PRO | 23 | 3.2% |
| Intel Sunrise Point-LP SATA Controller [AHCI mode] | 20 | 2.78% |
| Intel 8 Series/C220 Series Chipset Family 6-port SATA Controller 1 [AHCI mode] | 19 | 2.64% |
| AMD 400 Series Chipset SATA Controller | 17 | 2.36% |
| Intel 82801 Mobile SATA Controller [RAID mode] | 16 | 2.23% |
| Intel 82801G (ICH7 Family) IDE Controller | 14 | 1.95% |
| Samsung NVMe SSD Controller 980 | 13 | 1.81% |
| Intel Jasper Lake SATA AHCI Controller | 13 | 1.81% |
| Intel Volume Management Device NVMe RAID Controller | 11 | 1.53% |
| Intel NM10/ICH7 Family SATA Controller [IDE mode] | 11 | 1.53% |
| Intel 7 Series Chipset Family 6-port SATA Controller [AHCI mode] | 10 | 1.39% |
| Intel Comet Lake SATA AHCI Controller | 9 | 1.25% |
| Intel Alder Lake-S PCH SATA Controller [AHCI Mode] | 9 | 1.25% |
| Intel 6 Series/C200 Series Chipset Family 6 port Mobile SATA AHCI Controller | 9 | 1.25% |
| Intel 200 Series PCH SATA controller [AHCI mode] | 9 | 1.25% |
| ASMedia ASM1062 Serial ATA Controller | 9 | 1.25% |
| SanDisk WD Blue SN550 NVMe SSD | 8 | 1.11% |
| Phison E12 NVMe Controller | 8 | 1.11% |
| Micron NVMe Storage Controller | 8 | 1.11% |
| AMD SB7x0/SB8x0/SB9x0 IDE Controller | 8 | 1.11% |
| AMD 500 Series Chipset SATA Controller | 8 | 1.11% |
| Intel Q170/Q150/B150/H170/H110/Z170/CM236 Chipset SATA Controller [AHCI Mode] | 7 | 0.97% |
| Intel C600/X79 series chipset 6-Port SATA AHCI Controller | 7 | 0.97% |
| Intel 6 Series/C200 Series Chipset Family 6 port Desktop SATA AHCI Controller | 7 | 0.97% |
| SK hynix Gold P31/PC711 NVMe Solid State Drive | 6 | 0.83% |
| SanDisk WD Black SN750 / PC SN730 NVMe SSD | 6 | 0.83% |
| Intel Cannon Lake PCH SATA AHCI Controller | 6 | 0.83% |
| Intel C610/X99 series chipset 6-Port SATA Controller [AHCI mode] | 6 | 0.83% |
| Intel 8 Series SATA Controller 1 [AHCI mode] | 6 | 0.83% |
| AMD SB7x0/SB8x0/SB9x0 SATA Controller [AHCI mode] | 6 | 0.83% |
| SanDisk Non-Volatile memory controller | 5 | 0.7% |
| Intel SSD 660P Series | 5 | 0.7% |
| Intel SSD 600P Series | 5 | 0.7% |
| Intel Celeron/Pentium Silver Processor SATA Controller | 5 | 0.7% |
| Intel C620 Series Chipset Family SSATA Controller [AHCI mode] | 5 | 0.7% |
| Intel C620 Series Chipset Family SATA Controller [AHCI mode] | 5 | 0.7% |
| Intel C610/X99 series chipset sSATA Controller [AHCI mode] | 5 | 0.7% |
Storage Kind
Kind of storage controller (IDE, SATA, NVMe, SAS, ...)


| Kind | Computers | Percent |
|---|---|---|
| SATA | 346 | 54.49% |
| NVMe | 177 | 27.87% |
| IDE | 53 | 8.35% |
| RAID | 43 | 6.77% |
| SAS | 16 | 2.52% |
Processor
CPU Vendor
Processor vendors


| Vendor | Computers | Percent |
|---|---|---|
| Intel | 362 | 75.73% |
| AMD | 95 | 19.87% |
| ARM | 17 | 3.56% |
| sifive,u74-mc | 2 | 0.42% |
| CHRP IBM,8233-E8B | 1 | 0.21% |
| Unknown | 1 | 0.21% |
CPU Model
Processor models


| Model | Computers | Percent |
|---|---|---|
| Intel Core 2 Duo CPU P7450 @ 2.13GHz | 49 | 10.25% |
| ARM Processor | 16 | 3.35% |
| Intel Celeron N5105 @ 2.00GHz | 9 | 1.88% |
| Intel Core i5-10210U CPU @ 1.60GHz | 7 | 1.46% |
| Intel 11th Gen Core i7-1165G7 @ 2.80GHz | 7 | 1.46% |
| Intel Core i5-8250U CPU @ 1.60GHz | 5 | 1.05% |
| Intel Core i7-8750H CPU @ 2.20GHz | 4 | 0.84% |
| Intel Core i7-6500U CPU @ 2.50GHz | 4 | 0.84% |
| Intel Core i7-4710MQ CPU @ 2.50GHz | 4 | 0.84% |
| Intel 12th Gen Core i7-12700H | 4 | 0.84% |
| AMD Ryzen 9 5950X 16-Core Processor | 4 | 0.84% |
| AMD Ryzen 7 5700U with Radeon Graphics | 4 | 0.84% |
| AMD Ryzen 7 3700X 8-Core Processor | 4 | 0.84% |
| Intel Xeon Gold 6128 CPU @ 3.40GHz | 3 | 0.63% |
| Intel Xeon CPU E3-1230 V2 @ 3.30GHz | 3 | 0.63% |
| Intel Core i7-8550U CPU @ 1.80GHz | 3 | 0.63% |
| Intel Core i7-6820HQ CPU @ 2.70GHz | 3 | 0.63% |
| Intel Core i7-10510U CPU @ 1.80GHz | 3 | 0.63% |
| Intel Core i5-4300M CPU @ 2.60GHz | 3 | 0.63% |
| Intel Core i5-3320M CPU @ 2.60GHz | 3 | 0.63% |
| Intel Core i5-1035G1 CPU @ 1.00GHz | 3 | 0.63% |
| Intel Core i3-1005G1 CPU @ 1.20GHz | 3 | 0.63% |
| Intel Core 2 Duo CPU E7400 @ 2.80GHz | 3 | 0.63% |
| Intel Celeron CPU 3865U @ 1.80GHz | 3 | 0.63% |
| Intel 12th Gen Core i7-1255U | 3 | 0.63% |
| Intel 12th Gen Core i5-12500 | 3 | 0.63% |
| Intel 12th Gen Core i5-1235U | 3 | 0.63% |
| Intel 11th Gen Core i7-1185G7 @ 3.00GHz | 3 | 0.63% |
| Intel 11th Gen Core i5-1135G7 @ 2.40GHz | 3 | 0.63% |
| AMD Ryzen 5 5600X 6-Core Processor | 3 | 0.63% |
| AMD Ryzen 5 5500U with Radeon Graphics | 3 | 0.63% |
| sifive,u74-mc rv64imafdc | 2 | 0.42% |
| Intel Xeon Silver 4215R CPU @ 3.20GHz | 2 | 0.42% |
| Intel Xeon CPU E5-2670 0 @ 2.60GHz | 2 | 0.42% |
| Intel Xeon CPU E5-2640 0 @ 2.50GHz | 2 | 0.42% |
| Intel Xeon CPU E5-2620 v3 @ 2.40GHz | 2 | 0.42% |
| Intel Xeon CPU E5-1630 v4 @ 3.70GHz | 2 | 0.42% |
| Intel Pentium Silver N6005 @ 2.00GHz | 2 | 0.42% |
| Intel Pentium Silver N6000 @ 1.10GHz | 2 | 0.42% |
| Intel Core i7-9750H CPU @ 2.60GHz | 2 | 0.42% |
CPU Model Family
Processor model prefix


| Model | Computers | Percent |
|---|---|---|
| Intel Core i5 | 70 | 14.64% |
| Other | 69 | 14.44% |
| Intel Core 2 Duo | 64 | 13.39% |
| Intel Core i7 | 55 | 11.51% |
| Intel Celeron | 33 | 6.9% |
| Intel Core i3 | 26 | 5.44% |
| Intel Xeon | 24 | 5.02% |
| AMD Ryzen 7 | 23 | 4.81% |
| AMD Ryzen 5 | 22 | 4.6% |
| AMD Ryzen 9 | 12 | 2.51% |
| Intel Pentium | 9 | 1.88% |
| Intel Atom | 6 | 1.26% |
| Intel Pentium Silver | 5 | 1.05% |
| AMD FX | 5 | 1.05% |
| AMD A10 | 4 | 0.84% |
| Intel Xeon Gold | 3 | 0.63% |
| Intel Genuine | 3 | 0.63% |
| AMD Ryzen Threadripper | 3 | 0.63% |
| AMD Athlon II X2 | 3 | 0.63% |
| Intel Xeon Silver | 2 | 0.42% |
| Intel Pentium Gold | 2 | 0.42% |
| Intel Core i9 | 2 | 0.42% |
| Intel Core 2 Quad | 2 | 0.42% |
| AMD Ryzen 7 PRO | 2 | 0.42% |
| AMD Ryzen 5 PRO | 2 | 0.42% |
| AMD Ryzen 3 | 2 | 0.42% |
| AMD Phenom II X4 | 2 | 0.42% |
| AMD EPYC | 2 | 0.42% |
| AMD E1 | 2 | 0.42% |
| AMD Athlon II X4 | 2 | 0.42% |
| AMD A8 | 2 | 0.42% |
| Intel Pentium M | 1 | 0.21% |
| Intel Pentium Dual-Core | 1 | 0.21% |
| Intel Pentium Dual | 1 | 0.21% |
| Intel Core m3 | 1 | 0.21% |
| Intel Core M | 1 | 0.21% |
| Intel Core Duo | 1 | 0.21% |
| Intel Core 2 | 1 | 0.21% |
| ARM Allwinner | 1 | 0.21% |
| AMD Turion II Dual-Core | 1 | 0.21% |
CPU Cores
Number of processor cores


| Number | Computers | Percent |
|---|---|---|
| 2 | 173 | 36.19% |
| 4 | 160 | 33.47% |
| 6 | 43 | 9% |
| 8 | 36 | 7.53% |
| 12 | 18 | 3.77% |
| 16 | 15 | 3.14% |
| 10 | 8 | 1.67% |
| 1 | 7 | 1.46% |
| 14 | 6 | 1.26% |
| Unknown | 4 | 0.84% |
| 24 | 2 | 0.42% |
| 20 | 2 | 0.42% |
| 128 | 1 | 0.21% |
| 64 | 1 | 0.21% |
| 44 | 1 | 0.21% |
| 3 | 1 | 0.21% |
CPU Sockets
Number of sockets


| Number | Computers | Percent |
|---|---|---|
| 1 | 454 | 94.98% |
| 2 | 19 | 3.97% |
| Unknown | 4 | 0.84% |
| 16 | 1 | 0.21% |
CPU Threads
Threads per core (Hyper-Threading)


| Number | Computers | Percent |
|---|---|---|
| 2 | 275 | 57.53% |
| 1 | 198 | 41.42% |
| Unknown | 4 | 0.84% |
| 4 | 1 | 0.21% |
CPU Op-Modes
CPU Operation Modes (32-bit, 64-bit)


| Op mode | Computers | Percent |
|---|---|---|
| 32-bit, 64-bit | 466 | 97.49% |
| 32-bit | 6 | 1.26% |
| Unknown | 5 | 1.05% |
| 64-bit | 1 | 0.21% |
CPU Microcode
Microcode number


| Number | Computers | Percent |
|---|---|---|
| Unknown | 95 | 19.87% |
| 0x1067a | 56 | 11.72% |
| 0x306c3 | 23 | 4.81% |
| 0x206a7 | 19 | 3.97% |
| 0x906c0 | 17 | 3.56% |
| 0x306a9 | 14 | 2.93% |
| 0x806c1 | 12 | 2.51% |
| 0x806ec | 10 | 2.09% |
| 0x806ea | 10 | 2.09% |
| 0x406e3 | 10 | 2.09% |
| 0x906a3 | 9 | 1.88% |
| 0x0a50000d | 8 | 1.67% |
| 0x906a4 | 7 | 1.46% |
| 0x806e9 | 7 | 1.46% |
| 0x706e5 | 7 | 1.46% |
| 0x506e3 | 7 | 1.46% |
| 0x906ea | 6 | 1.26% |
| 0x0a50000c | 6 | 1.26% |
| 0x08701021 | 6 | 1.26% |
| 0x406c4 | 5 | 1.05% |
| 0x40651 | 5 | 1.05% |
| 0x08608103 | 5 | 1.05% |
| 0xa0653 | 4 | 0.84% |
| 0x90675 | 4 | 0.84% |
| 0x90672 | 4 | 0.84% |
| 0x6fd | 4 | 0.84% |
| 0x206d7 | 4 | 0.84% |
| 0x20655 | 4 | 0.84% |
| 0x10676 | 4 | 0.84% |
| 0xa0652 | 3 | 0.63% |
| 0x906eb | 3 | 0.63% |
| 0x706a8 | 3 | 0.63% |
| 0x6e8 | 3 | 0.63% |
| 0x406f1 | 3 | 0.63% |
| 0x306d4 | 3 | 0.63% |
| 0x30678 | 3 | 0.63% |
| 0x0a601203 | 3 | 0.63% |
| 0x08600106 | 3 | 0.63% |
| 0x08108102 | 3 | 0.63% |
| 0x0800820d | 3 | 0.63% |
CPU Microarch
Microarchitecture


| Name | Computers | Percent |
|---|---|---|
| Penryn | 62 | 12.97% |
| KabyLake | 57 | 11.92% |
| Unknown | 47 | 9.83% |
| Haswell | 36 | 7.53% |
| SandyBridge | 30 | 6.28% |
| Zen 3 | 25 | 5.23% |
| Skylake | 25 | 5.23% |
| Alderlake Hybrid | 20 | 4.18% |
| Tremont | 19 | 3.97% |
| Zen 2 | 18 | 3.77% |
| IvyBridge | 17 | 3.56% |
| TigerLake | 15 | 3.14% |
| Zen+ | 9 | 1.88% |
| Silvermont | 9 | 1.88% |
| CometLake | 9 | 1.88% |
| K10 | 8 | 1.67% |
| Core | 8 | 1.67% |
| Broadwell | 8 | 1.67% |
| Westmere | 7 | 1.46% |
| IceLake | 7 | 1.46% |
| Piledriver | 6 | 1.26% |
| P6 | 6 | 1.26% |
| Zen | 5 | 1.05% |
| Goldmont plus | 5 | 1.05% |
| Bonnell | 4 | 0.84% |
| Steamroller | 3 | 0.63% |
| Jaguar | 3 | 0.63% |
| Goldmont | 3 | 0.63% |
| Excavator | 3 | 0.63% |
| Puma | 2 | 0.42% |
| Nehalem | 1 | 0.21% |
| Bobcat | 1 | 0.21% |
Graphics
GPU Vendor
Vendors of graphics cards


| Vendor | Computers | Percent |
|---|---|---|
| Intel | 253 | 47.56% |
| Nvidia | 156 | 29.32% |
| AMD | 90 | 16.92% |
| ASPEED Technology | 19 | 3.57% |
| Matrox Electronics Systems | 14 | 2.63% |
GPU Model
Graphics card models


| Model | Computers | Percent |
|---|---|---|
| Nvidia C79 [GeForce 9400M G] | 47 | 8.7% |
| ASPEED Technology ASPEED Graphics Family | 19 | 3.52% |
| Intel JasperLake [UHD Graphics] | 18 | 3.33% |
| Intel 2nd Generation Core Processor Family Integrated Graphics Controller | 18 | 3.33% |
| Intel TigerLake-LP GT2 [Iris Xe Graphics] | 13 | 2.41% |
| Intel 4th Gen Core Processor Integrated Graphics Controller | 11 | 2.04% |
| Intel UHD Graphics 620 | 10 | 1.85% |
| Intel Skylake GT2 [HD Graphics 520] | 10 | 1.85% |
| Intel CometLake-U GT2 [UHD Graphics] | 10 | 1.85% |
| Intel 3rd Gen Core processor Graphics Controller | 10 | 1.85% |
| Intel Xeon E3-1200 v3/4th Gen Core Processor Integrated Graphics Controller | 9 | 1.67% |
| AMD Cezanne [Radeon Vega Series / Radeon Vega Mobile Series] | 9 | 1.67% |
| Intel HD Graphics 530 | 7 | 1.3% |
| Intel CoffeeLake-S GT2 [UHD Graphics 630] | 7 | 1.3% |
| Intel CoffeeLake-H GT2 [UHD Graphics 630] | 7 | 1.3% |
| Intel Alder Lake-P Integrated Graphics Controller | 7 | 1.3% |
| AMD Lucienne | 7 | 1.3% |
| Intel Iris Plus Graphics G1 (Ice Lake) | 6 | 1.11% |
| Intel Haswell-ULT Integrated Graphics Controller | 6 | 1.11% |
| Intel Alder Lake-UP3 GT2 [Iris Xe Graphics] | 6 | 1.11% |
| Nvidia GK208B [GeForce GT 710] | 5 | 0.93% |
| Matrox Electronics Systems MGA G200EH | 5 | 0.93% |
| Intel WhiskeyLake-U GT2 [UHD Graphics 620] | 5 | 0.93% |
| Intel Atom/Celeron/Pentium Processor x5-E8000/J3xxx/N3xxx Integrated Graphics Controller | 5 | 0.93% |
| AMD Renoir | 5 | 0.93% |
| AMD Picasso/Raven 2 [Radeon Vega Series / Radeon Vega Mobile Series] | 5 | 0.93% |
| Matrox Electronics Systems MGA G200eW WPCM450 | 4 | 0.74% |
| Intel HD Graphics 620 | 4 | 0.74% |
| Intel GeminiLake [UHD Graphics 600] | 4 | 0.74% |
| Intel Core Processor Integrated Graphics Controller | 4 | 0.74% |
| Intel CometLake-S GT2 [UHD Graphics 630] | 4 | 0.74% |
| Intel Atom Processor Z36xxx/Z37xxx Series Graphics & Display | 4 | 0.74% |
| Intel AlderLake-S GT1 | 4 | 0.74% |
| Intel 82G33/G31 Express Integrated Graphics Controller | 4 | 0.74% |
| AMD Ellesmere [Radeon RX 470/480/570/570X/580/580X/590] | 4 | 0.74% |
| Nvidia TU117 [GeForce GTX 1650] | 3 | 0.56% |
| Nvidia GP107 [GeForce GTX 1050 Ti] | 3 | 0.56% |
| Nvidia GP106M [GeForce GTX 1060 Mobile] | 3 | 0.56% |
| Nvidia GM107 [GeForce GTX 750 Ti] | 3 | 0.56% |
| Nvidia GA107M [GeForce RTX 3050 Ti Mobile] | 3 | 0.56% |
GPU Combo
Combinations of graphics cards


| Name | Computers | Percent |
|---|---|---|
| 1 x Intel | 194 | 40.59% |
| 1 x Nvidia | 93 | 19.46% |
| 1 x AMD | 68 | 14.23% |
| Intel + Nvidia | 48 | 10.04% |
| Other | 20 | 4.18% |
| 1 x ASPEED | 14 | 2.93% |
| 1 x Matrox | 12 | 2.51% |
| Intel + AMD | 8 | 1.67% |
| AMD + Nvidia | 8 | 1.67% |
| 2 x AMD | 4 | 0.84% |
| Nvidia + ASPEED | 4 | 0.84% |
| 2 x Intel | 2 | 0.42% |
| Nvidia + Matrox | 1 | 0.21% |
| AMD + Matrox | 1 | 0.21% |
| AMD + ASPEED | 1 | 0.21% |
GPU Driver
Free vs proprietary


| Driver | Computers | Percent |
|---|---|---|
| Free | 355 | 74.27% |
| Unknown | 78 | 16.32% |
| Proprietary | 45 | 9.41% |
GPU Memory
Total video memory


| Size in GB | Computers | Percent |
|---|---|---|
| Unknown | 316 | 66.11% |
| 0.01-0.5 | 82 | 17.15% |
| 1.01-2.0 | 23 | 4.81% |
| 0.51-1.0 | 19 | 3.97% |
| 3.01-4.0 | 18 | 3.77% |
| 7.01-8.0 | 10 | 2.09% |
| 5.01-6.0 | 5 | 1.05% |
| 8.01-16.0 | 5 | 1.05% |
Monitor
Monitor Vendor
Monitor vendors


| Vendor | Computers | Percent |
|---|---|---|
| AU Optronics | 52 | 12.71% |
| Apple | 51 | 12.47% |
| Samsung Electronics | 33 | 8.07% |
| LG Display | 31 | 7.58% |
| BOE | 30 | 7.33% |
| Chimei Innolux | 27 | 6.6% |
| Dell | 24 | 5.87% |
| Acer | 18 | 4.4% |
| Hewlett-Packard | 15 | 3.67% |
| Philips | 14 | 3.42% |
| Goldstar | 11 | 2.69% |
| Sharp | 8 | 1.96% |
| BenQ | 8 | 1.96% |
| Chi Mei Optoelectronics | 7 | 1.71% |
| Ancor Communications | 7 | 1.71% |
| AOC | 6 | 1.47% |
| Unknown | 4 | 0.98% |
| Sony | 4 | 0.98% |
| PANDA | 4 | 0.98% |
| InfoVision | 4 | 0.98% |
| NEC Computers | 3 | 0.73% |
| Iiyama | 3 | 0.73% |
| Unknown | 3 | 0.73% |
| ViewSonic | 2 | 0.49% |
| Panasonic | 2 | 0.49% |
| Mi | 2 | 0.49% |
| LG Philips | 2 | 0.49% |
| LG Electronics | 2 | 0.49% |
| Lenovo | 2 | 0.49% |
| CSO | 2 | 0.49% |
| Belinea | 2 | 0.49% |
| ASUSTek Computer | 2 | 0.49% |
| Vizio | 1 | 0.24% |
| TCT | 1 | 0.24% |
| TCL | 1 | 0.24% |
| SKY | 1 | 0.24% |
| Quanta Display | 1 | 0.24% |
| PQA | 1 | 0.24% |
| Pixio | 1 | 0.24% |
| OVR | 1 | 0.24% |
Monitor Model
Monitor models


| Model | Computers | Percent |
|---|---|---|
| Apple LCD Monitor APP9C5F 1280x800 286x179mm 13.3-inch | 36 | 8.61% |
| Apple Color LCD APP9C5B 1280x800 286x179mm 13.3-inch | 10 | 2.39% |
| Dell U2412M DELA07A 1920x1200 518x324mm 24.1-inch | 3 | 0.72% |
| Chimei Innolux LCD Monitor CMN14D5 1920x1080 309x173mm 13.9-inch | 3 | 0.72% |
| Unknown | 3 | 0.72% |
| Unknown LCD Monitor FFFF 2288x1287 2550x2550mm 142.0-inch | 2 | 0.48% |
| Sharp LCD Monitor SHP1516 3840x2400 336x210mm 15.6-inch | 2 | 0.48% |
| Samsung Electronics LCD Monitor SDC4161 1920x1080 344x194mm 15.5-inch | 2 | 0.48% |
| Philips PHL 242V8 PHLC219 1920x1080 527x296mm 23.8-inch | 2 | 0.48% |
| Philips 236VL PHLC082 1920x1080 509x286mm 23.0-inch | 2 | 0.48% |
| PANDA LCD Monitor NCP0035 1920x1080 309x174mm 14.0-inch | 2 | 0.48% |
| LG Display LCD Monitor LGD04E1 1366x768 344x194mm 15.5-inch | 2 | 0.48% |
| LG Display LCD Monitor LGD046F 1920x1080 344x194mm 15.5-inch | 2 | 0.48% |
| LG Display LCD Monitor LGD034C 1366x768 293x165mm 13.2-inch | 2 | 0.48% |
| InfoVision LCD Monitor IVO0533 1366x768 293x165mm 13.2-inch | 2 | 0.48% |
| Hewlett-Packard E232 HWP3279 1920x1080 509x286mm 23.0-inch | 2 | 0.48% |
| Hewlett-Packard E201 HWP305F 1600x900 443x249mm 20.0-inch | 2 | 0.48% |
| Hewlett-Packard E201 HWP305C 1600x900 443x249mm 20.0-inch | 2 | 0.48% |
| Goldstar FULL HD GSM5B55 1920x1080 480x270mm 21.7-inch | 2 | 0.48% |
| CSO LCD Monitor CSO1411 3840x2400 302x189mm 14.0-inch | 2 | 0.48% |
| Chimei Innolux LCD Monitor CMN1738 1920x1080 381x214mm 17.2-inch | 2 | 0.48% |
| Chimei Innolux LCD Monitor CMN15E5 1920x1080 344x193mm 15.5-inch | 2 | 0.48% |
| BOE LCD Monitor BOE07D8 1920x1080 344x194mm 15.5-inch | 2 | 0.48% |
| BOE LCD Monitor BOE0747 1920x1080 344x194mm 15.5-inch | 2 | 0.48% |
| BenQ GW2480 BNQ78E7 1920x1080 527x296mm 23.8-inch | 2 | 0.48% |
| AU Optronics LCD Monitor AUOE48D 1920x1080 344x194mm 15.5-inch | 2 | 0.48% |
| AU Optronics LCD Monitor AUO623D 1920x1080 309x174mm 14.0-inch | 2 | 0.48% |
| AU Optronics LCD Monitor AUO592D 1920x1080 293x165mm 13.2-inch | 2 | 0.48% |
| AU Optronics LCD Monitor AUO36ED 1920x1080 344x193mm 15.5-inch | 2 | 0.48% |
| AU Optronics LCD Monitor AUO2B99 1920x1080 293x165mm 13.2-inch | 2 | 0.48% |
| AU Optronics LCD Monitor AUO26EC 1366x768 344x193mm 15.5-inch | 2 | 0.48% |
| AU Optronics LCD Monitor AUO22EC 1366x768 344x193mm 15.5-inch | 2 | 0.48% |
| AU Optronics LCD Monitor AUO133D 1920x1080 309x173mm 13.9-inch | 2 | 0.48% |
| AU Optronics LCD Monitor AUO109D 1920x1080 381x214mm 17.2-inch | 2 | 0.48% |
| Acer G215HV ACR0227 1920x1080 477x268mm 21.5-inch | 2 | 0.48% |
| Vizio D50n-E1 VIZ1009 1920x1080 953x543mm 43.2-inch | 1 | 0.24% |
| ViewSonic VX2453 Series VSC0C28 1920x1080 520x290mm 23.4-inch | 1 | 0.24% |
| ViewSonic VG730m VSC951E 1280x1024 338x270mm 17.0-inch | 1 | 0.24% |
| Unknown LCD Monitor TCT DP1080P60 1920x1080 | 1 | 0.24% |
| Unknown LCD Monitor SAMSUNG 3840x2160 | 1 | 0.24% |
Monitor Resolution
Monitor screen resolution


| Resolution | Computers | Percent |
|---|---|---|
| 1920x1080 (FHD) | 153 | 38.83% |
| 1366x768 (WXGA) | 54 | 13.71% |
| 1280x800 (WXGA) | 52 | 13.2% |
| 3840x2160 (4K) | 28 | 7.11% |
| 2560x1440 (QHD) | 21 | 5.33% |
| 1920x1200 (WUXGA) | 12 | 3.05% |
| 1280x1024 (SXGA) | 10 | 2.54% |
| Unknown | 7 | 1.78% |
| 1600x900 (HD+) | 6 | 1.52% |
| 1440x900 (WXGA+) | 6 | 1.52% |
| 3840x2400 | 5 | 1.27% |
| 1680x1050 (WSXGA+) | 5 | 1.27% |
| 3440x1440 | 4 | 1.02% |
| 2560x1080 | 3 | 0.76% |
| 3840x1200 | 2 | 0.51% |
| 3840x1080 | 2 | 0.51% |
| 2880x1800 | 2 | 0.51% |
| 2560x1600 | 2 | 0.51% |
| 2288x1287 | 2 | 0.51% |
| 1920x1280 | 2 | 0.51% |
| 1600x1200 | 2 | 0.51% |
| 1024x600 | 2 | 0.51% |
| 6160x1440 | 1 | 0.25% |
| 3456x2160 | 1 | 0.25% |
| 3286x1080 | 1 | 0.25% |
| 3200x1800 (QHD+) | 1 | 0.25% |
| 2966x900 | 1 | 0.25% |
| 2880x1920 | 1 | 0.25% |
| 2736x1824 | 1 | 0.25% |
| 1800x1200 | 1 | 0.25% |
| 1360x768 | 1 | 0.25% |
| 1280x720 (HD) | 1 | 0.25% |
| 1080x1920 | 1 | 0.25% |
| 1024x768 (XGA) | 1 | 0.25% |
Monitor Diagonal
Diagonal size in inches


| Inches | Computers | Percent |
|---|---|---|
| 13 | 95 | 23.4% |
| 15 | 78 | 19.21% |
| 27 | 27 | 6.65% |
| 14 | 27 | 6.65% |
| Unknown | 26 | 6.4% |
| 24 | 23 | 5.67% |
| 17 | 23 | 5.67% |
| 23 | 21 | 5.17% |
| 21 | 11 | 2.71% |
| 31 | 8 | 1.97% |
| 18 | 8 | 1.97% |
| 34 | 5 | 1.23% |
| 20 | 5 | 1.23% |
| 12 | 5 | 1.23% |
| 11 | 5 | 1.23% |
| 10 | 5 | 1.23% |
| 32 | 4 | 0.99% |
| 16 | 4 | 0.99% |
| 84 | 3 | 0.74% |
| 72 | 3 | 0.74% |
| 54 | 3 | 0.74% |
| 142 | 2 | 0.49% |
| 43 | 2 | 0.49% |
| 40 | 2 | 0.49% |
| 28 | 2 | 0.49% |
| 26 | 2 | 0.49% |
| 22 | 2 | 0.49% |
| 19 | 2 | 0.49% |
| 99 | 1 | 0.25% |
| 75 | 1 | 0.25% |
| 25 | 1 | 0.25% |
Monitor Width
Physical width


| Width in mm | Computers | Percent |
|---|---|---|
| 301-350 | 131 | 32.59% |
| 201-300 | 92 | 22.89% |
| 501-600 | 67 | 16.67% |
| 401-500 | 26 | 6.47% |
| Unknown | 26 | 6.47% |
| 351-400 | 20 | 4.98% |
| 601-700 | 14 | 3.48% |
| 701-800 | 9 | 2.24% |
| 1501-2000 | 7 | 1.74% |
| 1001-1500 | 4 | 1% |
| More than 2000 | 3 | 0.75% |
| 801-900 | 2 | 0.5% |
| 901-1000 | 1 | 0.25% |
Aspect Ratio
Proportional relationship between the width and the height


| Ratio | Computers | Percent |
|---|---|---|
| 16/9 | 229 | 61.89% |
| 16/10 | 86 | 23.24% |
| Unknown | 24 | 6.49% |
| 5/4 | 10 | 2.7% |
| 21/9 | 7 | 1.89% |
| 3/2 | 5 | 1.35% |
| 4/3 | 4 | 1.08% |
| 1.00 | 2 | 0.54% |
| 3.20 | 1 | 0.27% |
| 11/10 | 1 | 0.27% |
| 0.56 | 1 | 0.27% |
Monitor Area
Area in inch²


| Area in inch² | Computers | Percent |
|---|---|---|
| 81-90 | 95 | 23.46% |
| 101-110 | 75 | 18.52% |
| 201-250 | 41 | 10.12% |
| 301-350 | 28 | 6.91% |
| 71-80 | 27 | 6.67% |
| Unknown | 26 | 6.42% |
| 351-500 | 17 | 4.2% |
| 251-300 | 15 | 3.7% |
| More than 1000 | 13 | 3.21% |
| 151-200 | 13 | 3.21% |
| 141-150 | 13 | 3.21% |
| 121-130 | 13 | 3.21% |
| 51-60 | 6 | 1.48% |
| 131-140 | 5 | 1.23% |
| 111-120 | 5 | 1.23% |
| 61-70 | 4 | 0.99% |
| 41-50 | 4 | 0.99% |
| 501-1000 | 4 | 0.99% |
| 91-100 | 1 | 0.25% |
Pixel Density
Pixels per inch


| Density | Computers | Percent |
|---|---|---|
| 101-120 | 120 | 30.23% |
| 121-160 | 104 | 26.2% |
| 51-100 | 97 | 24.43% |
| 161-240 | 30 | 7.56% |
| Unknown | 26 | 6.55% |
| More than 240 | 12 | 3.02% |
| 1-50 | 8 | 2.02% |
Multiple Monitors
Total monitors connected


| Total | Computers | Percent |
|---|---|---|
| 1 | 302 | 63.18% |
| 0 | 112 | 23.43% |
| 2 | 61 | 12.76% |
| 3 | 3 | 0.63% |
Network
Net Controller Vendor
Controller vendors


| Vendor | Computers | Percent |
|---|---|---|
| Intel | 258 | 35.25% |
| Realtek Semiconductor | 199 | 27.19% |
| Broadcom | 85 | 11.61% |
| Nvidia | 51 | 6.97% |
| Qualcomm Atheros | 46 | 6.28% |
| MediaTek | 12 | 1.64% |
| Broadcom Limited | 9 | 1.23% |
| ASIX Electronics | 9 | 1.23% |
| Ralink Technology | 5 | 0.68% |
| Mellanox Technologies | 5 | 0.68% |
| Dell | 5 | 0.68% |
| TP-Link | 4 | 0.55% |
| Aquantia | 3 | 0.41% |
| Sigma Designs | 2 | 0.27% |
| Sierra Wireless | 2 | 0.27% |
| Samsung Electronics | 2 | 0.27% |
| Ralink | 2 | 0.27% |
| Qualcomm Atheros Communications | 2 | 0.27% |
| Qualcomm | 2 | 0.27% |
| OPPO Electronics | 2 | 0.27% |
| Motorola PCS | 2 | 0.27% |
| Huawei Technologies | 2 | 0.27% |
| Edimax Technology | 2 | 0.27% |
| D-Link System | 2 | 0.27% |
| ASUSTek Computer | 2 | 0.27% |
| ZyDAS | 1 | 0.14% |
| Tenda | 1 | 0.14% |
| SysKonnect | 1 | 0.14% |
| Quectel Wireless Solutions | 1 | 0.14% |
| QLogic | 1 | 0.14% |
| QinHeng Electronics | 1 | 0.14% |
| Microsoft | 1 | 0.14% |
| Microchip Technology | 1 | 0.14% |
| Marvell Technology Group | 1 | 0.14% |
| Lakeview Research | 1 | 0.14% |
| ICS Advent | 1 | 0.14% |
| IBM | 1 | 0.14% |
| Ericsson Business Mobile Networks | 1 | 0.14% |
| Dresden Elektronik | 1 | 0.14% |
| DisplayLink | 1 | 0.14% |
Net Controller Model
Controller models


| Model | Computers | Percent |
|---|---|---|
| Realtek RTL8111/8168/8411 PCI Express Gigabit Ethernet Controller | 119 | 13.98% |
| Nvidia MCP79 Ethernet | 49 | 5.76% |
| Broadcom BCM4322 802.11a/b/g/n Wireless LAN Controller | 48 | 5.64% |
| Realtek RTL810xE PCI Express Fast Ethernet controller | 22 | 2.59% |
| Intel Wi-Fi 6 AX200 | 22 | 2.59% |
| Realtek RTL8125 2.5GbE Controller | 21 | 2.47% |
| Intel Alder Lake-P PCH CNVi WiFi | 16 | 1.88% |
| Intel 82579LM Gigabit Network Connection (Lewisville) | 16 | 1.88% |
| Intel Wireless 8265 / 8275 | 14 | 1.65% |
| Intel Wi-Fi 6 AX201 | 14 | 1.65% |
| Intel Ethernet Connection I217-LM | 14 | 1.65% |
| Realtek RTL8153 Gigabit Ethernet Adapter | 12 | 1.41% |
| Intel Wireless 3165 | 12 | 1.41% |
| Intel Wireless 7260 | 11 | 1.29% |
| Intel I350 Gigabit Network Connection | 11 | 1.29% |
| Intel Ethernet Controller I225-V | 11 | 1.29% |
| Qualcomm Atheros QCA9377 802.11ac Wireless Network Adapter | 10 | 1.18% |
| Intel I211 Gigabit Network Connection | 9 | 1.06% |
| Intel Comet Lake PCH-LP CNVi WiFi | 9 | 1.06% |
| ASIX AX88179 Gigabit Ethernet | 9 | 1.06% |
| Realtek RTL8821CE 802.11ac PCIe Wireless Network Adapter | 8 | 0.94% |
| Qualcomm Atheros AR9485 Wireless Network Adapter | 8 | 0.94% |
| Intel Wireless 8260 | 8 | 0.94% |
| Intel Ethernet Connection (2) I219-LM | 8 | 0.94% |
| Qualcomm Atheros QCA9565 / AR9565 Wireless Network Adapter | 7 | 0.82% |
| Intel Wireless 7265 | 7 | 0.82% |
| Realtek RTL8723BE PCIe Wireless Network Adapter | 6 | 0.71% |
| Intel Wi-Fi 6 AX210/AX211/AX411 160MHz | 6 | 0.71% |
| Intel Wi-Fi 6 AX201 160MHz | 6 | 0.71% |
| Intel PRO/Wireless 3945ABG [Golan] Network Connection | 6 | 0.71% |
| Intel Ethernet Connection (4) I219-V | 6 | 0.71% |
| Realtek RTL8852AE 802.11ax PCIe Wireless Network Adapter | 5 | 0.59% |
| MediaTek MT7921 802.11ax PCI Express Wireless Network Adapter | 5 | 0.59% |
| Intel Wireless-AC 9260 | 5 | 0.59% |
| Intel Ethernet Connection X722 for 10GBASE-T | 5 | 0.59% |
| Intel Cannon Lake PCH CNVi WiFi | 5 | 0.59% |
| Broadcom BCM57412 NetXtreme-E 10Gb RDMA Ethernet Controller | 5 | 0.59% |
| Qualcomm Atheros QCA6174 802.11ac Wireless Network Adapter | 4 | 0.47% |
| Intel Ethernet Controller X550 | 4 | 0.47% |
| Intel Ethernet Controller I226-V | 4 | 0.47% |
Wireless Vendor
Wireless vendors


| Vendor | Computers | Percent |
|---|---|---|
| Intel | 177 | 49.44% |
| Broadcom | 58 | 16.2% |
| Realtek Semiconductor | 40 | 11.17% |
| Qualcomm Atheros | 39 | 10.89% |
| MediaTek | 10 | 2.79% |
| Broadcom Limited | 6 | 1.68% |
| Ralink Technology | 5 | 1.4% |
| Dell | 4 | 1.12% |
| TP-Link | 3 | 0.84% |
| Sierra Wireless | 2 | 0.56% |
| Ralink | 2 | 0.56% |
| Qualcomm Atheros Communications | 2 | 0.56% |
| Edimax Technology | 2 | 0.56% |
| ASUSTek Computer | 2 | 0.56% |
| ZyDAS | 1 | 0.28% |
| Tenda | 1 | 0.28% |
| Quectel Wireless Solutions | 1 | 0.28% |
| Qualcomm | 1 | 0.28% |
| D-Link System | 1 | 0.28% |
| D-Link | 1 | 0.28% |
Wireless Model
Wireless models


| Model | Computers | Percent |
|---|---|---|
| Broadcom BCM4322 802.11a/b/g/n Wireless LAN Controller | 48 | 13.33% |
| Intel Wi-Fi 6 AX200 | 22 | 6.11% |
| Intel Alder Lake-P PCH CNVi WiFi | 16 | 4.44% |
| Intel Wireless 8265 / 8275 | 14 | 3.89% |
| Intel Wi-Fi 6 AX201 | 14 | 3.89% |
| Intel Wireless 3165 | 12 | 3.33% |
| Intel Wireless 7260 | 11 | 3.06% |
| Qualcomm Atheros QCA9377 802.11ac Wireless Network Adapter | 10 | 2.78% |
| Intel Comet Lake PCH-LP CNVi WiFi | 9 | 2.5% |
| Realtek RTL8821CE 802.11ac PCIe Wireless Network Adapter | 8 | 2.22% |
| Qualcomm Atheros AR9485 Wireless Network Adapter | 8 | 2.22% |
| Intel Wireless 8260 | 8 | 2.22% |
| Qualcomm Atheros QCA9565 / AR9565 Wireless Network Adapter | 7 | 1.94% |
| Intel Wireless 7265 | 7 | 1.94% |
| Realtek RTL8723BE PCIe Wireless Network Adapter | 6 | 1.67% |
| Intel Wi-Fi 6 AX210/AX211/AX411 160MHz | 6 | 1.67% |
| Intel Wi-Fi 6 AX201 160MHz | 6 | 1.67% |
| Intel PRO/Wireless 3945ABG [Golan] Network Connection | 6 | 1.67% |
| Realtek RTL8852AE 802.11ax PCIe Wireless Network Adapter | 5 | 1.39% |
| MediaTek MT7921 802.11ax PCI Express Wireless Network Adapter | 5 | 1.39% |
| Intel Wireless-AC 9260 | 5 | 1.39% |
| Intel Cannon Lake PCH CNVi WiFi | 5 | 1.39% |
| Qualcomm Atheros QCA6174 802.11ac Wireless Network Adapter | 4 | 1.11% |
| Intel Comet Lake PCH CNVi WiFi | 4 | 1.11% |
| Intel Alder Lake-S PCH CNVi WiFi | 4 | 1.11% |
| Broadcom BCM4313 802.11bgn Wireless Network Adapter | 4 | 1.11% |
| Realtek RTL8822CE 802.11ac PCIe Wireless Network Adapter | 3 | 0.83% |
| Realtek RTL8188EUS 802.11n Wireless Network Adapter | 3 | 0.83% |
| Qualcomm Atheros AR9462 Wireless Network Adapter | 3 | 0.83% |
| Qualcomm Atheros AR9285 Wireless Network Adapter (PCI-Express) | 3 | 0.83% |
| Intel Wireless 3160 | 3 | 0.83% |
| Intel Ice Lake-LP PCH CNVi WiFi | 3 | 0.83% |
| Intel Centrino Advanced-N 6205 [Taylor Peak] | 3 | 0.83% |
| Intel Cannon Point-LP CNVi [Wireless-AC] | 3 | 0.83% |
| Realtek RTL88x2bu [AC1200 Techkey] | 2 | 0.56% |
| Realtek RTL8723DE Wireless Network Adapter | 2 | 0.56% |
| Realtek RTL8191SEvB Wireless LAN Controller | 2 | 0.56% |
| Realtek 802.11ac NIC | 2 | 0.56% |
| Ralink MT7601U Wireless Adapter | 2 | 0.56% |
| Qualcomm Atheros AR9271 802.11n | 2 | 0.56% |
Ethernet Vendor
Ethernet vendors


| Vendor | Computers | Percent |
|---|---|---|
| Realtek Semiconductor | 180 | 38.71% |
| Intel | 152 | 32.69% |
| Nvidia | 51 | 10.97% |
| Broadcom | 29 | 6.24% |
| Qualcomm Atheros | 15 | 3.23% |
| ASIX Electronics | 9 | 1.94% |
| Mellanox Technologies | 3 | 0.65% |
| Broadcom Limited | 3 | 0.65% |
| Aquantia | 3 | 0.65% |
| Samsung Electronics | 2 | 0.43% |
| OPPO Electronics | 2 | 0.43% |
| MediaTek | 2 | 0.43% |
| TP-Link | 1 | 0.22% |
| SysKonnect | 1 | 0.22% |
| Qualcomm | 1 | 0.22% |
| QLogic | 1 | 0.22% |
| Motorola PCS | 1 | 0.22% |
| Microsoft | 1 | 0.22% |
| Microchip Technology | 1 | 0.22% |
| Marvell Technology Group | 1 | 0.22% |
| ICS Advent | 1 | 0.22% |
| IBM | 1 | 0.22% |
| Huawei Technologies | 1 | 0.22% |
| DisplayLink | 1 | 0.22% |
| D-Link System | 1 | 0.22% |
| American Megatrends | 1 | 0.22% |
Ethernet Model
Ethernet models


| Model | Computers | Percent |
|---|---|---|
| Realtek RTL8111/8168/8411 PCI Express Gigabit Ethernet Controller | 119 | 24.79% |
| Nvidia MCP79 Ethernet | 49 | 10.21% |
| Realtek RTL810xE PCI Express Fast Ethernet controller | 22 | 4.58% |
| Realtek RTL8125 2.5GbE Controller | 21 | 4.38% |
| Intel 82579LM Gigabit Network Connection (Lewisville) | 16 | 3.33% |
| Intel Ethernet Connection I217-LM | 14 | 2.92% |
| Realtek RTL8153 Gigabit Ethernet Adapter | 12 | 2.5% |
| Intel I350 Gigabit Network Connection | 11 | 2.29% |
| Intel Ethernet Controller I225-V | 11 | 2.29% |
| Intel I211 Gigabit Network Connection | 9 | 1.88% |
| ASIX AX88179 Gigabit Ethernet | 9 | 1.88% |
| Intel Ethernet Connection (2) I219-LM | 8 | 1.67% |
| Intel Ethernet Connection (4) I219-V | 6 | 1.25% |
| Intel Ethernet Connection X722 for 10GBASE-T | 5 | 1.04% |
| Broadcom BCM57412 NetXtreme-E 10Gb RDMA Ethernet Controller | 5 | 1.04% |
| Intel Ethernet Controller X550 | 4 | 0.83% |
| Intel Ethernet Controller I226-V | 4 | 0.83% |
| Intel Ethernet Connection (4) I219-LM | 4 | 0.83% |
| Intel Ethernet Connection (13) I219-V | 4 | 0.83% |
| Intel 82599ES 10-Gigabit SFI/SFP+ Network Connection | 4 | 0.83% |
| Realtek RTL8152 Fast Ethernet Adapter | 3 | 0.63% |
| Qualcomm Atheros QCA8171 Gigabit Ethernet | 3 | 0.63% |
| Intel I210 Gigabit Network Connection | 3 | 0.63% |
| Intel Ethernet Connection I217-V | 3 | 0.63% |
| Intel Ethernet Connection (7) I219-V | 3 | 0.63% |
| Intel Ethernet Connection (2) I219-V | 3 | 0.63% |
| Intel Ethernet Connection (16) I219-V | 3 | 0.63% |
| Intel Ethernet Connection (11) I219-LM | 3 | 0.63% |
| Intel 82574L Gigabit Network Connection | 3 | 0.63% |
| Broadcom NetXtreme BCM5720 Gigabit Ethernet PCIe | 3 | 0.63% |
| Broadcom NetXtreme BCM5719 Gigabit Ethernet PCIe | 3 | 0.63% |
| Broadcom NetLink BCM57785 Gigabit Ethernet PCIe | 3 | 0.63% |
| Realtek USB 10/100/1G/2.5G LAN | 2 | 0.42% |
| Realtek RTL-8100/8101L/8139 PCI Fast Ethernet Adapter | 2 | 0.42% |
| Qualcomm Atheros Killer E220x Gigabit Ethernet Controller | 2 | 0.42% |
| Qualcomm Atheros AR8152 v2.0 Fast Ethernet | 2 | 0.42% |
| OPPO RMX3263 | 2 | 0.42% |
| Nvidia MCP61 Ethernet | 2 | 0.42% |
| Mellanox MT26448 [ConnectX EN 10GigE, PCIe 2.0 5GT/s] | 2 | 0.42% |
| MediaTek U318AA | 2 | 0.42% |
Net Controller Kind
Ethernet, WiFi or modem


| Kind | Computers | Percent |
|---|---|---|
| Ethernet | 415 | 54.11% |
| WiFi | 341 | 44.46% |
| Modem | 8 | 1.04% |
| Unknown | 3 | 0.39% |
Used Controller
Currently used network controller


| Kind | Computers | Percent |
|---|---|---|
| Ethernet | 249 | 52.98% |
| WiFi | 221 | 47.02% |
NICs
Total network controllers on board


| Total | Computers | Percent |
|---|---|---|
| 2 | 263 | 55.02% |
| 1 | 139 | 29.08% |
| 3 | 26 | 5.44% |
| 0 | 21 | 4.39% |
| 4 | 17 | 3.56% |
| 5 | 5 | 1.05% |
| 6 | 4 | 0.84% |
| 8 | 2 | 0.42% |
| 7 | 1 | 0.21% |
IPv6
IPv6 vs IPv4


| Used | Computers | Percent |
|---|---|---|
| No | 371 | 77.62% |
| Yes | 107 | 22.38% |
Bluetooth
Bluetooth Vendor
Controller vendors


| Vendor | Computers | Percent |
|---|---|---|
| Intel | 152 | 50.33% |
| Apple | 52 | 17.22% |
| Realtek Semiconductor | 23 | 7.62% |
| Cambridge Silicon Radio | 15 | 4.97% |
| Qualcomm Atheros Communications | 14 | 4.64% |
| Lite-On Technology | 10 | 3.31% |
| IMC Networks | 10 | 3.31% |
| Foxconn / Hon Hai | 8 | 2.65% |
| Hewlett-Packard | 4 | 1.32% |
| Dell | 4 | 1.32% |
| Broadcom | 3 | 0.99% |
| MediaTek | 2 | 0.66% |
| TP-Link | 1 | 0.33% |
| SINO WEALTH | 1 | 0.33% |
| Chicony Electronics | 1 | 0.33% |
| ASUSTek Computer | 1 | 0.33% |
| Unknown | 1 | 0.33% |
Bluetooth Model
Controller models


| Model | Computers | Percent |
|---|---|---|
| Intel Bluetooth wireless interface | 49 | 16.23% |
| Apple Built-in Bluetooth 2.0+EDR HCI | 47 | 15.56% |
| Intel AX201 Bluetooth | 36 | 11.92% |
| Intel AX200 Bluetooth | 22 | 7.28% |
| Intel Bluetooth 9460/9560 Jefferson Peak (JfP) | 16 | 5.3% |
| Realtek Bluetooth Radio | 15 | 4.97% |
| Cambridge Silicon Radio Bluetooth Dongle (HCI mode) | 15 | 4.97% |
| Intel Bluetooth Device | 14 | 4.64% |
| Qualcomm Atheros Bluetooth Device | 9 | 2.98% |
| Realtek Bluetooth 4.2 Adapter | 5 | 1.66% |
| Intel Wireless-AC 9260 Bluetooth Adapter | 5 | 1.66% |
| Intel AX210 Bluetooth | 5 | 1.66% |
| Apple Bluetooth Host Controller | 5 | 1.66% |
| Lite-On Atheros AR3012 Bluetooth | 4 | 1.32% |
| Foxconn / Hon Hai Wireless_Device | 4 | 1.32% |
| HP Broadcom 2070 Bluetooth Combo | 3 | 0.99% |
| Dell BCM20702A0 Bluetooth Module | 3 | 0.99% |
| Realtek RTL8723B Bluetooth | 2 | 0.66% |
| Qualcomm Atheros AR3012 Bluetooth 4.0 | 2 | 0.66% |
| MediaTek Wireless_Device | 2 | 0.66% |
| Lite-On Qualcomm Atheros QCA9377 Bluetooth | 2 | 0.66% |
| Lite-On Bluetooth Device | 2 | 0.66% |
| Intel Wireless-AC 3168 Bluetooth | 2 | 0.66% |
| Intel Centrino Advanced-N 6230 Bluetooth adapter | 2 | 0.66% |
| IMC Networks Wireless_Device | 2 | 0.66% |
| IMC Networks Bluetooth Radio | 2 | 0.66% |
| IMC Networks Bluetooth Module | 2 | 0.66% |
| IMC Networks Bluetooth Device | 2 | 0.66% |
| Foxconn / Hon Hai Bluetooth Device | 2 | 0.66% |
| TP-Link UB500 Adapter | 1 | 0.33% |
| SINO WEALTH RK Bluetooth Keyboard | 1 | 0.33% |
| Realtek RT Bluetooth Radio | 1 | 0.33% |
| Qualcomm Atheros QCA61x4 Bluetooth 4.0 | 1 | 0.33% |
| Qualcomm Atheros AR3011 Bluetooth (no firmware) | 1 | 0.33% |
| Qualcomm Atheros AR3011 Bluetooth | 1 | 0.33% |
| Lite-On Wireless_Device | 1 | 0.33% |
| Lite-On Atheros Bluetooth | 1 | 0.33% |
| Intel Centrino Bluetooth Wireless Transceiver | 1 | 0.33% |
| IMC Networks Bluetooth USB Host Controller | 1 | 0.33% |
| IMC Networks Atheros AR3012 Bluetooth 4.0 Adapter | 1 | 0.33% |
Sound
Sound Vendor
Sound card vendors
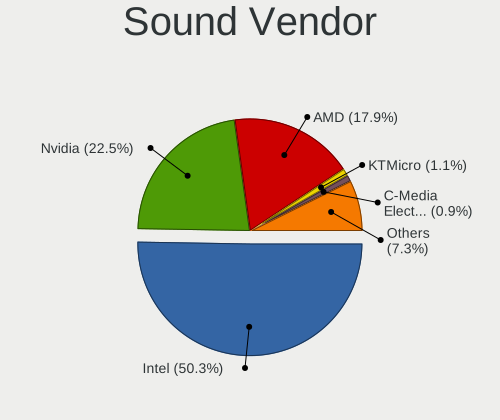

| Vendor | Computers | Percent |
|---|---|---|
| Intel | 281 | 50.27% |
| Nvidia | 126 | 22.54% |
| AMD | 100 | 17.89% |
| KTMicro | 6 | 1.07% |
| C-Media Electronics | 5 | 0.89% |
| ASUSTek Computer | 5 | 0.89% |
| Logitech | 4 | 0.72% |
| Texas Instruments | 3 | 0.54% |
| Lenovo | 3 | 0.54% |
| Dell | 3 | 0.54% |
| Zoran Co. Personal Media Division (Nogatech) | 2 | 0.36% |
| SteelSeries ApS | 2 | 0.36% |
| Realtek Semiconductor | 2 | 0.36% |
| JMTek | 2 | 0.36% |
| Corsair | 2 | 0.36% |
| Plantronics | 1 | 0.18% |
| Phoenix Audio Technologies | 1 | 0.18% |
| Musical Fidelity | 1 | 0.18% |
| Micro Star International | 1 | 0.18% |
| GN Netcom | 1 | 0.18% |
| Giga-Byte Technology | 1 | 0.18% |
| Focusrite-Novation | 1 | 0.18% |
| ESS Technology | 1 | 0.18% |
| Ensoniq | 1 | 0.18% |
| D&M Holdings (Denon/Marantz) | 1 | 0.18% |
| Creative Technology | 1 | 0.18% |
| Conexant Systems | 1 | 0.18% |
| ASRock | 1 | 0.18% |
Sound Model
Sound card models


| Model | Computers | Percent |
|---|---|---|
| Nvidia MCP79 High Definition Audio | 50 | 7.6% |
| AMD Family 17h/19h HD Audio Controller | 36 | 5.47% |
| Intel Sunrise Point-LP HD Audio | 30 | 4.56% |
| AMD Renoir Radeon High Definition Audio Controller | 25 | 3.8% |
| Intel 8 Series/C220 Series Chipset High Definition Audio Controller | 23 | 3.5% |
| Intel Xeon E3-1200 v3/4th Gen Core Processor HD Audio Controller | 22 | 3.34% |
| AMD Starship/Matisse HD Audio Controller | 22 | 3.34% |
| Intel Jasper Lake HD Audio | 18 | 2.74% |
| Intel 6 Series/C200 Series Chipset Family High Definition Audio Controller | 18 | 2.74% |
| Intel Alder Lake PCH-P High Definition Audio Controller | 17 | 2.58% |
| Intel 7 Series/C216 Chipset Family High Definition Audio Controller | 17 | 2.58% |
| Intel NM10/ICH7 Family High Definition Audio Controller | 16 | 2.43% |
| Intel Tiger Lake-LP Smart Sound Technology Audio Controller | 15 | 2.28% |
| Intel Cannon Lake PCH cAVS | 12 | 1.82% |
| Intel Comet Lake PCH-LP cAVS | 11 | 1.67% |
| AMD SBx00 Azalia (Intel HDA) | 11 | 1.67% |
| Intel Alder Lake-S HD Audio Controller | 10 | 1.52% |
| AMD FCH Azalia Controller | 10 | 1.52% |
| Nvidia GK208 HDMI/DP Audio Controller | 8 | 1.22% |
| Nvidia GF108 High Definition Audio Controller | 8 | 1.22% |
| Intel 200 Series PCH HD Audio | 8 | 1.22% |
| Nvidia GP107GL High Definition Audio Controller | 7 | 1.06% |
| Intel Ice Lake-LP Smart Sound Technology Audio Controller | 7 | 1.06% |
| Intel Haswell-ULT HD Audio Controller | 7 | 1.06% |
| Intel 82801I (ICH9 Family) HD Audio Controller | 7 | 1.06% |
| Intel 8 Series HD Audio Controller | 7 | 1.06% |
| AMD Raven/Raven2/Fenghuang HDMI/DP Audio Controller | 7 | 1.06% |
| AMD Family 17h (Models 00h-0fh) HD Audio Controller | 7 | 1.06% |
| KTMicro KT USB Audio | 6 | 0.91% |
| Intel Comet Lake PCH cAVS | 6 | 0.91% |
| Intel Cannon Point-LP High Definition Audio Controller | 6 | 0.91% |
| Intel 5 Series/3400 Series Chipset High Definition Audio | 6 | 0.91% |
| Intel 100 Series/C230 Series Chipset Family HD Audio Controller | 6 | 0.91% |
| AMD Kabini HDMI/DP Audio | 6 | 0.91% |
| Nvidia GM107 High Definition Audio Controller [GeForce 940MX] | 5 | 0.76% |
| Intel Celeron/Pentium Silver Processor High Definition Audio | 5 | 0.76% |
| AMD Navi 21/23 HDMI/DP Audio Controller | 5 | 0.76% |
| Nvidia TU116 High Definition Audio Controller | 4 | 0.61% |
| Nvidia TU107 GeForce GTX 1650 High Definition Audio Controller | 4 | 0.61% |
| Nvidia GP106 High Definition Audio Controller | 4 | 0.61% |
Memory
Memory Vendor
Memory module vendors


| Vendor | Computers | Percent |
|---|---|---|
| Samsung Electronics | 94 | 20.61% |
| SK hynix | 87 | 19.08% |
| Unknown | 62 | 13.6% |
| Micron Technology | 57 | 12.5% |
| Kingston | 44 | 9.65% |
| Crucial | 25 | 5.48% |
| Corsair | 18 | 3.95% |
| G.Skill | 14 | 3.07% |
| Elpida | 8 | 1.75% |
| Ramaxel Technology | 6 | 1.32% |
| A-DATA Technology | 5 | 1.1% |
| Unknown (ABCD) | 4 | 0.88% |
| Nanya Technology | 3 | 0.66% |
| Hewlett-Packard | 3 | 0.66% |
| Unknown | 3 | 0.66% |
| Timetec | 2 | 0.44% |
| Team | 2 | 0.44% |
| Apacer | 2 | 0.44% |
| Wilk | 1 | 0.22% |
| Unknown (0x7FFF) | 1 | 0.22% |
| Unknown (0x5846) | 1 | 0.22% |
| Unknown (0x0DD5) | 1 | 0.22% |
| Unknown (0x0B45) | 1 | 0.22% |
| Unknown (0x0AFD) | 1 | 0.22% |
| Super Talent | 1 | 0.22% |
| Smart | 1 | 0.22% |
| SHARETRONIC | 1 | 0.22% |
| Ramos Technology | 1 | 0.22% |
| Qimonda | 1 | 0.22% |
| Patriot | 1 | 0.22% |
| Lenovo | 1 | 0.22% |
| Infineon | 1 | 0.22% |
| Goldkey | 1 | 0.22% |
| Chun Well Technology Holding Limited | 1 | 0.22% |
| 48spaces | 1 | 0.22% |
Memory Model
Memory module models


| Model | Computers | Percent |
|---|---|---|
| Unknown RAM Module 2GB SODIMM DDR2 800MT/s | 23 | 4.76% |
| Micron RAM Module 2GB SODIMM DDR2 800MT/s | 17 | 3.52% |
| SK hynix RAM Module 1GB SODIMM DDR2 800MT/s | 6 | 1.24% |
| SK hynix RAM HMT41GS6BFR8A-PB 8GB SODIMM DDR3 1600MT/s | 5 | 1.04% |
| Unknown RAM Module 1GB DIMM SDRAM | 4 | 0.83% |
| Unknown RAM DDR4 NB 8G 2666 8GB SODIMM DDR4 2667MT/s | 4 | 0.83% |
| Samsung RAM M471B5273DH0-CH9 4GB SODIMM DDR3 1334MT/s | 4 | 0.83% |
| Samsung RAM M471A1G44BB0-CWE 8GB SODIMM DDR4 3200MT/s | 4 | 0.83% |
| Unknown RAM Module 4GB DIMM 1333MT/s | 3 | 0.62% |
| Unknown RAM Module 2GB DIMM SDRAM | 3 | 0.62% |
| SK hynix RAM Module 4GB SODIMM DDR3 1600MT/s | 3 | 0.62% |
| SK hynix RAM HMT451S6BFR8A-PB 4GB SODIMM DDR3 1600MT/s | 3 | 0.62% |
| SK hynix RAM HMA81GS6DJR8N-XN 8GB SODIMM DDR4 3200MT/s | 3 | 0.62% |
| Samsung RAM M471B5173QH0-YK0 4GB SODIMM DDR3 1600MT/s | 3 | 0.62% |
| Samsung RAM M471B5173EB0-YK0 4GB SODIMM DDR3 1600MT/s | 3 | 0.62% |
| Samsung RAM M471A1K43EB1-CWE 8GB SODIMM DDR4 3200MT/s | 3 | 0.62% |
| Samsung RAM M471A1K43CB1-CTD 8GB SODIMM DDR4 2667MT/s | 3 | 0.62% |
| Samsung RAM M391A4G43MB1-CTD 32GB DIMM DDR4 2667MT/s | 3 | 0.62% |
| Micron RAM 18ASF2G72PZ-2G9E1 16GB DIMM DDR4 2933MT/s | 3 | 0.62% |
| Elpida RAM EBJ41UF8BCS0-DJ-F 4GB SODIMM DDR3 1334MT/s | 3 | 0.62% |
| Crucial RAM CT8G4SFS824A.M8FE 8GB SODIMM DDR4 2667MT/s | 3 | 0.62% |
| Corsair RAM CMK64GX4M2E3200C16 32GB DIMM DDR4 3200MT/s | 3 | 0.62% |
| Corsair RAM CMK16GX4M2B3200C16 8GB DIMM DDR4 3600MT/s | 3 | 0.62% |
| Unknown | 3 | 0.62% |
| Unknown RAM Module 4GB Row Of Chips LPDDR4 4267MT/s | 2 | 0.41% |
| Unknown RAM Module 4GB DIMM DDR3 1333MT/s | 2 | 0.41% |
| Unknown RAM Module 4GB DIMM 1066MT/s | 2 | 0.41% |
| Unknown RAM Module 2GB DIMM 667MT/s | 2 | 0.41% |
| Unknown RAM Module 1GB SODIMM DDR2 667MT/s | 2 | 0.41% |
| Unknown RAM Module 1GB SODIMM DDR2 | 2 | 0.41% |
| Unknown (ABCD) RAM 123456789012345678 2GB SODIMM LPDDR4 2400MT/s | 2 | 0.41% |
| Unknown (ABCD) RAM 123456789012345678 1GB DIMM DDR3 2400MT/s | 2 | 0.41% |
| SK hynix RAM Module 2GB SODIMM DDR3 1600MT/s | 2 | 0.41% |
| SK hynix RAM Module 16GB SODIMM DDR4 2667MT/s | 2 | 0.41% |
| SK hynix RAM HMT425S6AFR6A-PB 2GB SODIMM DDR3 3200MT/s | 2 | 0.41% |
| SK hynix RAM HMT41GS6AFR8A-PB 8GB SODIMM DDR3 1600MT/s | 2 | 0.41% |
| SK hynix RAM HMT351S6CFR8C-PB 4GB SODIMM DDR3 1600MT/s | 2 | 0.41% |
| SK hynix RAM HMAA1GS6CJR6N-XN 8GB SODIMM DDR4 3200MT/s | 2 | 0.41% |
| SK hynix RAM HMAA1GS6CJR6N-XN 8GB Row Of Chips DDR4 3200MT/s | 2 | 0.41% |
| SK hynix RAM HMA81GU6AFR8N-UH 8GB DIMM DDR4 2400MT/s | 2 | 0.41% |
Memory Kind
Memory module kinds


| Kind | Computers | Percent |
|---|---|---|
| DDR4 | 171 | 41.71% |
| DDR3 | 102 | 24.88% |
| DDR2 | 61 | 14.88% |
| LPDDR4 | 22 | 5.37% |
| Unknown | 17 | 4.15% |
| SDRAM | 14 | 3.41% |
| LPDDR3 | 10 | 2.44% |
| DDR5 | 10 | 2.44% |
| LPDDR5 | 3 | 0.73% |
Memory Form Factor
Physical design of the memory module


| Name | Computers | Percent |
|---|---|---|
| SODIMM | 237 | 58.09% |
| DIMM | 138 | 33.82% |
| Row Of Chips | 32 | 7.84% |
| RIMM | 1 | 0.25% |
Memory Size
Memory module size


| Size | Computers | Percent |
|---|---|---|
| 8192 | 148 | 34.42% |
| 4096 | 83 | 19.3% |
| 2048 | 83 | 19.3% |
| 16384 | 67 | 15.58% |
| 32768 | 25 | 5.81% |
| 1024 | 21 | 4.88% |
| 512 | 3 | 0.7% |
Memory Speed
Memory module speed


| Speed | Computers | Percent |
|---|---|---|
| 1600 | 73 | 16.74% |
| 3200 | 63 | 14.45% |
| 800 | 54 | 12.39% |
| 2667 | 52 | 11.93% |
| 2400 | 29 | 6.65% |
| 2133 | 22 | 5.05% |
| 1333 | 20 | 4.59% |
| 3600 | 13 | 2.98% |
| 4800 | 11 | 2.52% |
| Unknown | 11 | 2.52% |
| 4267 | 10 | 2.29% |
| 1334 | 10 | 2.29% |
| 667 | 9 | 2.06% |
| 1867 | 7 | 1.61% |
| 2933 | 6 | 1.38% |
| 1066 | 5 | 1.15% |
| 6400 | 4 | 0.92% |
| 4266 | 3 | 0.69% |
| 3733 | 3 | 0.69% |
| 2048 | 3 | 0.69% |
| 1866 | 3 | 0.69% |
| 4199 | 2 | 0.46% |
| 3534 | 2 | 0.46% |
| 3466 | 2 | 0.46% |
| 3400 | 2 | 0.46% |
| 3266 | 2 | 0.46% |
| 8400 | 1 | 0.23% |
| 6000 | 1 | 0.23% |
| 5600 | 1 | 0.23% |
| 5200 | 1 | 0.23% |
| 3800 | 1 | 0.23% |
| 3666 | 1 | 0.23% |
| 3500 | 1 | 0.23% |
| 3100 | 1 | 0.23% |
| 2666 | 1 | 0.23% |
| 2600 | 1 | 0.23% |
| 1648 | 1 | 0.23% |
| 1639 | 1 | 0.23% |
| 1067 | 1 | 0.23% |
| 975 | 1 | 0.23% |
Printers & scanners
Printer Vendor
Printer device vendors


| Vendor | Computers | Percent |
|---|---|---|
| Samsung Electronics | 3 | 23.08% |
| Hewlett-Packard | 2 | 15.38% |
| Brother Industries | 2 | 15.38% |
| Zebra | 1 | 7.69% |
| QinHeng Electronics | 1 | 7.69% |
| Printer | 1 | 7.69% |
| Lexmark International | 1 | 7.69% |
| Dymo-CoStar | 1 | 7.69% |
| Canon | 1 | 7.69% |
Printer Model
Printer device models


| Model | Computers | Percent |
|---|---|---|
| Zebra Printer | 1 | 7.69% |
| Samsung SCX-4x26 Series | 1 | 7.69% |
| Samsung ML-1660 Series | 1 | 7.69% |
| Samsung M2020 Series | 1 | 7.69% |
| QinHeng CH340S | 1 | 7.69% |
| Printer Printer | 1 | 7.69% |
| Lexmark International MS710 | 1 | 7.69% |
| HP LaserJet 1150 | 1 | 7.69% |
| HP DeskJet 2130 series | 1 | 7.69% |
| Dymo-CoStar DYMO LabelWriter DUO | 1 | 7.69% |
| Canon PIXMA MG3600 Series | 1 | 7.69% |
| Brother MFC-L2710DW series | 1 | 7.69% |
| Brother HL-L2395DW series | 1 | 7.69% |
Scanner Vendor
Scanner device vendors
Zero info for selected period =(
Scanner Model
Scanner device models
Zero info for selected period =(
Camera
Camera Vendor
Camera device vendors


| Vendor | Computers | Percent |
|---|---|---|
| Chicony Electronics | 46 | 22.12% |
| Microdia | 26 | 12.5% |
| IMC Networks | 18 | 8.65% |
| Acer | 16 | 7.69% |
| Realtek Semiconductor | 13 | 6.25% |
| Quanta | 12 | 5.77% |
| Sunplus Innovation Technology | 11 | 5.29% |
| Apple | 11 | 5.29% |
| Logitech | 10 | 4.81% |
| Suyin | 6 | 2.88% |
| Silicon Motion | 6 | 2.88% |
| Luxvisions Innotech Limited | 6 | 2.88% |
| Syntek | 4 | 1.92% |
| Lite-On Technology | 4 | 1.92% |
| Cheng Uei Precision Industry (Foxlink) | 3 | 1.44% |
| Bison Electronics | 3 | 1.44% |
| Microsoft | 2 | 0.96% |
| USB Camera | 1 | 0.48% |
| Sony Electronics | 1 | 0.48% |
| Sonix Technology | 1 | 0.48% |
| Magic Control Technology | 1 | 0.48% |
| Importek | 1 | 0.48% |
| Huawei Technologies | 1 | 0.48% |
| Generalplus Technology | 1 | 0.48% |
| BRS 2Mp Camera | 1 | 0.48% |
| Arkmicro Technologies | 1 | 0.48% |
| Alpha Imaging Technology | 1 | 0.48% |
| Alcor Micro | 1 | 0.48% |
Camera Model
Camera device models


| Model | Computers | Percent |
|---|---|---|
| Chicony Integrated Camera | 16 | 7.62% |
| Microdia Integrated_Webcam_HD | 13 | 6.19% |
| IMC Networks USB2.0 HD UVC WebCam | 7 | 3.33% |
| Apple Built-in iSight [Micron] | 6 | 2.86% |
| IMC Networks Integrated Camera | 5 | 2.38% |
| Sunplus Integrated_Webcam_HD | 4 | 1.9% |
| Chicony HP HD Camera | 4 | 1.9% |
| Realtek Integrated_Webcam_HD | 3 | 1.43% |
| Quanta HD User Facing | 3 | 1.43% |
| Microdia Integrated Webcam | 3 | 1.43% |
| Logitech HD Webcam C525 | 3 | 1.43% |
| IMC Networks USB2.0 VGA UVC WebCam | 3 | 1.43% |
| Chicony USB2.0 Camera | 3 | 1.43% |
| Chicony HD WebCam | 3 | 1.43% |
| Syntek Lenovo EasyCamera | 2 | 0.95% |
| Syntek Integrated Camera | 2 | 0.95% |
| Suyin Acer CrystalEye Webcam | 2 | 0.95% |
| Sunplus HD WebCam | 2 | 0.95% |
| Silicon Motion WebCam SCB-1100N | 2 | 0.95% |
| Realtek Integrated Webcam | 2 | 0.95% |
| Quanta HP HD Camera | 2 | 0.95% |
| Quanta HD Camera | 2 | 0.95% |
| Microdia Webcam Vitade AF | 2 | 0.95% |
| Microdia USB 2.0 Camera | 2 | 0.95% |
| Microdia Dell Integrated HD Webcam | 2 | 0.95% |
| Lite-On HP HD Camera | 2 | 0.95% |
| IMC Networks USB2.0 HD IR UVC WebCam | 2 | 0.95% |
| Chicony USB 2.0 Camera | 2 | 0.95% |
| Chicony HP Truevision HD | 2 | 0.95% |
| Chicony FJ Camera | 2 | 0.95% |
| Bison Integrated Camera | 2 | 0.95% |
| Apple iPhone 5/5C/5S/6/SE/7/8/X | 2 | 0.95% |
| Apple Built-in iSight | 2 | 0.95% |
| Acer Lenovo EasyCamera integrated webcam | 2 | 0.95% |
| Acer Lenovo EasyCamera | 2 | 0.95% |
| Acer HD Webcam | 2 | 0.95% |
| Acer BisonCam,NB Pro | 2 | 0.95% |
| Acer BisonCam, NB Pro | 2 | 0.95% |
| USB Camera USB Camera | 1 | 0.48% |
| Suyin USB 2.0 UVC 1.3M WebCam | 1 | 0.48% |
Security
Fingerprint Vendor
Fingerprint sensor vendors


| Vendor | Computers | Percent |
|---|---|---|
| Synaptics | 13 | 43.33% |
| Validity Sensors | 12 | 40% |
| Shenzhen Goodix Technology | 3 | 10% |
| Upek | 1 | 3.33% |
| Elan Microelectronics | 1 | 3.33% |
Fingerprint Model
Fingerprint sensor models


| Model | Computers | Percent |
|---|---|---|
| Synaptics Prometheus MIS Touch Fingerprint Reader | 6 | 20% |
| Validity Sensors VFS5011 Fingerprint Reader | 4 | 13.33% |
| Validity Sensors VFS 5011 fingerprint sensor | 4 | 13.33% |
| Synaptics WBDI Fingerprint Reader USB 086 | 2 | 6.67% |
| Shenzhen Goodix FingerPrint Device | 2 | 6.67% |
| Validity Sensors VFS495 Fingerprint Reader | 1 | 3.33% |
| Validity Sensors VFS471 Fingerprint Reader | 1 | 3.33% |
| Validity Sensors Synaptics WBDI | 1 | 3.33% |
| Validity Sensors Swipe Fingerprint Sensor | 1 | 3.33% |
| Upek Biometric Touchchip/Touchstrip Fingerprint Sensor | 1 | 3.33% |
| Synaptics UWP WBDI Device | 1 | 3.33% |
| Synaptics VFS7552 Touch Fingerprint Sensor with PurePrint | 1 | 3.33% |
| Synaptics Metallica MIS Touch Fingerprint Reader | 1 | 3.33% |
| Synaptics FS7604 Touch Fingerprint Sensor with PurePrint | 1 | 3.33% |
| Shenzhen Goodix FingerPrint | 1 | 3.33% |
| Elan ELAN:ARM-M4 | 1 | 3.33% |
| Unknown | 1 | 3.33% |
Chipcard Vendor
Chipcard module vendors


| Vendor | Computers | Percent |
|---|---|---|
| Broadcom | 9 | 42.86% |
| Alcor Micro | 9 | 42.86% |
| Upek | 1 | 4.76% |
| Realtek Semiconductor | 1 | 4.76% |
| O2 Micro | 1 | 4.76% |
Chipcard Model
Chipcard module models


| Model | Computers | Percent |
|---|---|---|
| Alcor Micro AU9540 Smartcard Reader | 8 | 38.1% |
| Broadcom BCM5880 Secure Applications Processor with fingerprint swipe sensor | 5 | 23.81% |
| Broadcom BCM5880 Secure Applications Processor | 3 | 14.29% |
| Upek TouchChip Fingerprint Coprocessor (WBF advanced mode) | 1 | 4.76% |
| Realtek Semiconductor Smart Card Reader Interface | 1 | 4.76% |
| O2 Micro OZ776 CCID Smartcard Reader | 1 | 4.76% |
| Broadcom 58200 | 1 | 4.76% |
| Alcor Micro Watchdata W 1981 | 1 | 4.76% |
Unsupported
Unsupported Devices
Total unsupported devices on board


| Total | Computers | Percent |
|---|---|---|
| 0 | 303 | 63.39% |
| 1 | 133 | 27.82% |
| 2 | 28 | 5.86% |
| 3 | 8 | 1.67% |
| 4 | 5 | 1.05% |
| 7 | 1 | 0.21% |
Unsupported Device Types
Types of unsupported devices


| Type | Computers | Percent |
|---|---|---|
| Graphics card | 88 | 41.31% |
| Fingerprint reader | 30 | 14.08% |
| Net/wireless | 20 | 9.39% |
| Communication controller | 18 | 8.45% |
| Chipcard | 18 | 8.45% |
| Unassigned class | 13 | 6.1% |
| Multimedia controller | 9 | 4.23% |
| Sound | 5 | 2.35% |
| Camera | 4 | 1.88% |
| Bluetooth | 4 | 1.88% |
| Storage | 3 | 1.41% |
| Card reader | 1 | 0.47% |