SteamOS - Hardware Trends
A project to identify most popular hardware characteristics and track their change over time based on data collected by Linux users at https://Linux-Hardware.org.
Anyone can contribute to this report by the hw-probe tool:
sudo -E hw-probe -all -uploadThis is a report for all computer types. See also reports for desktops and notebooks.
This report is for one last month. Overall report since the beginning of time: TestCoverage
Period: Dec, 2022.
Contents
System
OS
Installed operating systems


| Name | Computers | Percent |
|---|---|---|
| SteamOS 3.3.2 | 26 | 26.26% |
| SteamOS 3.4.2 | 21 | 21.21% |
| SteamOS 3.4 | 14 | 14.14% |
| SteamOS 3.3.3 | 14 | 14.14% |
| SteamOS 3.4.4 | 10 | 10.1% |
| SteamOS 3.4.3 | 7 | 7.07% |
| SteamOS 3.5 | 2 | 2.02% |
| SteamOS 3.1 | 2 | 2.02% |
| SteamOS Rolling | 1 | 1.01% |
| SteamOS 4 | 1 | 1.01% |
| SteamOS | 1 | 1.01% |
OS Family
OS without a version


| Name | Computers | Percent |
|---|---|---|
| SteamOS | 99 | 100% |
Kernel
Version of the Linux kernel


| Version | Computers | Percent |
|---|---|---|
| 5.13.0-valve21.3-1-neptune | 49 | 49.49% |
| 5.13.0-valve36-1-neptune | 38 | 38.38% |
| 5.13.0-valve35-1-neptune | 9 | 9.09% |
| 5.13.0-valve10.3-1-neptune-02176-g5fe416c4acd8 | 2 | 2.02% |
| 5.15.79-1-lts | 1 | 1.01% |
Kernel Family
Linux kernel without a distro release


| Version | Computers | Percent |
|---|---|---|
| 5.13.0 | 98 | 98.99% |
| 5.15.79 | 1 | 1.01% |
Kernel Major Ver.
Linux kernel major version


| Version | Computers | Percent |
|---|---|---|
| 5.13 | 98 | 98.99% |
| 5.15 | 1 | 1.01% |
Arch
OS architecture (x86_64, i586, etc.)


| Name | Computers | Percent |
|---|---|---|
| x86_64 | 99 | 100% |
DE
Desktop Environment


| Name | Computers | Percent |
|---|---|---|
| KDE5 | 99 | 100% |
Display Server
X11 or Wayland


| Name | Computers | Percent |
|---|---|---|
| X11 | 99 | 100% |
Display Manager
SDDM, LightDM, etc.


| Name | Computers | Percent |
|---|---|---|
| Unknown | 98 | 98.99% |
| SDDM | 1 | 1.01% |
OS Lang
Language


| Lang | Computers | Percent |
|---|---|---|
| en_US | 82 | 82.83% |
| de_DE | 5 | 5.05% |
| ru_RU | 2 | 2.02% |
| en_GB | 2 | 2.02% |
| nl_BE | 1 | 1.01% |
| ksh_DE | 1 | 1.01% |
| it_IT | 1 | 1.01% |
| hr_HR | 1 | 1.01% |
| fr_FR | 1 | 1.01% |
| es_MX | 1 | 1.01% |
| es_ES | 1 | 1.01% |
| en_DE | 1 | 1.01% |
Boot Mode
EFI or BIOS


| Mode | Computers | Percent |
|---|---|---|
| BIOS | 98 | 98.99% |
| EFI | 1 | 1.01% |
Filesystem
Type of filesystem


| Type | Computers | Percent |
|---|---|---|
| Btrfs | 99 | 100% |
Part. scheme
Scheme of partitioning


| Type | Computers | Percent |
|---|---|---|
| Unknown | 98 | 98.99% |
| GPT | 1 | 1.01% |
Dual Boot with Linux/BSD
Hosting more than one Linux/BSD


| Dual boot | Computers | Percent |
|---|---|---|
| No | 98 | 98.99% |
| Yes | 1 | 1.01% |
Dual Boot (Win)
Hosting Linux and Windows


| Dual boot | Computers | Percent |
|---|---|---|
| No | 99 | 100% |
Board
Vendor
Motherboard manufacturer


| Name | Computers | Percent |
|---|---|---|
| Valve | 87 | 87.88% |
| ASUSTek Computer | 6 | 6.06% |
| Teclast | 1 | 1.01% |
| GPU Company | 1 | 1.01% |
| Dell | 1 | 1.01% |
| ASRock | 1 | 1.01% |
| Apple | 1 | 1.01% |
| Anbernic | 1 | 1.01% |
Model
Motherboard model


| Name | Computers | Percent |
|---|---|---|
| Valve Jupiter | 87 | 87.88% |
| Teclast TbooK 16 Power | 1 | 1.01% |
| GPU Company GWNR71517 | 1 | 1.01% |
| Dell OptiPlex 9020 | 1 | 1.01% |
| ASUS Z170 PRO GAMING | 1 | 1.01% |
| ASUS TUF Gaming B550M-PLUS | 1 | 1.01% |
| ASUS ROG CROSSHAIR VIII HERO | 1 | 1.01% |
| ASUS PRIME B450M-A II | 1 | 1.01% |
| ASUS N56VB | 1 | 1.01% |
| ASUS M80CJ-O | 1 | 1.01% |
| ASRock X570 Phantom Gaming-ITX/TB3 | 1 | 1.01% |
| Apple Macmini7,1 | 1 | 1.01% |
| Anbernic Win600 | 1 | 1.01% |
Model Family
Motherboard model prefix


| Name | Computers | Percent |
|---|---|---|
| Valve Jupiter | 87 | 87.88% |
| Teclast TbooK | 1 | 1.01% |
| GPU Company GWNR71517 | 1 | 1.01% |
| Dell OptiPlex | 1 | 1.01% |
| ASUS Z170 | 1 | 1.01% |
| ASUS TUF | 1 | 1.01% |
| ASUS ROG | 1 | 1.01% |
| ASUS PRIME | 1 | 1.01% |
| ASUS N56VB | 1 | 1.01% |
| ASUS M80CJ-O | 1 | 1.01% |
| ASRock X570 | 1 | 1.01% |
| Apple Macmini7 | 1 | 1.01% |
| Anbernic Win600 | 1 | 1.01% |
MFG Year
Motherboard manufacture year


| Year | Computers | Percent |
|---|---|---|
| 2022 | 90 | 90.91% |
| 2015 | 3 | 3.03% |
| 2020 | 2 | 2.02% |
| 2021 | 1 | 1.01% |
| 2018 | 1 | 1.01% |
| 2017 | 1 | 1.01% |
| 2013 | 1 | 1.01% |
Form Factor
Physical design of the computer


| Name | Computers | Percent |
|---|---|---|
| Notebook | 91 | 91.92% |
| Desktop | 6 | 6.06% |
| Tablet | 1 | 1.01% |
| Mini pc | 1 | 1.01% |
Secure Boot
Enabled or disabled


| State | Computers | Percent |
|---|---|---|
| Disabled | 99 | 100% |
Coreboot
Have coreboot on board


| Used | Computers | Percent |
|---|---|---|
| No | 99 | 100% |
RAM Size
Total RAM memory


| Size in GB | Computers | Percent |
|---|---|---|
| 8.01-16.0 | 89 | 89.9% |
| 4.01-8.0 | 4 | 4.04% |
| 16.01-24.0 | 3 | 3.03% |
| 32.01-64.0 | 2 | 2.02% |
| 64.01-256.0 | 1 | 1.01% |
RAM Used
Used RAM memory


| Used GB | Computers | Percent |
|---|---|---|
| 2.01-3.0 | 48 | 48.48% |
| 3.01-4.0 | 23 | 23.23% |
| 4.01-8.0 | 16 | 16.16% |
| 1.01-2.0 | 10 | 10.1% |
| 8.01-16.0 | 2 | 2.02% |
Total Drives
Number of drives on board


| Drives | Computers | Percent |
|---|---|---|
| 2 | 53 | 53.54% |
| 1 | 36 | 36.36% |
| 3 | 9 | 9.09% |
| 4 | 1 | 1.01% |
Has CD-ROM
Has CD-ROM on board


| Presented | Computers | Percent |
|---|---|---|
| No | 96 | 96.97% |
| Yes | 3 | 3.03% |
Has Ethernet
Has Ethernet on board


| Presented | Computers | Percent |
|---|---|---|
| No | 58 | 58.59% |
| Yes | 41 | 41.41% |
Has WiFi
Has WiFi module


| Presented | Computers | Percent |
|---|---|---|
| Yes | 96 | 96.97% |
| No | 3 | 3.03% |
Has Bluetooth
Has Bluetooth module


| Presented | Computers | Percent |
|---|---|---|
| Yes | 96 | 96.97% |
| No | 3 | 3.03% |
Location
Country
Geographic location (country)


| Country | Computers | Percent |
|---|---|---|
| USA | 42 | 42.42% |
| Germany | 14 | 14.14% |
| UK | 9 | 9.09% |
| Spain | 4 | 4.04% |
| France | 4 | 4.04% |
| Brazil | 3 | 3.03% |
| Sweden | 2 | 2.02% |
| Russia | 2 | 2.02% |
| Netherlands | 2 | 2.02% |
| Mexico | 2 | 2.02% |
| Denmark | 2 | 2.02% |
| Bulgaria | 2 | 2.02% |
| Belgium | 2 | 2.02% |
| Vietnam | 1 | 1.01% |
| UAE | 1 | 1.01% |
| Switzerland | 1 | 1.01% |
| South Korea | 1 | 1.01% |
| Poland | 1 | 1.01% |
| Italy | 1 | 1.01% |
| Finland | 1 | 1.01% |
| Chile | 1 | 1.01% |
| Canada | 1 | 1.01% |
City
Geographic location (city)


| City | Computers | Percent |
|---|---|---|
| Los Angeles | 2 | 2.02% |
| London | 2 | 2.02% |
| Kansas City | 2 | 2.02% |
| Cologne | 2 | 2.02% |
| Wyoming | 1 | 1.01% |
| Wyandotte | 1 | 1.01% |
| Wolverhampton | 1 | 1.01% |
| Watford | 1 | 1.01% |
| Villeurbanne | 1 | 1.01% |
| Varna | 1 | 1.01% |
| Vacaville | 1 | 1.01% |
| Troisdorf | 1 | 1.01% |
| Syracuse | 1 | 1.01% |
| Susanville | 1 | 1.01% |
| Straengnaes | 1 | 1.01% |
| Stockholm | 1 | 1.01% |
| St Petersburg | 1 | 1.01% |
| Sofia | 1 | 1.01% |
| Smyrna | 1 | 1.01% |
| Sint-Truiden | 1 | 1.01% |
| Seattle | 1 | 1.01% |
| Schoten | 1 | 1.01% |
| Sao Paulo | 1 | 1.01% |
| Santiago | 1 | 1.01% |
| San Antonio | 1 | 1.01% |
| Salem | 1 | 1.01% |
| Rotterdam | 1 | 1.01% |
| River Grove | 1 | 1.01% |
| Richmond | 1 | 1.01% |
| Reading | 1 | 1.01% |
| Queimados | 1 | 1.01% |
| Poway | 1 | 1.01% |
| Pierre | 1 | 1.01% |
| Perris | 1 | 1.01% |
| Oconomowoc | 1 | 1.01% |
| Novosibirsk | 1 | 1.01% |
| North Kingstown | 1 | 1.01% |
| Norfolk | 1 | 1.01% |
| Nispen | 1 | 1.01% |
| Neuilly-sur-Marne | 1 | 1.01% |
Drives
Drive Vendor
Hard drive vendors


| Vendor | Computers | Drives | Percent |
|---|---|---|---|
| Unknown | 47 | 49 | 27.01% |
| Kingston Technology Company | 24 | 24 | 13.79% |
| Samsung Electronics | 22 | 23 | 12.64% |
| Phison Electronics | 19 | 19 | 10.92% |
| O2 Micro | 16 | 16 | 9.2% |
| Unknown | 14 | 14 | 8.05% |
| Sandisk | 5 | 5 | 2.87% |
| Seagate | 3 | 4 | 1.72% |
| KIOXIA | 3 | 3 | 1.72% |
| SK hynix | 2 | 2 | 1.15% |
| Silicon Motion | 2 | 2 | 1.15% |
| Kingston | 2 | 2 | 1.15% |
| Crucial | 2 | 2 | 1.15% |
| Apple | 2 | 2 | 1.15% |
| A-DATA Technology | 2 | 2 | 1.15% |
| W800S | 1 | 1 | 0.57% |
| Toshiba | 1 | 1 | 0.57% |
| Solid State Storage Technology | 1 | 1 | 0.57% |
| Realtek | 1 | 1 | 0.57% |
| PNY | 1 | 1 | 0.57% |
| MAXIO Technology (Hangzhou) | 1 | 1 | 0.57% |
| KingSpec | 1 | 1 | 0.57% |
| JMicron Technology | 1 | 1 | 0.57% |
| Intenso | 1 | 1 | 0.57% |
Drive Model
Hard drive models


| Model | Computers | Percent |
|---|---|---|
| Kingston Company OM3PDP3 NVMe SSD 512GB | 23 | 12.99% |
| Unknown MMC Card 512GB | 22 | 12.43% |
| Phison PS5013 E13 NVMe Controller 512GB | 18 | 10.17% |
| O2 Micro E2M2 64GB | 16 | 9.04% |
| Unknown | 14 | 7.91% |
| Unknown MMC Card 256GB | 11 | 6.21% |
| Samsung MZ9LQ512HBLU-00BVL 512GB | 9 | 5.08% |
| Unknown MMC Card 128GB | 6 | 3.39% |
| Samsung MZ9LQ256HBJD-00BVL 256GB | 6 | 3.39% |
| Unknown MMC Card 393GB | 3 | 1.69% |
| Unknown MMC Card 64GB | 2 | 1.13% |
| SK hynix BC711 NVMe 256GB | 2 | 1.13% |
| Silicon Motion SM2263EN/SM2263XT SSD Controller 1024GB | 2 | 1.13% |
| Sandisk WDC PC SN530 SDBPTPZ-1T00 1024GB | 2 | 1.13% |
| Crucial CT1000BX500SSD1 1TB | 2 | 1.13% |
| Apple HDD HTS541010A9E662 1TB | 2 | 1.13% |
| W800S 256GB | 1 | 0.56% |
| Unknown MMC Card 500GB | 1 | 0.56% |
| Unknown MMC Card 32GB | 1 | 0.56% |
| Unknown MMC Card 30MB | 1 | 0.56% |
| Unknown MMC Card 249GB | 1 | 0.56% |
| Unknown MMC Card 1073GB | 1 | 0.56% |
| Toshiba MQ01ABD100 1TB | 1 | 0.56% |
| Solid State Storage SSSTC XA1-311024 930GB | 1 | 0.56% |
| Seagate ST1000LM048-2E7172 1TB | 1 | 0.56% |
| Seagate ST1000DM010-2EP102 1TB | 1 | 0.56% |
| Seagate BUP Slim 2TB | 1 | 0.56% |
| Sandisk WD_BLACK SN750 SE 1TB | 1 | 0.56% |
| Sandisk PC SN530 NVMe WDC 256GB | 1 | 0.56% |
| SanDisk Extreme Pro 55AF 2TB SSD | 1 | 0.56% |
| Samsung SSD 970 EVO Plus 1TB | 1 | 0.56% |
| Samsung SSD 860 EVO M.2 500GB | 1 | 0.56% |
| Samsung PSSD T7 1TB | 1 | 0.56% |
| Samsung Portable SSD T5 500GB | 1 | 0.56% |
| Samsung PM991a NVMe 512GB | 1 | 0.56% |
| Samsung NVMe SSD Controller SM981/PM981/PM983 500GB | 1 | 0.56% |
| Samsung MZALQ128HBHQ-000L2 128GB | 1 | 0.56% |
| Samsung MZ9LQ1T0HBLB-00B 1024GB | 1 | 0.56% |
| Realtek RTL9210B-CG 1TB | 1 | 0.56% |
| PNY ELITE PSSD 480GB | 1 | 0.56% |
HDD Vendor
Hard disk drive vendors


| Vendor | Computers | Drives | Percent |
|---|---|---|---|
| Seagate | 3 | 4 | 50% |
| Apple | 2 | 2 | 33.33% |
| Toshiba | 1 | 1 | 16.67% |
SSD Vendor
Solid state drive vendors


| Vendor | Computers | Drives | Percent |
|---|---|---|---|
| Samsung Electronics | 3 | 4 | 30% |
| Crucial | 2 | 2 | 20% |
| SanDisk | 1 | 1 | 10% |
| PNY | 1 | 1 | 10% |
| Kingston | 1 | 1 | 10% |
| KingSpec | 1 | 1 | 10% |
| Intenso | 1 | 1 | 10% |
Drive Kind
HDD or SSD


| Kind | Computers | Drives | Percent |
|---|---|---|---|
| NVMe | 91 | 95 | 53.53% |
| MMC | 61 | 63 | 35.88% |
| SSD | 10 | 11 | 5.88% |
| HDD | 6 | 7 | 3.53% |
| Unknown | 2 | 2 | 1.18% |
Drive Connector
SATA, SAS, NVMe, etc.


| Type | Computers | Drives | Percent |
|---|---|---|---|
| NVMe | 91 | 94 | 53.22% |
| MMC | 61 | 63 | 35.67% |
| SATA | 11 | 13 | 6.43% |
| SAS | 8 | 8 | 4.68% |
Drive Size
Size of hard drive


| Size in TB | Computers | Drives | Percent |
|---|---|---|---|
| 0.51-1.0 | 10 | 12 | 66.67% |
| 0.01-0.5 | 3 | 4 | 20% |
| 1.01-2.0 | 2 | 2 | 13.33% |
Space Total
Amount of disk space available on the file system


| Size in GB | Computers | Percent |
|---|---|---|
| 251-500 | 39 | 39.39% |
| 101-250 | 28 | 28.28% |
| 51-100 | 14 | 14.14% |
| 501-1000 | 10 | 10.1% |
| 1001-2000 | 6 | 6.06% |
| More than 3000 | 2 | 2.02% |
Space Used
Amount of used disk space


| Used GB | Computers | Percent |
|---|---|---|
| 101-250 | 31 | 31.31% |
| 251-500 | 26 | 26.26% |
| 21-50 | 18 | 18.18% |
| 51-100 | 10 | 10.1% |
| 1-20 | 8 | 8.08% |
| 501-1000 | 5 | 5.05% |
| More than 3000 | 1 | 1.01% |
Malfunc. Drives
Drive models with a malfunction
Zero info for selected period =(
Malfunc. Drive Vendor
Vendors of faulty drives
Zero info for selected period =(
Malfunc. HDD Vendor
Vendors of faulty HDD drives
Zero info for selected period =(
Malfunc. Drive Kind
Kinds of faulty drives
Zero info for selected period =(
Failed Drives
Failed drive models
Zero info for selected period =(
Failed Drive Vendor
Failed drive vendors
Zero info for selected period =(
Drive Status
Number of failed and malfunc. drives


| Status | Computers | Drives | Percent |
|---|---|---|---|
| Detected | 99 | 177 | 99% |
| Works | 1 | 1 | 1% |
Storage controller
Storage Vendor
Storage controller vendors


| Vendor | Computers | Percent |
|---|---|---|
| Kingston Technology Company | 25 | 23.81% |
| Samsung Electronics | 19 | 18.1% |
| Phison Electronics | 19 | 18.1% |
| O2 Micro | 16 | 15.24% |
| AMD | 6 | 5.71% |
| Intel | 5 | 4.76% |
| SanDisk | 4 | 3.81% |
| KIOXIA | 3 | 2.86% |
| SK hynix | 2 | 1.9% |
| Silicon Motion | 2 | 1.9% |
| ADATA Technology | 2 | 1.9% |
| Solid State Storage Technology | 1 | 0.95% |
| MAXIO Technology (Hangzhou) | 1 | 0.95% |
Storage Model
Storage controller models


| Model | Computers | Percent |
|---|---|---|
| Kingston Company OM3PDP3 NVMe SSD | 23 | 21.7% |
| Samsung NVMe SSD Controller 980 | 18 | 16.98% |
| Phison PS5013 E13 NVMe Controller | 18 | 16.98% |
| O2 Micro Non-Volatile memory controller | 16 | 15.09% |
| SanDisk Non-Volatile memory controller | 4 | 3.77% |
| AMD FCH SATA Controller [AHCI mode] | 4 | 3.77% |
| SK hynix Gold P31/PC711 NVMe Solid State Drive | 2 | 1.89% |
| Silicon Motion SM2263EN/SM2263XT SSD Controller | 2 | 1.89% |
| KIOXIA NVMe SSD Controller BG4 | 2 | 1.89% |
| ADATA Non-Volatile memory controller | 2 | 1.89% |
| Solid State Storage Non-Volatile memory controller | 1 | 0.94% |
| Samsung NVMe SSD Controller SM981/PM981/PM983 | 1 | 0.94% |
| Phison NVMe Storage Controller | 1 | 0.94% |
| MAXIO (Hangzhou) NVMe SSD Controller MAP1202 | 1 | 0.94% |
| KIOXIA Non-Volatile memory controller | 1 | 0.94% |
| Kingston Company Company Non-Volatile memory controller | 1 | 0.94% |
| Kingston Company SNVS2000G [NV1 NVMe PCIe SSD 2TB] | 1 | 0.94% |
| Intel Q170/Q150/B150/H170/H110/Z170/CM236 Chipset SATA Controller [AHCI Mode] | 1 | 0.94% |
| Intel HM170/QM170 Chipset SATA Controller [AHCI Mode] | 1 | 0.94% |
| Intel 8 Series/C220 Series Chipset Family 6-port SATA Controller 1 [AHCI mode] | 1 | 0.94% |
| Intel 8 Series SATA Controller 1 [AHCI mode] | 1 | 0.94% |
| Intel 7 Series Chipset Family 6-port SATA Controller [AHCI mode] | 1 | 0.94% |
| AMD RS690 PCI to PCI Bridge (PCI Express Port 2) | 1 | 0.94% |
| AMD 500 Series Chipset SATA Controller | 1 | 0.94% |
| AMD 400 Series Chipset SATA Controller | 1 | 0.94% |
Storage Kind
Kind of storage controller (IDE, SATA, NVMe, SAS, ...)


| Kind | Computers | Percent |
|---|---|---|
| NVMe | 91 | 89.22% |
| SATA | 10 | 9.8% |
| RAID | 1 | 0.98% |
Processor
CPU Vendor
Processor vendors


| Vendor | Computers | Percent |
|---|---|---|
| AMD | 93 | 93.94% |
| Intel | 6 | 6.06% |
CPU Model
Processor models


| Model | Computers | Percent |
|---|---|---|
| AMD Custom APU 0405 | 87 | 87.88% |
| AMD Ryzen 9 5900X 12-Core Processor | 2 | 2.02% |
| Intel Core i7-6700K CPU @ 4.00GHz | 1 | 1.01% |
| Intel Core i5-7300HQ CPU @ 2.50GHz | 1 | 1.01% |
| Intel Core i5-4590S CPU @ 3.00GHz | 1 | 1.01% |
| Intel Core i5-4278U CPU @ 2.60GHz | 1 | 1.01% |
| Intel Core i5-3230M CPU @ 2.60GHz | 1 | 1.01% |
| Intel Atom x7-Z8750 CPU @ 1.60GHz | 1 | 1.01% |
| AMD Ryzen 7 PRO 5750G with Radeon Graphics | 1 | 1.01% |
| AMD Ryzen 7 3700U with Radeon Vega Mobile Gfx | 1 | 1.01% |
| AMD Ryzen 5 5600G with Radeon Graphics | 1 | 1.01% |
| AMD Athlon Silver 3050e with Radeon Graphics | 1 | 1.01% |
CPU Model Family
Processor model prefix


| Model | Computers | Percent |
|---|---|---|
| Other | 87 | 87.88% |
| Intel Core i5 | 4 | 4.04% |
| AMD Ryzen 9 | 2 | 2.02% |
| Intel Core i7 | 1 | 1.01% |
| Intel Atom | 1 | 1.01% |
| AMD Ryzen 7 PRO | 1 | 1.01% |
| AMD Ryzen 7 | 1 | 1.01% |
| AMD Ryzen 5 | 1 | 1.01% |
| AMD Athlon | 1 | 1.01% |
CPU Cores
Number of processor cores


| Number | Computers | Percent |
|---|---|---|
| 4 | 92 | 92.93% |
| 2 | 3 | 3.03% |
| 12 | 2 | 2.02% |
| 8 | 1 | 1.01% |
| 6 | 1 | 1.01% |
CPU Sockets
Number of sockets


| Number | Computers | Percent |
|---|---|---|
| 1 | 99 | 100% |
CPU Threads
Threads per core (Hyper-Threading)


| Number | Computers | Percent |
|---|---|---|
| 2 | 95 | 95.96% |
| 1 | 4 | 4.04% |
CPU Op-Modes
CPU Operation Modes (32-bit, 64-bit)


| Op mode | Computers | Percent |
|---|---|---|
| 32-bit, 64-bit | 99 | 100% |
CPU Microcode
Microcode number


| Number | Computers | Percent |
|---|---|---|
| Unknown | 98 | 98.99% |
| 0x08900201 | 1 | 1.01% |
CPU Microarch
Microarchitecture


| Name | Computers | Percent |
|---|---|---|
| Unknown | 87 | 87.88% |
| Zen 3 | 4 | 4.04% |
| Haswell | 2 | 2.02% |
| Zen+ | 1 | 1.01% |
| Zen | 1 | 1.01% |
| Skylake | 1 | 1.01% |
| Silvermont | 1 | 1.01% |
| KabyLake | 1 | 1.01% |
| IvyBridge | 1 | 1.01% |
Graphics
GPU Vendor
Vendors of graphics cards


| Vendor | Computers | Percent |
|---|---|---|
| AMD | 91 | 90.1% |
| Nvidia | 5 | 4.95% |
| Intel | 5 | 4.95% |
GPU Model
Graphics card models


| Model | Computers | Percent |
|---|---|---|
| AMD VanGogh [AMD Custom GPU 0405] | 87 | 86.14% |
| AMD Picasso/Raven 2 [Radeon Vega Series / Radeon Vega Mobile Series] | 2 | 1.98% |
| Nvidia GP106 [GeForce GTX 1060 3GB] | 1 | 0.99% |
| Nvidia GK107M [GeForce GT 740M] | 1 | 0.99% |
| Nvidia GA106 [GeForce RTX 3060 Lite Hash Rate] | 1 | 0.99% |
| Nvidia GA104 [GeForce RTX 3070 Ti] | 1 | 0.99% |
| Nvidia GA104 [GeForce RTX 3060] | 1 | 0.99% |
| Intel Xeon E3-1200 v3/4th Gen Core Processor Integrated Graphics Controller | 1 | 0.99% |
| Intel HD Graphics 530 | 1 | 0.99% |
| Intel Haswell-ULT Integrated Graphics Controller | 1 | 0.99% |
| Intel Atom/Celeron/Pentium Processor x5-E8000/J3xxx/N3xxx Integrated Graphics Controller | 1 | 0.99% |
| Intel 3rd Gen Core processor Graphics Controller | 1 | 0.99% |
| AMD Navi 23 [Radeon RX 6600/6600 XT/6600M] | 1 | 0.99% |
| AMD Navi 22 [Radeon RX 6700/6700 XT/6750 XT / 6800M] | 1 | 0.99% |
GPU Combo
Combinations of graphics cards


| Name | Computers | Percent |
|---|---|---|
| 1 x AMD | 91 | 91.92% |
| 1 x Nvidia | 4 | 4.04% |
| 1 x Intel | 3 | 3.03% |
| Intel + Nvidia | 1 | 1.01% |
GPU Driver
Free vs proprietary


| Driver | Computers | Percent |
|---|---|---|
| Free | 96 | 96.97% |
| Proprietary | 3 | 3.03% |
GPU Memory
Total video memory


| Size in GB | Computers | Percent |
|---|---|---|
| Unknown | 95 | 95.96% |
| 7.01-8.0 | 1 | 1.01% |
| 2.01-3.0 | 1 | 1.01% |
| 8.01-16.0 | 1 | 1.01% |
| 0.51-1.0 | 1 | 1.01% |
Monitor
Monitor Vendor
Monitor vendors


| Vendor | Computers | Percent |
|---|---|---|
| Valve | 48 | 37.21% |
| Analogix | 41 | 31.78% |
| Samsung Electronics | 6 | 4.65% |
| Dell | 5 | 3.88% |
| Hewlett-Packard | 3 | 2.33% |
| ViewSonic | 2 | 1.55% |
| Lenovo | 2 | 1.55% |
| Insignia | 2 | 1.55% |
| BenQ | 2 | 1.55% |
| AOC | 2 | 1.55% |
| Ancor Communications | 2 | 1.55% |
| Acer | 2 | 1.55% |
| SGT | 1 | 0.78% |
| RTK | 1 | 0.78% |
| Pixio | 1 | 0.78% |
| LG Display | 1 | 0.78% |
| INNOCN | 1 | 0.78% |
| Huion | 1 | 0.78% |
| Hitachi | 1 | 0.78% |
| Goldstar | 1 | 0.78% |
| Elgato | 1 | 0.78% |
| Element | 1 | 0.78% |
| ASUSTek Computer | 1 | 0.78% |
| Arzopa | 1 | 0.78% |
Monitor Model
Monitor models


| Model | Computers | Percent |
|---|---|---|
| Valve ANX7530 U VLV3001 800x1280 100x150mm 7.1-inch | 48 | 36.64% |
| Analogix ANX7530 U ANX7539 800x1280 | 41 | 31.3% |
| ViewSonic VX2758 Series VSC35DD 1920x1080 597x336mm 27.0-inch | 1 | 0.76% |
| ViewSonic VX2452 Series VSCDE2E 1920x1080 521x293mm 23.5-inch | 1 | 0.76% |
| SGT MDS-133F02 SGT6DB6 1920x1080 294x166mm 13.3-inch | 1 | 0.76% |
| Samsung Electronics S34J55x SAM0F70 3440x1440 797x333mm 34.0-inch | 1 | 0.76% |
| Samsung Electronics LS27AG55x SAM71E0 2560x1440 597x336mm 27.0-inch | 1 | 0.76% |
| Samsung Electronics LCD Monitor SAM7017 3840x2160 1872x1053mm 84.6-inch | 1 | 0.76% |
| Samsung Electronics LCD Monitor SAM0F9F 3840x2160 1872x1053mm 84.6-inch | 1 | 0.76% |
| Samsung Electronics LCD Monitor SAM0F14 3840x2160 950x540mm 43.0-inch | 1 | 0.76% |
| Samsung Electronics LC24RG50 SAM0F90 1920x1080 532x304mm 24.1-inch | 1 | 0.76% |
| RTK 7911D RTK2A3B 720x1280 720x1280mm 57.8-inch | 1 | 0.76% |
| Pixio UG30 WAM3000 2560x1080 597x336mm 27.0-inch | 1 | 0.76% |
| LG Display LCD Monitor LGD02D9 1920x1080 344x194mm 15.5-inch | 1 | 0.76% |
| Lenovo LT1952p Wide LEN0990 1440x900 408x255mm 18.9-inch | 1 | 0.76% |
| Lenovo LEN T24d-10 LEN61B4 1920x1200 518x324mm 24.1-inch | 1 | 0.76% |
| Insignia TV BBY5813 3840x2160 800x450mm 36.1-inch | 1 | 0.76% |
| Insignia 48DR420NA16 BBY3253 1920x1080 1054x591mm 47.6-inch | 1 | 0.76% |
| INNOCN 15A1F IOC1560 1920x1080 344x193mm 15.5-inch | 1 | 0.76% |
| Huion Kamvas 13 HAT1330 1920x1080 294x165mm 13.3-inch | 1 | 0.76% |
| Hitachi HISENSE HEC002F 3840x2160 1872x1053mm 84.6-inch | 1 | 0.76% |
| Hewlett-Packard X27q HPN3725 2560x1440 597x336mm 27.0-inch | 1 | 0.76% |
| Hewlett-Packard vf15 HWP2608 1024x768 300x220mm 14.6-inch | 1 | 0.76% |
| Hewlett-Packard L1740 HWP2648 1280x1024 338x270mm 17.0-inch | 1 | 0.76% |
| Hewlett-Packard 24o HPN337C 1920x1080 531x299mm 24.0-inch | 1 | 0.76% |
| Goldstar 27GN7 GSM5B8D 1920x1080 600x303mm 26.5-inch | 1 | 0.76% |
| Elgato Elgato EGA0001 1920x1080 708x398mm 32.0-inch | 1 | 0.76% |
| Element E2SW3918 E2SW3918 ELE6308 1366x768 1365x768mm 61.7-inch | 1 | 0.76% |
| Dell U2211H DEL405F 1920x1080 475x267mm 21.5-inch | 1 | 0.76% |
| Dell S2817Q DEL40EF 3840x2160 621x341mm 27.9-inch | 1 | 0.76% |
| Dell S2721DS DELA19D 2560x1440 597x336mm 27.0-inch | 1 | 0.76% |
| Dell S2721DGF DEL41DA 2560x1440 597x336mm 27.0-inch | 1 | 0.76% |
| Dell S2417DG DELA0E6 2560x1440 527x296mm 23.8-inch | 1 | 0.76% |
| BenQ GW2780 BNQ78E6 1920x1080 600x340mm 27.2-inch | 1 | 0.76% |
| BenQ G2320HDBL BNQ78B3 1920x1080 510x287mm 23.0-inch | 1 | 0.76% |
| ASUSTek Computer MB16AC AUS1641 1920x1080 344x194mm 15.5-inch | 1 | 0.76% |
| Arzopa ARZOPA GBR0156 1920x1080 345x194mm 15.6-inch | 1 | 0.76% |
| AOC Q32G1WG4 AOC3201 2560x1440 697x393mm 31.5-inch | 1 | 0.76% |
| AOC 27V2G5 AOC2702 1920x1080 598x336mm 27.0-inch | 1 | 0.76% |
| AOC 2460G5 AOC246A 1920x1080 531x299mm 24.0-inch | 1 | 0.76% |
Monitor Resolution
Monitor screen resolution


| Resolution | Computers | Percent |
|---|---|---|
| 800x1280 | 87 | 68.5% |
| 1920x1080 (FHD) | 21 | 16.54% |
| 3840x2160 (4K) | 9 | 7.09% |
| 2560x1440 (QHD) | 5 | 3.94% |
| 3440x1440 | 1 | 0.79% |
| 2560x1080 | 1 | 0.79% |
| 1440x900 (WXGA+) | 1 | 0.79% |
| 1280x1024 (SXGA) | 1 | 0.79% |
| 1024x768 (XGA) | 1 | 0.79% |
Monitor Diagonal
Diagonal size in inches


| Inches | Computers | Percent |
|---|---|---|
| 7 | 48 | 37.21% |
| Unknown | 41 | 31.78% |
| 27 | 9 | 6.98% |
| 15 | 5 | 3.88% |
| 84 | 4 | 3.1% |
| 24 | 4 | 3.1% |
| 21 | 4 | 3.1% |
| 23 | 3 | 2.33% |
| 61 | 1 | 0.78% |
| 57 | 1 | 0.78% |
| 47 | 1 | 0.78% |
| 36 | 1 | 0.78% |
| 34 | 1 | 0.78% |
| 32 | 1 | 0.78% |
| 31 | 1 | 0.78% |
| 19 | 1 | 0.78% |
| 17 | 1 | 0.78% |
| 14 | 1 | 0.78% |
| 13 | 1 | 0.78% |
Monitor Width
Physical width


| Width in mm | Computers | Percent |
|---|---|---|
| 1-100 | 48 | 37.5% |
| Unknown | 41 | 32.03% |
| 501-600 | 13 | 10.16% |
| 301-350 | 6 | 4.69% |
| 401-500 | 5 | 3.91% |
| 701-800 | 4 | 3.13% |
| 1501-2000 | 4 | 3.13% |
| 601-700 | 3 | 2.34% |
| 201-300 | 2 | 1.56% |
| 1001-1500 | 2 | 1.56% |
Aspect Ratio
Proportional relationship between the width and the height


| Ratio | Computers | Percent |
|---|---|---|
| 0.67 | 48 | 37.5% |
| 0.62 | 41 | 32.03% |
| 16/9 | 32 | 25% |
| 16/10 | 3 | 2.34% |
| 5/4 | 1 | 0.78% |
| 4/3 | 1 | 0.78% |
| 21/9 | 1 | 0.78% |
| 0.56 | 1 | 0.78% |
Monitor Area
Area in inch²


| Area in inch² | Computers | Percent |
|---|---|---|
| 1-40 | 48 | 36.92% |
| Unknown | 41 | 31.54% |
| 301-350 | 9 | 6.92% |
| 201-250 | 9 | 6.92% |
| More than 1000 | 6 | 4.62% |
| 101-110 | 5 | 3.85% |
| 351-500 | 3 | 2.31% |
| 251-300 | 3 | 2.31% |
| 501-1000 | 2 | 1.54% |
| 71-80 | 1 | 0.77% |
| 151-200 | 1 | 0.77% |
| 141-150 | 1 | 0.77% |
| 91-100 | 1 | 0.77% |
Pixel Density
Pixels per inch


| Density | Computers | Percent |
|---|---|---|
| 161-240 | 48 | 38.4% |
| Unknown | 41 | 32.8% |
| 51-100 | 15 | 12% |
| 101-120 | 10 | 8% |
| 121-160 | 8 | 6.4% |
| 1-50 | 3 | 2.4% |
Multiple Monitors
Total monitors connected


| Total | Computers | Percent |
|---|---|---|
| 1 | 66 | 66.67% |
| 2 | 31 | 31.31% |
| 4 | 1 | 1.01% |
| 3 | 1 | 1.01% |
Network
Net Controller Vendor
Controller vendors


| Vendor | Computers | Percent |
|---|---|---|
| Realtek Semiconductor | 92 | 75.41% |
| ASIX Electronics | 16 | 13.11% |
| Intel | 6 | 4.92% |
| Ralink Technology | 2 | 1.64% |
| Qualcomm Atheros | 2 | 1.64% |
| DisplayLink | 1 | 0.82% |
| D-Link | 1 | 0.82% |
| Broadcom Limited | 1 | 0.82% |
| Broadcom | 1 | 0.82% |
Net Controller Model
Controller models


| Model | Computers | Percent |
|---|---|---|
| Realtek RTL8822CE 802.11ac PCIe Wireless Network Adapter | 87 | 61.7% |
| Realtek RTL8153 Gigabit Ethernet Adapter | 16 | 11.35% |
| ASIX AX88179 Gigabit Ethernet | 16 | 11.35% |
| Realtek RTL8125 2.5GbE Controller | 2 | 1.42% |
| Realtek RTL8111/8168/8411 PCI Express Gigabit Ethernet Controller | 2 | 1.42% |
| Intel Wi-Fi 6 AX200 | 2 | 1.42% |
| Intel I211 Gigabit Network Connection | 2 | 1.42% |
| Realtek RTL8152 Fast Ethernet Adapter | 1 | 0.71% |
| Realtek 802.11ac NIC | 1 | 0.71% |
| Ralink RT5372 Wireless Adapter | 1 | 0.71% |
| Ralink RT5370 Wireless Adapter | 1 | 0.71% |
| Qualcomm Atheros QCA9377 802.11ac Wireless Network Adapter | 1 | 0.71% |
| Qualcomm Atheros AR8161 Gigabit Ethernet | 1 | 0.71% |
| Intel Wireless 3165 | 1 | 0.71% |
| Intel Ethernet Connection I217-LM | 1 | 0.71% |
| Intel Ethernet Connection (2) I219-V | 1 | 0.71% |
| Intel Centrino Wireless-N 2230 | 1 | 0.71% |
| DisplayLink ThinkPad USB 3.0 Ultra Dock | 1 | 0.71% |
| D-Link 802.11 n WLAN | 1 | 0.71% |
| Broadcom NetXtreme BCM57766 Gigabit Ethernet PCIe | 1 | 0.71% |
| Broadcom Limited BCM4360 802.11ac Wireless Network Adapter | 1 | 0.71% |
Wireless Vendor
Wireless vendors


| Vendor | Computers | Percent |
|---|---|---|
| Realtek Semiconductor | 88 | 90.72% |
| Intel | 4 | 4.12% |
| Ralink Technology | 2 | 2.06% |
| Qualcomm Atheros | 1 | 1.03% |
| D-Link | 1 | 1.03% |
| Broadcom Limited | 1 | 1.03% |
Wireless Model
Wireless models


| Model | Computers | Percent |
|---|---|---|
| Realtek RTL8822CE 802.11ac PCIe Wireless Network Adapter | 87 | 89.69% |
| Intel Wi-Fi 6 AX200 | 2 | 2.06% |
| Realtek 802.11ac NIC | 1 | 1.03% |
| Ralink RT5372 Wireless Adapter | 1 | 1.03% |
| Ralink RT5370 Wireless Adapter | 1 | 1.03% |
| Qualcomm Atheros QCA9377 802.11ac Wireless Network Adapter | 1 | 1.03% |
| Intel Wireless 3165 | 1 | 1.03% |
| Intel Centrino Wireless-N 2230 | 1 | 1.03% |
| D-Link 802.11 n WLAN | 1 | 1.03% |
| Broadcom Limited BCM4360 802.11ac Wireless Network Adapter | 1 | 1.03% |
Ethernet Vendor
Ethernet vendors


| Vendor | Computers | Percent |
|---|---|---|
| Realtek Semiconductor | 21 | 47.73% |
| ASIX Electronics | 16 | 36.36% |
| Intel | 4 | 9.09% |
| Qualcomm Atheros | 1 | 2.27% |
| DisplayLink | 1 | 2.27% |
| Broadcom | 1 | 2.27% |
Ethernet Model
Ethernet models


| Model | Computers | Percent |
|---|---|---|
| Realtek RTL8153 Gigabit Ethernet Adapter | 16 | 36.36% |
| ASIX AX88179 Gigabit Ethernet | 16 | 36.36% |
| Realtek RTL8125 2.5GbE Controller | 2 | 4.55% |
| Realtek RTL8111/8168/8411 PCI Express Gigabit Ethernet Controller | 2 | 4.55% |
| Intel I211 Gigabit Network Connection | 2 | 4.55% |
| Realtek RTL8152 Fast Ethernet Adapter | 1 | 2.27% |
| Qualcomm Atheros AR8161 Gigabit Ethernet | 1 | 2.27% |
| Intel Ethernet Connection I217-LM | 1 | 2.27% |
| Intel Ethernet Connection (2) I219-V | 1 | 2.27% |
| DisplayLink ThinkPad USB 3.0 Ultra Dock | 1 | 2.27% |
| Broadcom NetXtreme BCM57766 Gigabit Ethernet PCIe | 1 | 2.27% |
Net Controller Kind
Ethernet, WiFi or modem


| Kind | Computers | Percent |
|---|---|---|
| WiFi | 96 | 70.07% |
| Ethernet | 41 | 29.93% |
Used Controller
Currently used network controller


| Kind | Computers | Percent |
|---|---|---|
| WiFi | 91 | 86.67% |
| Ethernet | 14 | 13.33% |
NICs
Total network controllers on board


| Total | Computers | Percent |
|---|---|---|
| 1 | 92 | 92.93% |
| 2 | 4 | 4.04% |
| 0 | 2 | 2.02% |
| 3 | 1 | 1.01% |
IPv6
IPv6 vs IPv4


| Used | Computers | Percent |
|---|---|---|
| No | 68 | 68.69% |
| Yes | 31 | 31.31% |
Bluetooth
Bluetooth Vendor
Controller vendors


| Vendor | Computers | Percent |
|---|---|---|
| IMC Networks | 88 | 88.89% |
| Intel | 4 | 4.04% |
| ASUSTek Computer | 3 | 3.03% |
| Cambridge Silicon Radio | 2 | 2.02% |
| SINO WEALTH | 1 | 1.01% |
| Apple | 1 | 1.01% |
Bluetooth Model
Controller models


| Model | Computers | Percent |
|---|---|---|
| IMC Networks Bluetooth Radio | 87 | 87.88% |
| Intel AX200 Bluetooth | 2 | 2.02% |
| Cambridge Silicon Radio Bluetooth Dongle (HCI mode) | 2 | 2.02% |
| ASUS Bluetooth Device | 2 | 2.02% |
| SINO WEALTH RK Bluetooth Keyboar | 1 | 1.01% |
| Intel Centrino Bluetooth Wireless Transceiver | 1 | 1.01% |
| Intel Bluetooth wireless interface | 1 | 1.01% |
| IMC Networks Bluetooth Device | 1 | 1.01% |
| ASUS Broadcom BCM20702A0 Bluetooth | 1 | 1.01% |
| Apple Bluetooth Host Controller | 1 | 1.01% |
Sound
Sound Vendor
Sound card vendors


| Vendor | Computers | Percent |
|---|---|---|
| AMD | 93 | 81.58% |
| Nvidia | 5 | 4.39% |
| Intel | 5 | 4.39% |
| Realtek Semiconductor | 2 | 1.75% |
| SteelSeries ApS | 1 | 0.88% |
| Sony | 1 | 0.88% |
| Plantronics | 1 | 0.88% |
| Lenovo | 1 | 0.88% |
| Kingston Technology | 1 | 0.88% |
| JMTek | 1 | 0.88% |
| Hewlett-Packard | 1 | 0.88% |
| GN Netcom | 1 | 0.88% |
| Corsair | 1 | 0.88% |
Sound Model
Sound card models


| Model | Computers | Percent |
|---|---|---|
| AMD Rembrandt Radeon High Definition Audio Controller | 87 | 71.31% |
| AMD Family 17h/19h HD Audio Controller | 4 | 3.28% |
| Realtek Semiconductor USB Audio | 2 | 1.64% |
| Nvidia GA104 High Definition Audio Controller | 2 | 1.64% |
| AMD Starship/Matisse HD Audio Controller | 2 | 1.64% |
| AMD Renoir Radeon High Definition Audio Controller | 2 | 1.64% |
| AMD Raven/Raven2/Fenghuang HDMI/DP Audio Controller | 2 | 1.64% |
| AMD Navi 21/23 HDMI/DP Audio Controller | 2 | 1.64% |
| SteelSeries ApS SteelSeries Arctis 7 | 1 | 0.82% |
| Sony DualSense wireless controller (PS5) | 1 | 0.82% |
| Plantronics Savi 8200 Office Series | 1 | 0.82% |
| Nvidia GP106 High Definition Audio Controller | 1 | 0.82% |
| Nvidia GK107 HDMI Audio Controller | 1 | 0.82% |
| Nvidia GA106 High Definition Audio Controller | 1 | 0.82% |
| Lenovo ThinkPad Thunderbolt 4 Dock USB Audio | 1 | 0.82% |
| Kingston Technology HyperX 7.1 Audio | 1 | 0.82% |
| JMTek USB PnP Audio Device | 1 | 0.82% |
| Intel Xeon E3-1200 v3/4th Gen Core Processor HD Audio Controller | 1 | 0.82% |
| Intel Haswell-ULT HD Audio Controller | 1 | 0.82% |
| Intel CM238 HD Audio Controller | 1 | 0.82% |
| Intel 8 Series/C220 Series Chipset High Definition Audio Controller | 1 | 0.82% |
| Intel 8 Series HD Audio Controller | 1 | 0.82% |
| Intel 7 Series/C216 Chipset Family High Definition Audio Controller | 1 | 0.82% |
| Intel 100 Series/C230 Series Chipset Family HD Audio Controller | 1 | 0.82% |
| Hewlett-Packard USB Audio | 1 | 0.82% |
| GN Netcom Jabra SPEAK 410 | 1 | 0.82% |
| Corsair HS45 Surround USB Sound Adapter | 1 | 0.82% |
Memory
Memory Vendor
Memory module vendors


| Vendor | Computers | Percent |
|---|---|---|
| Unknown | 1 | 100% |
Memory Model
Memory module models


| Model | Computers | Percent |
|---|---|---|
| Unknown | 1 | 100% |
Memory Kind
Memory module kinds


| Kind | Computers | Percent |
|---|---|---|
| LPDDR5 | 1 | 100% |
Memory Form Factor
Physical design of the memory module


| Name | Computers | Percent |
|---|---|---|
| SODIMM | 1 | 100% |
Memory Size
Memory module size


| Size | Computers | Percent |
|---|---|---|
| 4096 | 1 | 100% |
Memory Speed
Memory module speed


| Speed | Computers | Percent |
|---|---|---|
| 4266 | 1 | 100% |
Printers & scanners
Printer Vendor
Printer device vendors


| Vendor | Computers | Percent |
|---|---|---|
| Dymo-CoStar | 1 | 100% |
Printer Model
Printer device models


| Model | Computers | Percent |
|---|---|---|
| Dymo-CoStar LabelWriter 400 | 1 | 100% |
Scanner Vendor
Scanner device vendors
Zero info for selected period =(
Scanner Model
Scanner device models
Zero info for selected period =(
Camera
Camera Vendor
Camera device vendors


| Vendor | Computers | Percent |
|---|---|---|
| Tobii Technology AB | 1 | 25% |
| Sunplus Innovation Technology | 1 | 25% |
| Logitech | 1 | 25% |
| Generalplus Technology | 1 | 25% |
Camera Model
Camera device models


| Model | Computers | Percent |
|---|---|---|
| Tobii AB EyeChip | 1 | 25% |
| Sunplus Asus Webcam | 1 | 25% |
| Logitech HD Pro Webcam C920 | 1 | 25% |
| Generalplus GENERAL WEBCAM | 1 | 25% |
Security
Fingerprint Vendor
Fingerprint sensor vendors

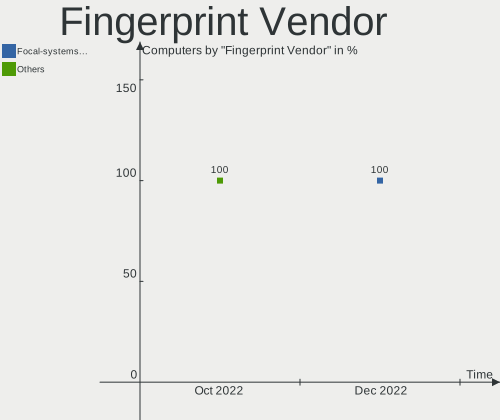
| Vendor | Computers | Percent |
|---|---|---|
| Focal-systems.Corp | 1 | 100% |
Fingerprint Model
Fingerprint sensor models


| Model | Computers | Percent |
|---|---|---|
| Focal-systems.Corp FT9201Fingerprint. | 1 | 100% |
Chipcard Vendor
Chipcard module vendors
Zero info for selected period =(
Chipcard Model
Chipcard module models
Zero info for selected period =(
Unsupported
Unsupported Devices
Total unsupported devices on board


| Total | Computers | Percent |
|---|---|---|
| 0 | 97 | 97.98% |
| 1 | 2 | 2.02% |
Unsupported Device Types
Types of unsupported devices


| Type | Computers | Percent |
|---|---|---|
| Multimedia controller | 1 | 50% |
| Fingerprint reader | 1 | 50% |