OpenMandriva - Hardware Trends
A project to identify most popular hardware characteristics and track their change over time based on data collected by Linux users at https://Linux-Hardware.org.
Anyone can contribute to this report by the hw-probe tool:
sudo -E hw-probe -all -uploadThis is a report for all computer types. See also reports for desktops and notebooks.
This report is for one last month. Overall report since the beginning of time: TestCoverage
Period: Dec, 2022.
Contents
System
OS
Installed operating systems


| Name | Computers | Percent |
|---|---|---|
| OpenMandriva 4.3 | 205 | 60.12% |
| OpenMandriva 22.12 | 54 | 15.84% |
| OpenMandriva 4.50 | 51 | 14.96% |
| OpenMandriva 4.2 | 13 | 3.81% |
| OpenMandriva 4.90 | 12 | 3.52% |
| OpenMandriva 22.90 | 3 | 0.88% |
| OpenMandriva 22.11 | 3 | 0.88% |
OS Family
OS without a version


| Name | Computers | Percent |
|---|---|---|
| OpenMandriva | 341 | 100% |
Kernel
Version of the Linux kernel


| Version | Computers | Percent |
|---|---|---|
| 5.16.7-desktop-1omv4003 | 195 | 57.18% |
| 6.0.10-desktop-2omv22090 | 53 | 15.54% |
| 5.19.12-desktop-2omv4090 | 36 | 10.56% |
| 5.19.5-desktop-1omv4090 | 10 | 2.93% |
| 5.10.14-desktop-1omv4002 | 10 | 2.93% |
| 5.16.13-desktop-1omv4003 | 9 | 2.64% |
| 5.18.12-desktop-3omv4090 | 8 | 2.35% |
| 5.19.11-desktop-2omv4090 | 5 | 1.47% |
| 6.0.2-desktop-1omv4090 | 4 | 1.17% |
| 5.11.12-desktop-1omv4002 | 3 | 0.88% |
| 6.0.9-desktop-1omv22090 | 2 | 0.59% |
| 6.0.2-desktop-1omv4050 | 2 | 0.59% |
| 6.1.0-desktop-1omv2290 | 1 | 0.29% |
| 6.0.10-server-2omv22090 | 1 | 0.29% |
| 6.0.10-desktop-gcc-2omv22090 | 1 | 0.29% |
| 5.14.14-desktop-1omv4050 | 1 | 0.29% |
Kernel Family
Linux kernel without a distro release


| Version | Computers | Percent |
|---|---|---|
| 5.16.7 | 195 | 57.18% |
| 6.0.10 | 55 | 16.13% |
| 5.19.12 | 36 | 10.56% |
| 5.19.5 | 10 | 2.93% |
| 5.10.14 | 10 | 2.93% |
| 5.16.13 | 9 | 2.64% |
| 5.18.12 | 8 | 2.35% |
| 6.0.2 | 6 | 1.76% |
| 5.19.11 | 5 | 1.47% |
| 5.11.12 | 3 | 0.88% |
| 6.0.9 | 2 | 0.59% |
| 6.1.0 | 1 | 0.29% |
| 5.14.14 | 1 | 0.29% |
Kernel Major Ver.
Linux kernel major version


| Version | Computers | Percent |
|---|---|---|
| 5.16 | 204 | 59.82% |
| 6.0 | 63 | 18.48% |
| 5.19 | 51 | 14.96% |
| 5.10 | 10 | 2.93% |
| 5.18 | 8 | 2.35% |
| 5.11 | 3 | 0.88% |
| 6.1 | 1 | 0.29% |
| 5.14 | 1 | 0.29% |
Arch
OS architecture (x86_64, i586, etc.)


| Name | Computers | Percent |
|---|---|---|
| x86_64 | 340 | 99.71% |
| aarch64 | 1 | 0.29% |
DE
Desktop Environment


| Name | Computers | Percent |
|---|---|---|
| KDE5 | 334 | 97.95% |
| LXQt | 3 | 0.88% |
| GNOME | 3 | 0.88% |
| XFCE | 1 | 0.29% |
Display Server
X11 or Wayland


| Name | Computers | Percent |
|---|---|---|
| X11 | 335 | 98.24% |
| Wayland | 6 | 1.76% |
Display Manager
SDDM, LightDM, etc.


| Name | Computers | Percent |
|---|---|---|
| SDDM | 336 | 98.53% |
| GDM | 3 | 0.88% |
| LightDM | 2 | 0.59% |
OS Lang
Language


| Lang | Computers | Percent |
|---|---|---|
| en_US | 181 | 53.08% |
| ru_RU | 26 | 7.62% |
| fr_FR | 23 | 6.74% |
| de_DE | 19 | 5.57% |
| pl_PL | 16 | 4.69% |
| pt_BR | 13 | 3.81% |
| it_IT | 10 | 2.93% |
| en_GB | 9 | 2.64% |
| es_ES | 7 | 2.05% |
| es_MX | 4 | 1.17% |
| es_AR | 4 | 1.17% |
| cs_CZ | 4 | 1.17% |
| hu_HU | 3 | 0.88% |
| es_CO | 2 | 0.59% |
| es_CL | 2 | 0.59% |
| de_AT | 2 | 0.59% |
| sk_SK | 1 | 0.29% |
| ru_UA | 1 | 0.29% |
| ro_RO | 1 | 0.29% |
| pt_PT | 1 | 0.29% |
| nl_NL | 1 | 0.29% |
| fr_CH | 1 | 0.29% |
| fr_CA | 1 | 0.29% |
| fr_BE | 1 | 0.29% |
| es_VE | 1 | 0.29% |
| es_US | 1 | 0.29% |
| es_PR | 1 | 0.29% |
| es_PE | 1 | 0.29% |
| es_EC | 1 | 0.29% |
| en_IN | 1 | 0.29% |
| en_HK | 1 | 0.29% |
| da_DK | 1 | 0.29% |
Boot Mode
EFI or BIOS


| Mode | Computers | Percent |
|---|---|---|
| EFI | 179 | 52.49% |
| BIOS | 162 | 47.51% |
Filesystem
Type of filesystem


| Type | Computers | Percent |
|---|---|---|
| Overlay | 272 | 79.77% |
| Ext4 | 62 | 18.18% |
| Btrfs | 4 | 1.17% |
| Xfs | 1 | 0.29% |
| F2fs | 1 | 0.29% |
| Ext3 | 1 | 0.29% |
Part. scheme
Scheme of partitioning


| Type | Computers | Percent |
|---|---|---|
| GPT | 238 | 69.79% |
| MBR | 101 | 29.62% |
| Unknown | 2 | 0.59% |
Dual Boot with Linux/BSD
Hosting more than one Linux/BSD


| Dual boot | Computers | Percent |
|---|---|---|
| Yes | 173 | 50.73% |
| No | 168 | 49.27% |
Dual Boot (Win)
Hosting Linux and Windows


| Dual boot | Computers | Percent |
|---|---|---|
| No | 186 | 54.55% |
| Yes | 155 | 45.45% |
Board
Vendor
Motherboard manufacturer


| Name | Computers | Percent |
|---|---|---|
| ASUSTek Computer | 71 | 20.82% |
| Lenovo | 46 | 13.49% |
| Dell | 35 | 10.26% |
| Hewlett-Packard | 34 | 9.97% |
| Acer | 26 | 7.62% |
| Gigabyte Technology | 25 | 7.33% |
| MSI | 21 | 6.16% |
| Toshiba | 12 | 3.52% |
| ASRock | 9 | 2.64% |
| Apple | 7 | 2.05% |
| Positivo | 6 | 1.76% |
| Samsung Electronics | 5 | 1.47% |
| Pegatron | 5 | 1.47% |
| Sony | 3 | 0.88% |
| ECS | 3 | 0.88% |
| Langchao | 2 | 0.59% |
| Intel | 2 | 0.59% |
| HUAWEI | 2 | 0.59% |
| Fujitsu | 2 | 0.59% |
| Biostar | 2 | 0.59% |
| Supermicro | 1 | 0.29% |
| Star Labs | 1 | 0.29% |
| RM Education | 1 | 0.29% |
| pine64,rockpro64-v2.1 | 1 | 0.29% |
| PERTOSA | 1 | 0.29% |
| Packard Bell | 1 | 0.29% |
| Notebook | 1 | 0.29% |
| Microsoft | 1 | 0.29% |
| Medion | 1 | 0.29% |
| MAXSUN | 1 | 0.29% |
| MACHINIST | 1 | 0.29% |
| LG Electronics | 1 | 0.29% |
| Huanan | 1 | 0.29% |
| HC Technology. | 1 | 0.29% |
| 1 | 0.29% | |
| Foxconn | 1 | 0.29% |
| Dynabook | 1 | 0.29% |
| Datto | 1 | 0.29% |
| Clevo | 1 | 0.29% |
| AZW | 1 | 0.29% |
Model
Motherboard model


| Name | Computers | Percent |
|---|---|---|
| Toshiba dynabook T653/46JR | 4 | 1.17% |
| ASUS UX31E | 4 | 1.17% |
| Dell OptiPlex 760 | 3 | 0.88% |
| Dell OptiPlex 380 | 3 | 0.88% |
| ASUS P8Z77-V LX | 3 | 0.88% |
| Apple MacBookAir7,2 | 3 | 0.88% |
| Acer Nitro AN515-57 | 3 | 0.88% |
| Positivo Mobile | 2 | 0.59% |
| Positivo H14BT58 | 2 | 0.59% |
| MSI GF63 Thin 9RCX | 2 | 0.59% |
| Lenovo IdeaPad S145-15AST 81N3 | 2 | 0.59% |
| Lenovo IdeaPad 100-15IBD 80QQ | 2 | 0.59% |
| Langchao NF5110 | 2 | 0.59% |
| HP Pavilion Notebook | 2 | 0.59% |
| HP Pavilion Laptop 15-cw1xxx | 2 | 0.59% |
| HP Notebook | 2 | 0.59% |
| HP 15 | 2 | 0.59% |
| Gigabyte GA-78LMT-USB3 6.0 | 2 | 0.59% |
| Dell OptiPlex 3010 | 2 | 0.59% |
| ASUS S551LN | 2 | 0.59% |
| ASUS P5K | 2 | 0.59% |
| ASUS K55VD | 2 | 0.59% |
| ASUS All Series | 2 | 0.59% |
| Acer Aspire VX5-591G | 2 | 0.59% |
| Toshiba Satellite L655 | 1 | 0.29% |
| Toshiba Satellite L635 | 1 | 0.29% |
| Toshiba Satellite L500 | 1 | 0.29% |
| Toshiba Satellite C855 | 1 | 0.29% |
| Toshiba Satellite C55-B | 1 | 0.29% |
| Toshiba Satellite C55-A | 1 | 0.29% |
| Toshiba Satellite A305D | 1 | 0.29% |
| Toshiba EQUIUM A300D | 1 | 0.29% |
| Supermicro X11SSV-Q | 1 | 0.29% |
| Star Labs StarBook | 1 | 0.29% |
| Sony VPCEL2S1E | 1 | 0.29% |
| Sony VGN-NW31JF_S | 1 | 0.29% |
| Sony VGN-FZ31Z | 1 | 0.29% |
| Samsung R540/R580/R780/SA41/E452/E852 | 1 | 0.29% |
| Samsung NB30/N146 | 1 | 0.29% |
| Samsung 305E4A/305E5A/305E7A | 1 | 0.29% |
Model Family
Motherboard model prefix


| Name | Computers | Percent |
|---|---|---|
| Acer Aspire | 19 | 5.57% |
| Dell OptiPlex | 16 | 4.69% |
| Lenovo ThinkPad | 13 | 3.81% |
| Lenovo IdeaPad | 12 | 3.52% |
| HP Pavilion | 10 | 2.93% |
| Dell Latitude | 8 | 2.35% |
| Toshiba Satellite | 7 | 2.05% |
| Lenovo ThinkCentre | 7 | 2.05% |
| HP Compaq | 5 | 1.47% |
| Dell Inspiron | 5 | 1.47% |
| ASUS TUF | 5 | 1.47% |
| ASUS PRIME | 5 | 1.47% |
| Toshiba dynabook | 4 | 1.17% |
| ASUS UX31E | 4 | 1.17% |
| ASUS ROG | 4 | 1.17% |
| ASUS P5K | 4 | 1.17% |
| Acer Nitro | 4 | 1.17% |
| Lenovo Yoga | 3 | 0.88% |
| Dell Vostro | 3 | 0.88% |
| ASUS VivoBook | 3 | 0.88% |
| ASUS P8Z77-V | 3 | 0.88% |
| Apple MacBookAir7 | 3 | 0.88% |
| Positivo Mobile | 2 | 0.59% |
| Positivo H14BT58 | 2 | 0.59% |
| MSI GF63 | 2 | 0.59% |
| Langchao NF5110 | 2 | 0.59% |
| HP Notebook | 2 | 0.59% |
| HP EliteDesk | 2 | 0.59% |
| HP EliteBook | 2 | 0.59% |
| HP 15 | 2 | 0.59% |
| Gigabyte GA-78LMT-USB3 | 2 | 0.59% |
| ASUS S551LN | 2 | 0.59% |
| ASUS M5A97 | 2 | 0.59% |
| ASUS K55VD | 2 | 0.59% |
| ASUS All | 2 | 0.59% |
| ASRock B550 | 2 | 0.59% |
| Apple iMac12 | 2 | 0.59% |
| Toshiba EQUIUM | 1 | 0.29% |
| Supermicro X11SSV-Q | 1 | 0.29% |
| Star Labs StarBook | 1 | 0.29% |
MFG Year
Motherboard manufacture year


| Year | Computers | Percent |
|---|---|---|
| 2013 | 34 | 9.97% |
| 2021 | 31 | 9.09% |
| 2011 | 28 | 8.21% |
| 2012 | 27 | 7.92% |
| 2010 | 25 | 7.33% |
| 2014 | 24 | 7.04% |
| 2015 | 23 | 6.74% |
| 2019 | 21 | 6.16% |
| 2008 | 21 | 6.16% |
| 2020 | 20 | 5.87% |
| 2009 | 20 | 5.87% |
| 2018 | 16 | 4.69% |
| 2017 | 16 | 4.69% |
| 2022 | 12 | 3.52% |
| 2016 | 11 | 3.23% |
| 2007 | 9 | 2.64% |
| 2006 | 3 | 0.88% |
Form Factor
Physical design of the computer


| Name | Computers | Percent |
|---|---|---|
| Notebook | 163 | 47.8% |
| Desktop | 160 | 46.92% |
| Mini pc | 6 | 1.76% |
| All in one | 4 | 1.17% |
| Convertible | 3 | 0.88% |
| Server | 3 | 0.88% |
| System on chip | 1 | 0.29% |
| Tablet | 1 | 0.29% |
Secure Boot
Enabled or disabled


| State | Computers | Percent |
|---|---|---|
| Disabled | 341 | 100% |
Coreboot
Have coreboot on board


| Used | Computers | Percent |
|---|---|---|
| No | 339 | 99.41% |
| Yes | 2 | 0.59% |
RAM Size
Total RAM memory


| Size in GB | Computers | Percent |
|---|---|---|
| 3.01-4.0 | 103 | 30.21% |
| 4.01-8.0 | 78 | 22.87% |
| 8.01-16.0 | 61 | 17.89% |
| 16.01-24.0 | 54 | 15.84% |
| 32.01-64.0 | 21 | 6.16% |
| 1.01-2.0 | 11 | 3.23% |
| 2.01-3.0 | 6 | 1.76% |
| 24.01-32.0 | 4 | 1.17% |
| 64.01-256.0 | 2 | 0.59% |
| 0.51-1.0 | 1 | 0.29% |
RAM Used
Used RAM memory


| Used GB | Computers | Percent |
|---|---|---|
| 1.01-2.0 | 245 | 71.85% |
| 0.51-1.0 | 55 | 16.13% |
| 2.01-3.0 | 27 | 7.92% |
| 0.01-0.5 | 6 | 1.76% |
| 3.01-4.0 | 5 | 1.47% |
| 4.01-8.0 | 2 | 0.59% |
| 8.01-16.0 | 1 | 0.29% |
Total Drives
Number of drives on board


| Drives | Computers | Percent |
|---|---|---|
| 1 | 223 | 65.4% |
| 2 | 62 | 18.18% |
| 3 | 21 | 6.16% |
| 4 | 16 | 4.69% |
| 5 | 7 | 2.05% |
| 0 | 6 | 1.76% |
| 7 | 3 | 0.88% |
| 6 | 3 | 0.88% |
Has CD-ROM
Has CD-ROM on board


| Presented | Computers | Percent |
|---|---|---|
| No | 187 | 54.84% |
| Yes | 154 | 45.16% |
Has Ethernet
Has Ethernet on board


| Presented | Computers | Percent |
|---|---|---|
| Yes | 313 | 91.79% |
| No | 28 | 8.21% |
Has WiFi
Has WiFi module


| Presented | Computers | Percent |
|---|---|---|
| Yes | 234 | 68.62% |
| No | 107 | 31.38% |
Has Bluetooth
Has Bluetooth module


| Presented | Computers | Percent |
|---|---|---|
| No | 175 | 51.32% |
| Yes | 166 | 48.68% |
Location
Country
Geographic location (country)


| Country | Computers | Percent |
|---|---|---|
| Russia | 43 | 12.61% |
| USA | 42 | 12.32% |
| Germany | 33 | 9.68% |
| France | 28 | 8.21% |
| Poland | 23 | 6.74% |
| Italy | 22 | 6.45% |
| Brazil | 18 | 5.28% |
| UK | 13 | 3.81% |
| Mexico | 9 | 2.64% |
| Spain | 8 | 2.35% |
| Canada | 8 | 2.35% |
| Czechia | 6 | 1.76% |
| Romania | 5 | 1.47% |
| Japan | 5 | 1.47% |
| Indonesia | 5 | 1.47% |
| Hungary | 5 | 1.47% |
| Argentina | 5 | 1.47% |
| Switzerland | 4 | 1.17% |
| Portugal | 3 | 0.88% |
| Bulgaria | 3 | 0.88% |
| Ukraine | 2 | 0.59% |
| Turkey | 2 | 0.59% |
| Slovakia | 2 | 0.59% |
| Serbia | 2 | 0.59% |
| Norway | 2 | 0.59% |
| Netherlands | 2 | 0.59% |
| Morocco | 2 | 0.59% |
| Latvia | 2 | 0.59% |
| Finland | 2 | 0.59% |
| Egypt | 2 | 0.59% |
| Denmark | 2 | 0.59% |
| Colombia | 2 | 0.59% |
| China | 2 | 0.59% |
| Chile | 2 | 0.59% |
| Belgium | 2 | 0.59% |
| Austria | 2 | 0.59% |
| Venezuela | 1 | 0.29% |
| Thailand | 1 | 0.29% |
| Sweden | 1 | 0.29% |
| Slovenia | 1 | 0.29% |
City
Geographic location (city)


| City | Computers | Percent |
|---|---|---|
| Moscow | 6 | 1.76% |
| Warsaw | 5 | 1.47% |
| Volgograd | 5 | 1.47% |
| Saarbrücken | 4 | 1.17% |
| Paris | 4 | 1.17% |
| Prague | 3 | 0.88% |
| Poznan | 3 | 0.88% |
| Nizhniy Novgorod | 3 | 0.88% |
| Vladivostok | 2 | 0.59% |
| Ufa | 2 | 0.59% |
| Srengseng Sawah | 2 | 0.59% |
| Siggenthal Station | 2 | 0.59% |
| Sigean | 2 | 0.59% |
| Salzgitter | 2 | 0.59% |
| Rostov-on-Don | 2 | 0.59% |
| Rio de Janeiro | 2 | 0.59% |
| Novosibirsk | 2 | 0.59% |
| Munich | 2 | 0.59% |
| Muhlhausen-Ehingen | 2 | 0.59% |
| Milan | 2 | 0.59% |
| Mexico City | 2 | 0.59% |
| Madrid | 2 | 0.59% |
| Madison | 2 | 0.59% |
| Lodz | 2 | 0.59% |
| Krasnodar | 2 | 0.59% |
| Krakow | 2 | 0.59% |
| Kenitra | 2 | 0.59% |
| Jakarta | 2 | 0.59% |
| Jacksonville | 2 | 0.59% |
| Iowa City | 2 | 0.59% |
| Goncalves | 2 | 0.59% |
| Farmington | 2 | 0.59% |
| Ciudad Obregón | 2 | 0.59% |
| Braganca Paulista | 2 | 0.59% |
| Bologna | 2 | 0.59% |
| Belgorod | 2 | 0.59% |
| Bamberg | 2 | 0.59% |
| Zonguldak | 1 | 0.29% |
| Zlatoust | 1 | 0.29% |
| Yenne | 1 | 0.29% |
Drives
Drive Vendor
Hard drive vendors


| Vendor | Computers | Drives | Percent |
|---|---|---|---|
| WDC | 85 | 104 | 17.93% |
| Seagate | 74 | 93 | 15.61% |
| Samsung Electronics | 57 | 65 | 12.03% |
| Toshiba | 35 | 34 | 7.38% |
| Kingston | 33 | 36 | 6.96% |
| SanDisk | 21 | 23 | 4.43% |
| Hitachi | 16 | 17 | 3.38% |
| Crucial | 13 | 13 | 2.74% |
| A-DATA Technology | 12 | 13 | 2.53% |
| HGST | 10 | 10 | 2.11% |
| Unknown | 9 | 12 | 1.9% |
| SPCC | 6 | 6 | 1.27% |
| Intel | 6 | 6 | 1.27% |
| Micron Technology | 5 | 5 | 1.05% |
| JMicron Technology | 5 | 5 | 1.05% |
| GOODRAM | 5 | 5 | 1.05% |
| China | 5 | 5 | 1.05% |
| Phison | 4 | 5 | 0.84% |
| Intenso | 4 | 4 | 0.84% |
| Apple | 4 | 4 | 0.84% |
| Apacer | 4 | 4 | 0.84% |
| SK hynix | 3 | 4 | 0.63% |
| PNY | 3 | 3 | 0.63% |
| Patriot | 3 | 3 | 0.63% |
| Maxtor | 3 | 3 | 0.63% |
| Corsair | 3 | 3 | 0.63% |
| Unknown | 3 | 4 | 0.63% |
| XPG | 2 | 2 | 0.42% |
| USB3.0 | 2 | 2 | 0.42% |
| Transcend | 2 | 2 | 0.42% |
| TO Exter | 2 | 2 | 0.42% |
| Team | 2 | 2 | 0.42% |
| SSK | 2 | 2 | 0.42% |
| Silicon Motion | 2 | 2 | 0.42% |
| KIOXIA | 2 | 2 | 0.42% |
| HS-SSD-E100 | 2 | 2 | 0.42% |
| Fujitsu | 2 | 3 | 0.42% |
| AMD | 2 | 3 | 0.42% |
| WD Green | 1 | 1 | 0.21% |
| WALRAM | 1 | 1 | 0.21% |
Drive Model
Hard drive models


| Model | Computers | Percent |
|---|---|---|
| Kingston SA400S37240G 240GB SSD | 14 | 2.7% |
| Seagate ST500LT012-1DG142 500GB | 6 | 1.16% |
| Seagate ST1000LM024 HN-M101MBB 1TB | 6 | 1.16% |
| Toshiba MQ01ABD075 752GB | 5 | 0.97% |
| Toshiba DT01ACA100 1TB | 5 | 0.97% |
| Seagate ST500DM002-1BD142 500GB | 4 | 0.77% |
| Seagate ST2000DM006-2DM164 2TB | 4 | 0.77% |
| SanDisk SSD U100 256GB | 4 | 0.77% |
| Samsung SSD 970 EVO Plus 500GB | 4 | 0.77% |
| WDC WDS100T2B0A-00SM50 1TB SSD | 3 | 0.58% |
| Toshiba MQ01ABF050 500GB | 3 | 0.58% |
| Toshiba MQ01ABD100 1TB | 3 | 0.58% |
| SPCC Solid State Disk 512GB | 3 | 0.58% |
| Seagate ST9500325AS 500GB | 3 | 0.58% |
| Seagate ST3500418AS 500GB | 3 | 0.58% |
| Seagate ST3320613AS 320GB | 3 | 0.58% |
| Seagate ST3250318AS 250GB | 3 | 0.58% |
| Seagate ST2000DM008-2FR102 2TB | 3 | 0.58% |
| Seagate ST1000LM035-1RK172 1TB | 3 | 0.58% |
| Seagate ST1000DM003-9YN162 1TB | 3 | 0.58% |
| Samsung SSD 860 EVO 500GB | 3 | 0.58% |
| Samsung SSD 860 EVO 250GB | 3 | 0.58% |
| Samsung HD502HJ 500GB | 3 | 0.58% |
| Kingston SA400S37120G 120GB SSD | 3 | 0.58% |
| Crucial CT1000MX500SSD1 1TB | 3 | 0.58% |
| Apple SSD SM0128G 121GB | 3 | 0.58% |
| Unknown | 3 | 0.58% |
| WDC WDS240G2G0A-00JH30 240GB SSD | 2 | 0.39% |
| WDC WDS120G2G0A-00JH30 120GB SSD | 2 | 0.39% |
| WDC WDS100T2B0C-00PXH0 1TB | 2 | 0.39% |
| WDC WD800JD-08LSA0 80GB | 2 | 0.39% |
| WDC WD5000AAKX-22ERMA0 500GB | 2 | 0.39% |
| WDC WD30EFRX-68EUZN0 3TB | 2 | 0.39% |
| WDC WD2500BPVT-00JJ5T0 250GB | 2 | 0.39% |
| WDC WD2500AAKX-00ERMA0 250GB | 2 | 0.39% |
| WDC WD1600BEVT-80A23T0 160GB | 2 | 0.39% |
| WDC WD1600AAJS-75M0A0 160GB | 2 | 0.39% |
| WDC WD10JPVX-22JC3T0 1TB | 2 | 0.39% |
| WDC WD10EZEX-21WN4A0 1TB | 2 | 0.39% |
| WDC WD10EZEX-08WN4A0 1TB | 2 | 0.39% |
HDD Vendor
Hard disk drive vendors


| Vendor | Computers | Drives | Percent |
|---|---|---|---|
| Seagate | 74 | 92 | 34.42% |
| WDC | 65 | 77 | 30.23% |
| Toshiba | 31 | 30 | 14.42% |
| Hitachi | 16 | 17 | 7.44% |
| Samsung Electronics | 10 | 10 | 4.65% |
| HGST | 10 | 10 | 4.65% |
| Maxtor | 3 | 3 | 1.4% |
| USB3.0 | 2 | 2 | 0.93% |
| Fujitsu | 2 | 3 | 0.93% |
| Unknown | 1 | 1 | 0.47% |
| ASMT | 1 | 1 | 0.47% |
SSD Vendor
Solid state drive vendors


| Vendor | Computers | Drives | Percent |
|---|---|---|---|
| Samsung Electronics | 25 | 29 | 14.79% |
| Kingston | 23 | 26 | 13.61% |
| SanDisk | 17 | 18 | 10.06% |
| WDC | 12 | 12 | 7.1% |
| Crucial | 12 | 12 | 7.1% |
| A-DATA Technology | 12 | 12 | 7.1% |
| SPCC | 5 | 5 | 2.96% |
| GOODRAM | 5 | 5 | 2.96% |
| China | 5 | 5 | 2.96% |
| Intenso | 4 | 4 | 2.37% |
| Intel | 4 | 4 | 2.37% |
| Apple | 4 | 4 | 2.37% |
| Toshiba | 3 | 3 | 1.78% |
| JMicron Technology | 3 | 3 | 1.78% |
| Apacer | 3 | 3 | 1.78% |
| Transcend | 2 | 2 | 1.18% |
| TO Exter | 2 | 2 | 1.18% |
| PNY | 2 | 2 | 1.18% |
| HS-SSD-E100 | 2 | 2 | 1.18% |
| Unknown | 2 | 3 | 1.18% |
| WALRAM | 1 | 1 | 0.59% |
| Verbatim | 1 | 1 | 0.59% |
| Unknown | 1 | 1 | 0.59% |
| Team | 1 | 1 | 0.59% |
| Smartbuy | 1 | 2 | 0.59% |
| SK hynix | 1 | 1 | 0.59% |
| Seagate | 1 | 1 | 0.59% |
| PUSKILL | 1 | 1 | 0.59% |
| Phison | 1 | 1 | 0.59% |
| Patriot | 1 | 1 | 0.59% |
| Mushkin | 1 | 1 | 0.59% |
| MidasForce | 1 | 1 | 0.59% |
| LITEONIT | 1 | 1 | 0.59% |
| Lexar | 1 | 1 | 0.59% |
| KingFast | 1 | 1 | 0.59% |
| INTEL SS | 1 | 1 | 0.59% |
| HPE | 1 | 1 | 0.59% |
| Hewlett-Packard | 1 | 1 | 0.59% |
| Dogfish | 1 | 1 | 0.59% |
| Corsair | 1 | 1 | 0.59% |
Drive Kind
HDD or SSD


| Kind | Computers | Drives | Percent |
|---|---|---|---|
| HDD | 192 | 246 | 44.76% |
| SSD | 142 | 179 | 33.1% |
| NVMe | 80 | 92 | 18.65% |
| Unknown | 8 | 11 | 1.86% |
| MMC | 7 | 8 | 1.63% |
Drive Connector
SATA, SAS, NVMe, etc.


| Type | Computers | Drives | Percent |
|---|---|---|---|
| SATA | 286 | 410 | 72.22% |
| NVMe | 80 | 90 | 20.2% |
| SAS | 23 | 28 | 5.81% |
| MMC | 7 | 8 | 1.77% |
Drive Size
Size of hard drive


| Size in TB | Computers | Drives | Percent |
|---|---|---|---|
| 0.01-0.5 | 213 | 270 | 62.83% |
| 0.51-1.0 | 91 | 112 | 26.84% |
| 1.01-2.0 | 25 | 31 | 7.37% |
| 2.01-3.0 | 6 | 8 | 1.77% |
| 3.01-4.0 | 2 | 2 | 0.59% |
| 4.01-10.0 | 2 | 2 | 0.59% |
Space Total
Amount of disk space available on the file system


| Size in GB | Computers | Percent |
|---|---|---|
| 1-20 | 170 | 49.85% |
| 101-250 | 60 | 17.6% |
| 251-500 | 36 | 10.56% |
| Unknown | 31 | 9.09% |
| 51-100 | 16 | 4.69% |
| 501-1000 | 14 | 4.11% |
| 21-50 | 9 | 2.64% |
| 1001-2000 | 3 | 0.88% |
| More than 3000 | 1 | 0.29% |
| 2001-3000 | 1 | 0.29% |
Space Used
Amount of used disk space


| Used GB | Computers | Percent |
|---|---|---|
| 1-20 | 286 | 83.87% |
| Unknown | 31 | 9.09% |
| 51-100 | 7 | 2.05% |
| 251-500 | 5 | 1.47% |
| 21-50 | 5 | 1.47% |
| 101-250 | 5 | 1.47% |
| 1001-2000 | 2 | 0.59% |
Malfunc. Drives
Drive models with a malfunction

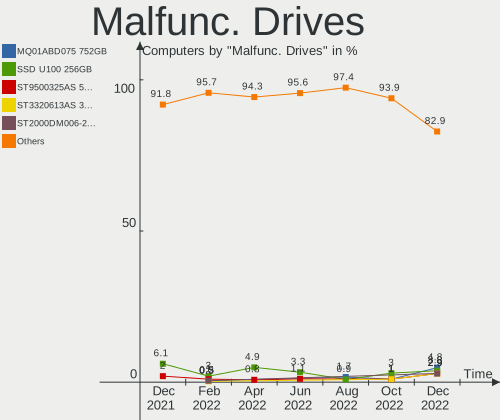
| Model | Computers | Drives | Percent |
|---|---|---|---|
| Toshiba MQ01ABD075 752GB | 5 | 5 | 4.76% |
| SanDisk SSD U100 256GB | 4 | 4 | 3.81% |
| Seagate ST9500325AS 500GB | 3 | 3 | 2.86% |
| Seagate ST3320613AS 320GB | 3 | 3 | 2.86% |
| Seagate ST2000DM006-2DM164 2TB | 3 | 3 | 2.86% |
| WDC WD800JD-08LSA0 80GB | 2 | 2 | 1.9% |
| WDC WD5000AAKX-22ERMA0 500GB | 2 | 2 | 1.9% |
| WDC WD2500AAKX-00ERMA0 250GB | 2 | 2 | 1.9% |
| WDC WD1600AAJS-75M0A0 160GB | 2 | 2 | 1.9% |
| Seagate ST500LT012-9WS142 500GB | 2 | 2 | 1.9% |
| Seagate ST3500418AS 500GB | 2 | 2 | 1.9% |
| Samsung Electronics HD103SI 1TB | 2 | 2 | 1.9% |
| HGST HTS545050A7E680 500GB | 2 | 2 | 1.9% |
| XPG GAMMIX S41 512GB | 1 | 1 | 0.95% |
| WDC WD800JD-75MSA3 80GB | 1 | 1 | 0.95% |
| WDC WD5003ABYX-01WERA0 500GB | 1 | 1 | 0.95% |
| WDC WD5000BPVT-24HXZT3 500GB | 1 | 1 | 0.95% |
| WDC WD5000AAKX-75U6AA0 500GB | 1 | 1 | 0.95% |
| WDC WD5000AAKS-65A7B0 500GB | 1 | 1 | 0.95% |
| WDC WD5000AAKS-402AA0 500GB | 1 | 1 | 0.95% |
| WDC WD5000AAKS-00V1A0 500GB | 1 | 1 | 0.95% |
| WDC WD5000AADS-00M2B0 500GB | 1 | 1 | 0.95% |
| WDC WD40PURX-64GVNY0 4TB | 1 | 1 | 0.95% |
| WDC WD3200LPCX-22VHAT0 320GB | 1 | 1 | 0.95% |
| WDC WD3200BPVT-80JJ5T0 320GB | 1 | 1 | 0.95% |
| WDC WD3200BPVT-22ZEST0 320GB | 1 | 1 | 0.95% |
| WDC WD3200BEVT-22A23T0 320GB | 1 | 1 | 0.95% |
| WDC WD3200AAJS-56M0A0 320GB | 1 | 1 | 0.95% |
| WDC WD30EZRX-00D8PB0 3TB | 1 | 1 | 0.95% |
| WDC WD2500BEVS-60UST0 250GB | 1 | 1 | 0.95% |
| WDC WD2000F9YZ-09N20L0 2TB | 1 | 1 | 0.95% |
| WDC WD1002FAEX-00Z3A0 1TB | 1 | 1 | 0.95% |
| USB3.0 Super Speed 1TB | 1 | 1 | 0.95% |
| Toshiba MQ01ABF050 500GB | 1 | 1 | 0.95% |
| Toshiba MQ01ABD100 1TB | 1 | 1 | 0.95% |
| Toshiba MK4055GSX 400GB | 1 | 1 | 0.95% |
| Toshiba MK3261GSYN 320GB | 1 | 1 | 0.95% |
| Toshiba MK2555GSX 250GB | 1 | 1 | 0.95% |
| Toshiba MK1234GSX 120GB | 1 | 1 | 0.95% |
| Seagate ST9500420AS 500GB | 1 | 1 | 0.95% |
Malfunc. Drive Vendor
Vendors of faulty drives


| Vendor | Computers | Drives | Percent |
|---|---|---|---|
| Seagate | 31 | 32 | 29.81% |
| WDC | 26 | 26 | 25% |
| Toshiba | 11 | 11 | 10.58% |
| Hitachi | 8 | 8 | 7.69% |
| Samsung Electronics | 6 | 6 | 5.77% |
| SanDisk | 5 | 5 | 4.81% |
| HGST | 3 | 3 | 2.88% |
| Maxtor | 2 | 2 | 1.92% |
| A-DATA Technology | 2 | 2 | 1.92% |
| XPG | 1 | 1 | 0.96% |
| USB3.0 | 1 | 1 | 0.96% |
| Kingston | 1 | 1 | 0.96% |
| Intel | 1 | 1 | 0.96% |
| Fujitsu | 1 | 1 | 0.96% |
| CT1000P1 | 1 | 2 | 0.96% |
| Crucial | 1 | 1 | 0.96% |
| Corsair | 1 | 1 | 0.96% |
| China | 1 | 1 | 0.96% |
| ASMT | 1 | 1 | 0.96% |
Malfunc. HDD Vendor
Vendors of faulty HDD drives


| Vendor | Computers | Drives | Percent |
|---|---|---|---|
| Seagate | 31 | 32 | 34.83% |
| WDC | 26 | 26 | 29.21% |
| Toshiba | 11 | 11 | 12.36% |
| Hitachi | 8 | 8 | 8.99% |
| Samsung Electronics | 5 | 5 | 5.62% |
| HGST | 3 | 3 | 3.37% |
| Maxtor | 2 | 2 | 2.25% |
| USB3.0 | 1 | 1 | 1.12% |
| Fujitsu | 1 | 1 | 1.12% |
| ASMT | 1 | 1 | 1.12% |
Malfunc. Drive Kind
Kinds of faulty drives


| Kind | Computers | Drives | Percent |
|---|---|---|---|
| HDD | 85 | 90 | 85% |
| SSD | 12 | 12 | 12% |
| NVMe | 3 | 4 | 3% |
Failed Drives
Failed drive models


| Model | Computers | Drives | Percent |
|---|---|---|---|
| WDC WD7501AALS-00J7B0 752GB | 1 | 1 | 20% |
| Toshiba MQ01ABD050 500GB | 1 | 1 | 20% |
| Toshiba DT01ACA100 1TB | 1 | 1 | 20% |
| Seagate ST3250820AS 250GB | 1 | 1 | 20% |
| Samsung Electronics HM500JI 500GB | 1 | 1 | 20% |
Failed Drive Vendor
Failed drive vendors


| Vendor | Computers | Drives | Percent |
|---|---|---|---|
| Toshiba | 2 | 2 | 40% |
| WDC | 1 | 1 | 20% |
| Seagate | 1 | 1 | 20% |
| Samsung Electronics | 1 | 1 | 20% |
Drive Status
Number of failed and malfunc. drives


| Status | Computers | Drives | Percent |
|---|---|---|---|
| Works | 253 | 390 | 65.37% |
| Malfunc | 100 | 106 | 25.84% |
| Detected | 30 | 35 | 7.75% |
| Failed | 4 | 5 | 1.03% |
Storage controller
Storage Vendor
Storage controller vendors


| Vendor | Computers | Percent |
|---|---|---|
| Intel | 240 | 56.87% |
| AMD | 74 | 17.54% |
| Samsung Electronics | 28 | 6.64% |
| SanDisk | 17 | 4.03% |
| Kingston Technology Company | 10 | 2.37% |
| Silicon Motion | 7 | 1.66% |
| Phison Electronics | 7 | 1.66% |
| Nvidia | 6 | 1.42% |
| Micron Technology | 5 | 1.18% |
| Marvell Technology Group | 5 | 1.18% |
| JMicron Technology | 5 | 1.18% |
| MAXIO Technology (Hangzhou) | 3 | 0.71% |
| ASMedia Technology | 3 | 0.71% |
| Toshiba America Info Systems | 2 | 0.47% |
| SK hynix | 2 | 0.47% |
| Realtek Semiconductor | 2 | 0.47% |
| KIOXIA | 2 | 0.47% |
| Micron/Crucial Technology | 1 | 0.24% |
| LSI Logic / Symbios Logic | 1 | 0.24% |
| Integrated Technology Express | 1 | 0.24% |
| Hewlett-Packard | 1 | 0.24% |
Storage Model
Storage controller models


| Model | Computers | Percent |
|---|---|---|
| AMD FCH SATA Controller [AHCI mode] | 43 | 8.57% |
| Intel 7 Series Chipset Family 6-port SATA Controller [AHCI mode] | 21 | 4.18% |
| Intel 8 Series/C220 Series Chipset Family 6-port SATA Controller 1 [AHCI mode] | 15 | 2.99% |
| Samsung NVMe SSD Controller SM981/PM981/PM983 | 13 | 2.59% |
| AMD SB7x0/SB8x0/SB9x0 IDE Controller | 13 | 2.59% |
| Intel NM10/ICH7 Family SATA Controller [IDE mode] | 11 | 2.19% |
| Intel 6 Series/C200 Series Chipset Family 6 port Mobile SATA AHCI Controller | 11 | 2.19% |
| AMD SB7x0/SB8x0/SB9x0 SATA Controller [AHCI mode] | 11 | 2.19% |
| Intel 82801IBM/IEM (ICH9M/ICH9M-E) 4 port SATA Controller [AHCI mode] | 10 | 1.99% |
| Intel 82801G (ICH7 Family) IDE Controller | 10 | 1.99% |
| Intel 8 Series SATA Controller 1 [AHCI mode] | 10 | 1.99% |
| Intel 6 Series/C200 Series Chipset Family 6 port Desktop SATA AHCI Controller | 10 | 1.99% |
| Intel Wildcat Point-LP SATA Controller [AHCI Mode] | 8 | 1.59% |
| Intel Sunrise Point-LP SATA Controller [AHCI mode] | 8 | 1.59% |
| Intel Q170/Q150/B150/H170/H110/Z170/CM236 Chipset SATA Controller [AHCI Mode] | 8 | 1.59% |
| Intel Atom Processor E3800 Series SATA AHCI Controller | 8 | 1.59% |
| Intel 7 Series/C210 Series Chipset Family 6-port SATA Controller [AHCI mode] | 8 | 1.59% |
| Intel 500 Series Chipset Family SATA AHCI Controller | 8 | 1.59% |
| AMD SB7x0/SB8x0/SB9x0 SATA Controller [IDE mode] | 8 | 1.59% |
| AMD 500 Series Chipset SATA Controller | 8 | 1.59% |
| SanDisk WD Blue SN550 NVMe SSD | 7 | 1.39% |
| Intel 82801 Mobile SATA Controller [RAID mode] | 7 | 1.39% |
| AMD 400 Series Chipset SATA Controller | 7 | 1.39% |
| Intel Volume Management Device NVMe RAID Controller | 6 | 1.2% |
| Intel 6 Series/C200 Series Chipset Family Desktop SATA Controller (IDE mode, ports 4-5) | 6 | 1.2% |
| Intel 6 Series/C200 Series Chipset Family Desktop SATA Controller (IDE mode, ports 0-3) | 6 | 1.2% |
| Intel 5 Series/3400 Series Chipset 4 port SATA AHCI Controller | 6 | 1.2% |
| Silicon Motion SM2263EN/SM2263XT SSD Controller | 5 | 1% |
| Samsung NVMe SSD Controller 980 | 5 | 1% |
| Phison E12 NVMe Controller | 5 | 1% |
| Micron Non-Volatile memory controller | 5 | 1% |
| JMicron JMB363 SATA/IDE Controller | 5 | 1% |
| Intel SATA Controller [RAID mode] | 5 | 1% |
| Intel 82801I (ICH9 Family) 2 port SATA Controller [IDE mode] | 5 | 1% |
| Intel 4 Series Chipset PT IDER Controller | 5 | 1% |
| SanDisk Non-Volatile memory controller | 4 | 0.8% |
| Samsung NVMe SSD Controller PM9A1/PM9A3/980PRO | 4 | 0.8% |
| Kingston Company Company Non-Volatile memory controller | 4 | 0.8% |
| Intel NM10/ICH7 Family SATA Controller [AHCI mode] | 4 | 0.8% |
| Intel HM170/QM170 Chipset SATA Controller [AHCI Mode] | 4 | 0.8% |
Storage Kind
Kind of storage controller (IDE, SATA, NVMe, SAS, ...)


| Kind | Computers | Percent |
|---|---|---|
| SATA | 268 | 61.19% |
| NVMe | 80 | 18.26% |
| IDE | 68 | 15.53% |
| RAID | 21 | 4.79% |
| SCSI | 1 | 0.23% |
Processor
CPU Vendor
Processor vendors


| Vendor | Computers | Percent |
|---|---|---|
| Intel | 256 | 75.07% |
| AMD | 84 | 24.63% |
| ARM | 1 | 0.29% |
CPU Model
Processor models


| Model | Computers | Percent |
|---|---|---|
| Intel Core i7-2677M CPU @ 1.80GHz | 4 | 1.17% |
| Intel Core i5-5200U CPU @ 2.20GHz | 4 | 1.17% |
| Intel Core i3-4030U CPU @ 1.90GHz | 4 | 1.17% |
| Intel Core 2 Quad CPU Q6600 @ 2.40GHz | 4 | 1.17% |
| Intel Celeron CPU 847 @ 1.10GHz | 4 | 1.17% |
| Intel Core i5-5350U CPU @ 1.80GHz | 3 | 0.88% |
| Intel Core i5-3320M CPU @ 2.60GHz | 3 | 0.88% |
| Intel Core i5-2400 CPU @ 3.10GHz | 3 | 0.88% |
| Intel Core i3-4130 CPU @ 3.40GHz | 3 | 0.88% |
| Intel Core i3-3220 CPU @ 3.30GHz | 3 | 0.88% |
| Intel Core i3-2100 CPU @ 3.10GHz | 3 | 0.88% |
| Intel Core i3 CPU M 380 @ 2.53GHz | 3 | 0.88% |
| Intel Core 2 Duo CPU E7500 @ 2.93GHz | 3 | 0.88% |
| Intel Celeron CPU N2840 @ 2.16GHz | 3 | 0.88% |
| Intel 11th Gen Core i5-11400H @ 2.70GHz | 3 | 0.88% |
| AMD Ryzen 7 5700G with Radeon Graphics | 3 | 0.88% |
| AMD Ryzen 5 3500U with Radeon Vega Mobile Gfx | 3 | 0.88% |
| Intel Xeon CPU E3-1220 V2 @ 3.10GHz | 2 | 0.59% |
| Intel Pentium Dual-Core CPU T4500 @ 2.30GHz | 2 | 0.59% |
| Intel Pentium Dual-Core CPU E5300 @ 2.60GHz | 2 | 0.59% |
| Intel Pentium CPU P6100 @ 2.00GHz | 2 | 0.59% |
| Intel Pentium CPU N3520 @ 2.16GHz | 2 | 0.59% |
| Intel Pentium CPU G3220 @ 3.00GHz | 2 | 0.59% |
| Intel Core i7-6700 CPU @ 3.40GHz | 2 | 0.59% |
| Intel Core i5-9300H CPU @ 2.40GHz | 2 | 0.59% |
| Intel Core i5-8400 CPU @ 2.80GHz | 2 | 0.59% |
| Intel Core i5-7300HQ CPU @ 2.50GHz | 2 | 0.59% |
| Intel Core i5-7200U CPU @ 2.50GHz | 2 | 0.59% |
| Intel Core i5-6400 CPU @ 2.70GHz | 2 | 0.59% |
| Intel Core i5-6200U CPU @ 2.30GHz | 2 | 0.59% |
| Intel Core i5-5300U CPU @ 2.30GHz | 2 | 0.59% |
| Intel Core i5-4200U CPU @ 1.60GHz | 2 | 0.59% |
| Intel Core i5-4200M CPU @ 2.50GHz | 2 | 0.59% |
| Intel Core i5-3230M CPU @ 2.60GHz | 2 | 0.59% |
| Intel Core i5-2400S CPU @ 2.50GHz | 2 | 0.59% |
| Intel Core i3-7020U CPU @ 2.30GHz | 2 | 0.59% |
| Intel Core i3-5005U CPU @ 2.00GHz | 2 | 0.59% |
| Intel Core i3-3110M CPU @ 2.40GHz | 2 | 0.59% |
| Intel Core i3-2310M CPU @ 2.10GHz | 2 | 0.59% |
| Intel Core i3 CPU M 370 @ 2.40GHz | 2 | 0.59% |
CPU Model Family
Processor model prefix


| Model | Computers | Percent |
|---|---|---|
| Intel Core i5 | 63 | 18.48% |
| Intel Core i3 | 43 | 12.61% |
| Intel Core i7 | 32 | 9.38% |
| Intel Core 2 Duo | 20 | 5.87% |
| Intel Celeron | 20 | 5.87% |
| Other | 18 | 5.28% |
| Intel Pentium | 17 | 4.99% |
| AMD Ryzen 7 | 16 | 4.69% |
| AMD Ryzen 5 | 13 | 3.81% |
| Intel Pentium Dual-Core | 9 | 2.64% |
| Intel Xeon | 8 | 2.35% |
| Intel Core 2 Quad | 8 | 2.35% |
| AMD FX | 8 | 2.35% |
| AMD A6 | 6 | 1.76% |
| Intel Atom | 5 | 1.47% |
| AMD Ryzen 9 | 5 | 1.47% |
| AMD A4 | 5 | 1.47% |
| Intel Core 2 | 4 | 1.17% |
| AMD Athlon | 4 | 1.17% |
| AMD Ryzen 3 | 3 | 0.88% |
| Intel Pentium Silver | 2 | 0.59% |
| Intel Genuine | 2 | 0.59% |
| Intel Core i9 | 2 | 0.59% |
| AMD Turion 64 X2 Mobile | 2 | 0.59% |
| AMD Phenom II X4 | 2 | 0.59% |
| AMD Phenom | 2 | 0.59% |
| AMD Athlon II X2 | 2 | 0.59% |
| AMD A8 | 2 | 0.59% |
| AMD A10 | 2 | 0.59% |
| Intel Pentium Gold | 1 | 0.29% |
| Intel Pentium D | 1 | 0.29% |
| Intel Core 2 Extreme | 1 | 0.29% |
| Intel Celeron M | 1 | 0.29% |
| Intel Celeron Dual-Core | 1 | 0.29% |
| AMD Turion X2 Dual-Core Mobile | 1 | 0.29% |
| AMD Sempron | 1 | 0.29% |
| AMD Ryzen Threadripper | 1 | 0.29% |
| AMD PRO A10 | 1 | 0.29% |
| AMD E | 1 | 0.29% |
| AMD C-60 | 1 | 0.29% |
CPU Cores
Number of processor cores


| Number | Computers | Percent |
|---|---|---|
| 2 | 177 | 51.91% |
| 4 | 99 | 29.03% |
| 6 | 21 | 6.16% |
| 8 | 19 | 5.57% |
| 1 | 9 | 2.64% |
| 12 | 7 | 2.05% |
| 3 | 3 | 0.88% |
| 14 | 2 | 0.59% |
| 10 | 2 | 0.59% |
| 28 | 1 | 0.29% |
| 16 | 1 | 0.29% |
CPU Sockets
Number of sockets


| Number | Computers | Percent |
|---|---|---|
| 1 | 339 | 99.41% |
| 2 | 2 | 0.59% |
CPU Threads
Threads per core (Hyper-Threading)


| Number | Computers | Percent |
|---|---|---|
| 2 | 191 | 56.01% |
| 1 | 147 | 43.11% |
| 4 | 2 | 0.59% |
| 8 | 1 | 0.29% |
CPU Op-Modes
CPU Operation Modes (32-bit, 64-bit)


| Op mode | Computers | Percent |
|---|---|---|
| 32-bit, 64-bit | 341 | 100% |
CPU Microcode
Microcode number


| Number | Computers | Percent |
|---|---|---|
| 0x206a7 | 32 | 9.38% |
| 0x306a9 | 28 | 8.21% |
| 0x1067a | 23 | 6.74% |
| 0x306c3 | 18 | 5.28% |
| Unknown | 14 | 4.11% |
| 0x306d4 | 13 | 3.81% |
| 0x40651 | 11 | 3.23% |
| 0x20655 | 10 | 2.93% |
| 0x6fb | 9 | 2.64% |
| 0x10676 | 9 | 2.64% |
| 0x906ea | 8 | 2.35% |
| 0x506e3 | 7 | 2.05% |
| 0x30678 | 7 | 2.05% |
| 0x08108109 | 7 | 2.05% |
| 0x906e9 | 6 | 1.76% |
| 0x806e9 | 5 | 1.47% |
| 0x08701021 | 5 | 1.47% |
| 0x06006705 | 5 | 1.47% |
| 0xa0671 | 4 | 1.17% |
| 0x806ec | 4 | 1.17% |
| 0x806c1 | 4 | 1.17% |
| 0x106ca | 4 | 1.17% |
| 0x0a50000c | 4 | 1.17% |
| 0x08600106 | 4 | 1.17% |
| 0x010000c8 | 4 | 1.17% |
| 0xa0655 | 3 | 0.88% |
| 0x906c0 | 3 | 0.88% |
| 0x706a8 | 3 | 0.88% |
| 0x6f6 | 3 | 0.88% |
| 0x406e3 | 3 | 0.88% |
| 0x106e5 | 3 | 0.88% |
| 0x06003106 | 3 | 0.88% |
| 0x06001119 | 3 | 0.88% |
| 0x02000032 | 3 | 0.88% |
| 0xa0653 | 2 | 0.59% |
| 0xa0652 | 2 | 0.59% |
| 0x6f2 | 2 | 0.59% |
| 0x406c3 | 2 | 0.59% |
| 0x30673 | 2 | 0.59% |
| 0x106a5 | 2 | 0.59% |
CPU Microarch
Microarchitecture


| Name | Computers | Percent |
|---|---|---|
| SandyBridge | 33 | 9.68% |
| Penryn | 33 | 9.68% |
| Haswell | 31 | 9.09% |
| IvyBridge | 28 | 8.21% |
| KabyLake | 27 | 7.92% |
| Core | 15 | 4.4% |
| Broadwell | 14 | 4.11% |
| Zen+ | 13 | 3.81% |
| Silvermont | 12 | 3.52% |
| Zen 3 | 11 | 3.23% |
| Zen 2 | 11 | 3.23% |
| Westmere | 11 | 3.23% |
| Skylake | 11 | 3.23% |
| Unknown | 11 | 3.23% |
| Piledriver | 9 | 2.64% |
| K10 | 8 | 2.35% |
| Excavator | 8 | 2.35% |
| CometLake | 7 | 2.05% |
| Nehalem | 5 | 1.47% |
| TigerLake | 4 | 1.17% |
| K8 & K10 hybrid | 4 | 1.17% |
| Icelake | 4 | 1.17% |
| Goldmont plus | 4 | 1.17% |
| Bonnell | 4 | 1.17% |
| Tremont | 3 | 0.88% |
| Steamroller | 3 | 0.88% |
| K8 Hammer | 3 | 0.88% |
| Zen | 2 | 0.59% |
| Puma | 2 | 0.59% |
| K10 Llano | 2 | 0.59% |
| Bobcat | 2 | 0.59% |
| Alderlake Hybrid | 2 | 0.59% |
| NetBurst | 1 | 0.29% |
| Jaguar | 1 | 0.29% |
| Goldmont | 1 | 0.29% |
| Bulldozer | 1 | 0.29% |
Graphics
GPU Vendor
Vendors of graphics cards


| Vendor | Computers | Percent |
|---|---|---|
| Intel | 188 | 48.08% |
| Nvidia | 103 | 26.34% |
| AMD | 95 | 24.3% |
| ASPEED Technology | 3 | 0.77% |
| Matrox Electronics Systems | 1 | 0.26% |
| Conexant Systems | 1 | 0.26% |
GPU Model
Graphics card models


| Model | Computers | Percent |
|---|---|---|
| Intel 2nd Generation Core Processor Family Integrated Graphics Controller | 30 | 7.54% |
| Intel 3rd Gen Core processor Graphics Controller | 14 | 3.52% |
| Intel Haswell-ULT Integrated Graphics Controller | 11 | 2.76% |
| Intel HD Graphics 5500 | 10 | 2.51% |
| AMD Picasso/Raven 2 [Radeon Vega Series / Radeon Vega Mobile Series] | 10 | 2.51% |
| Intel Mobile 4 Series Chipset Integrated Graphics Controller | 9 | 2.26% |
| Intel Atom Processor Z36xxx/Z37xxx Series Graphics & Display | 9 | 2.26% |
| Intel Core Processor Integrated Graphics Controller | 8 | 2.01% |
| Intel 4 Series Chipset Integrated Graphics Controller | 8 | 2.01% |
| Intel Xeon E3-1200 v3/4th Gen Core Processor Integrated Graphics Controller | 6 | 1.51% |
| Intel HD Graphics 630 | 6 | 1.51% |
| Intel HD Graphics 620 | 6 | 1.51% |
| AMD Stoney [Radeon R2/R3/R4/R5 Graphics] | 6 | 1.51% |
| Nvidia GT218 [GeForce 210] | 5 | 1.26% |
| Intel Xeon E3-1200 v2/3rd Gen Core processor Graphics Controller | 5 | 1.26% |
| Intel TigerLake-H GT1 [UHD Graphics] | 5 | 1.26% |
| Intel CoffeeLake-H GT2 [UHD Graphics 630] | 5 | 1.26% |
| AMD Renoir | 5 | 1.26% |
| AMD Ellesmere [Radeon RX 470/480/570/570X/580/580X/590] | 5 | 1.26% |
| Nvidia GP107M [GeForce GTX 1050 Mobile] | 4 | 1.01% |
| Nvidia GP107 [GeForce GTX 1050 Ti] | 4 | 1.01% |
| Intel TigerLake-LP GT2 [Iris Xe Graphics] | 4 | 1.01% |
| Intel Skylake GT2 [HD Graphics 520] | 4 | 1.01% |
| Intel HD Graphics 530 | 4 | 1.01% |
| Intel 4th Gen Core Processor Integrated Graphics Controller | 4 | 1.01% |
| AMD Cezanne [Radeon Vega Series / Radeon Vega Mobile Series] | 4 | 1.01% |
| AMD Cedar [Radeon HD 5000/6000/7350/8350 Series] | 4 | 1.01% |
| Nvidia GP108 [GeForce GT 1030] | 3 | 0.75% |
| Nvidia GM107 [GeForce GTX 750 Ti] | 3 | 0.75% |
| Nvidia GF117M [GeForce 610M/710M/810M/820M / GT 620M/625M/630M/720M] | 3 | 0.75% |
| Nvidia GA106M [GeForce RTX 3060 Mobile / Max-Q] | 3 | 0.75% |
| Intel WhiskeyLake-U GT2 [UHD Graphics 620] | 3 | 0.75% |
| Intel JasperLake [UHD Graphics] | 3 | 0.75% |
| Intel HD Graphics 6000 | 3 | 0.75% |
| Intel CometLake-S GT2 [UHD Graphics 630] | 3 | 0.75% |
| Intel Atom/Celeron/Pentium Processor x5-E8000/J3xxx/N3xxx Integrated Graphics Controller | 3 | 0.75% |
| Intel Atom Processor D4xx/D5xx/N4xx/N5xx Integrated Graphics Controller | 3 | 0.75% |
| Intel 4th Generation Core Processor Family Integrated Graphics Controller | 3 | 0.75% |
| ASPEED Technology ASPEED Graphics Family | 3 | 0.75% |
| AMD RS780M [Mobility Radeon HD 3200] | 3 | 0.75% |
GPU Combo
Combinations of graphics cards


| Name | Computers | Percent |
|---|---|---|
| 1 x Intel | 137 | 40.18% |
| 1 x AMD | 83 | 24.34% |
| 1 x Nvidia | 58 | 17.01% |
| Intel + Nvidia | 40 | 11.73% |
| 2 x Intel | 5 | 1.47% |
| 2 x AMD | 5 | 1.47% |
| AMD + Nvidia | 4 | 1.17% |
| Intel + AMD | 3 | 0.88% |
| 1 x ASPEED | 2 | 0.59% |
| Other | 1 | 0.29% |
| Nvidia + ASPEED | 1 | 0.29% |
| 1 x Matrox | 1 | 0.29% |
| Intel + Conexant Systems | 1 | 0.29% |
GPU Driver
Free vs proprietary


| Driver | Computers | Percent |
|---|---|---|
| Free | 334 | 97.95% |
| Unknown | 7 | 2.05% |
GPU Memory
Total video memory


| Size in GB | Computers | Percent |
|---|---|---|
| Unknown | 158 | 46.33% |
| 0.01-0.5 | 52 | 15.25% |
| 1.01-2.0 | 47 | 13.78% |
| 0.51-1.0 | 35 | 10.26% |
| 3.01-4.0 | 23 | 6.74% |
| 7.01-8.0 | 16 | 4.69% |
| 5.01-6.0 | 5 | 1.47% |
| 8.01-16.0 | 5 | 1.47% |
Monitor
Monitor Vendor
Monitor vendors


| Vendor | Computers | Percent |
|---|---|---|
| Samsung Electronics | 42 | 12.28% |
| AU Optronics | 37 | 10.82% |
| LG Display | 34 | 9.94% |
| Goldstar | 23 | 6.73% |
| Chimei Innolux | 19 | 5.56% |
| BOE | 19 | 5.56% |
| Dell | 17 | 4.97% |
| Hewlett-Packard | 15 | 4.39% |
| AOC | 12 | 3.51% |
| Acer | 12 | 3.51% |
| Lenovo | 8 | 2.34% |
| BenQ | 8 | 2.34% |
| Ancor Communications | 8 | 2.34% |
| Iiyama | 6 | 1.75% |
| Eizo | 6 | 1.75% |
| Chi Mei Optoelectronics | 6 | 1.75% |
| Philips | 5 | 1.46% |
| Apple | 5 | 1.46% |
| LG Philips | 4 | 1.17% |
| CPT | 4 | 1.17% |
| NEC Computers | 3 | 0.88% |
| InfoVision | 3 | 0.88% |
| Belinea | 3 | 0.88% |
| ASUSTek Computer | 3 | 0.88% |
| Vizio | 2 | 0.58% |
| ViewSonic | 2 | 0.58% |
| Sharp | 2 | 0.58% |
| PANDA | 2 | 0.58% |
| Medion | 2 | 0.58% |
| IBM | 2 | 0.58% |
| Envision Peripherals | 2 | 0.58% |
| Compal | 2 | 0.58% |
| Yuraku | 1 | 0.29% |
| Westinghouse | 1 | 0.29% |
| Unknown | 1 | 0.29% |
| Toshiba | 1 | 0.29% |
| STD | 1 | 0.29% |
| STA | 1 | 0.29% |
| SOT | 1 | 0.29% |
| Sony | 1 | 0.29% |
Monitor Model
Monitor models


| Model | Computers | Percent |
|---|---|---|
| LG Display LCD Monitor LGD039F 1366x768 345x194mm 15.6-inch | 4 | 1.16% |
| LG Display LCD Monitor LGD02DC 1366x768 344x194mm 15.5-inch | 4 | 1.16% |
| Eizo EV3285 ENC2979 3840x2160 698x393mm 31.5-inch | 4 | 1.16% |
| CPT LCD Monitor COR17DB 1600x900 293x164mm 13.2-inch | 4 | 1.16% |
| AU Optronics LCD Monitor AUO21ED 1920x1080 344x193mm 15.5-inch | 4 | 1.16% |
| Chimei Innolux LCD Monitor CMN15F5 1920x1080 344x193mm 15.5-inch | 3 | 0.87% |
| AU Optronics LCD Monitor AUO26EC 1366x768 344x193mm 15.5-inch | 3 | 0.87% |
| Apple Color LCD APPA01B 1440x900 286x179mm 13.3-inch | 3 | 0.87% |
| Samsung Electronics SyncMaster SAM0598 1360x768 410x230mm 18.5-inch | 2 | 0.58% |
| Samsung Electronics LCD Monitor SEC384A 1366x768 344x194mm 15.5-inch | 2 | 0.58% |
| PANDA LCD Monitor NCP004D 1920x1080 344x194mm 15.5-inch | 2 | 0.58% |
| LG Display LCD Monitor LGD045C 1366x768 345x194mm 15.6-inch | 2 | 0.58% |
| LG Display LCD Monitor LGD02D8 1366x768 277x156mm 12.5-inch | 2 | 0.58% |
| Hewlett-Packard S2331 HWP2908 1920x1080 509x286mm 23.0-inch | 2 | 0.58% |
| Goldstar ULTRAGEAR GSM5BB2 1920x1080 527x296mm 23.8-inch | 2 | 0.58% |
| Goldstar HDR 4K GSM7707 3840x2160 600x340mm 27.2-inch | 2 | 0.58% |
| Goldstar FULL HD GSM5B55 1920x1080 480x270mm 21.7-inch | 2 | 0.58% |
| Goldstar 2D HD TV GSM59CA 1366x768 509x286mm 23.0-inch | 2 | 0.58% |
| Chimei Innolux LCD Monitor CMN15D5 1920x1080 344x193mm 15.5-inch | 2 | 0.58% |
| Chimei Innolux LCD Monitor CMN1521 1920x1080 344x193mm 15.5-inch | 2 | 0.58% |
| Chi Mei Optoelectronics LCD Monitor CMO15A3 1366x768 344x193mm 15.5-inch | 2 | 0.58% |
| Chi Mei Optoelectronics LCD Monitor CMO1554 1280x800 331x207mm 15.4-inch | 2 | 0.58% |
| BOE LCD Monitor BOE06A4 1366x768 344x194mm 15.5-inch | 2 | 0.58% |
| Belinea B_101751 MAX06AD 1280x1024 338x270mm 17.0-inch | 2 | 0.58% |
| AU Optronics LCD Monitor AUO38ED 1920x1080 344x193mm 15.5-inch | 2 | 0.58% |
| AU Optronics LCD Monitor AUO36ED 1920x1080 344x193mm 15.5-inch | 2 | 0.58% |
| AU Optronics LCD Monitor AUO2174 1280x800 331x207mm 15.4-inch | 2 | 0.58% |
| AU Optronics LCD Monitor AUO12EC 1366x768 344x193mm 15.5-inch | 2 | 0.58% |
| Ancor Communications VS278 ACI27A1 1920x1080 598x336mm 27.0-inch | 2 | 0.58% |
| Ancor Communications ASUS VS228 ACI22FD 1920x1080 476x268mm 21.5-inch | 2 | 0.58% |
| Acer K272HL ACR0523 1920x1080 598x336mm 27.0-inch | 2 | 0.58% |
| Yuraku YM19APR FAC01C6 1440x900 410x257mm 19.1-inch | 1 | 0.29% |
| Westinghouse LCM-17v8 WDE1708 1280x1024 338x270mm 17.0-inch | 1 | 0.29% |
| Vizio D32f-G1 VIZ1027 1920x1080 698x392mm 31.5-inch | 1 | 0.29% |
| Vizio D24f4-J01 VIZ1044 1920x1080 527x296mm 23.8-inch | 1 | 0.29% |
| ViewSonic VP2365WB VSC7123 1920x1080 509x286mm 23.0-inch | 1 | 0.29% |
| ViewSonic VA2238 SERIES VSC6E26 1920x1080 477x268mm 21.5-inch | 1 | 0.29% |
| Unknown LCD Monitor FFFF 2288x1287 2550x2550mm 142.0-inch | 1 | 0.29% |
| Toshiba LX900T LCD039A 1440x900 410x256mm 19.0-inch | 1 | 0.29% |
| STD LED STD0110 1920x1080 480x260mm 21.5-inch | 1 | 0.29% |
Monitor Resolution
Monitor screen resolution


| Resolution | Computers | Percent |
|---|---|---|
| 1920x1080 (FHD) | 134 | 39.88% |
| 1366x768 (WXGA) | 72 | 21.43% |
| 1600x900 (HD+) | 21 | 6.25% |
| 1280x1024 (SXGA) | 18 | 5.36% |
| 3840x2160 (4K) | 14 | 4.17% |
| 1680x1050 (WSXGA+) | 14 | 4.17% |
| 1440x900 (WXGA+) | 14 | 4.17% |
| 1280x800 (WXGA) | 12 | 3.57% |
| 2560x1440 (QHD) | 10 | 2.98% |
| 1920x1200 (WUXGA) | 7 | 2.08% |
| 1360x768 | 7 | 2.08% |
| 2560x1600 | 3 | 0.89% |
| 2560x1080 | 3 | 0.89% |
| 3440x1440 | 1 | 0.3% |
| 2736x1824 | 1 | 0.3% |
| 2288x1287 | 1 | 0.3% |
| 2048x1152 | 1 | 0.3% |
| 1920x540 | 1 | 0.3% |
| 1600x1200 | 1 | 0.3% |
| 1280x768 | 1 | 0.3% |
Monitor Diagonal
Diagonal size in inches


| Inches | Computers | Percent |
|---|---|---|
| 15 | 93 | 27.19% |
| 23 | 31 | 9.06% |
| 27 | 26 | 7.6% |
| 17 | 26 | 7.6% |
| 21 | 23 | 6.73% |
| 24 | 18 | 5.26% |
| 13 | 18 | 5.26% |
| 14 | 16 | 4.68% |
| 22 | 12 | 3.51% |
| 19 | 12 | 3.51% |
| 12 | 12 | 3.51% |
| 18 | 10 | 2.92% |
| 31 | 9 | 2.63% |
| 20 | 9 | 2.63% |
| 40 | 3 | 0.88% |
| 34 | 3 | 0.88% |
| 16 | 3 | 0.88% |
| 11 | 3 | 0.88% |
| 26 | 2 | 0.58% |
| Unknown | 2 | 0.58% |
| 142 | 1 | 0.29% |
| 65 | 1 | 0.29% |
| 49 | 1 | 0.29% |
| 48 | 1 | 0.29% |
| 42 | 1 | 0.29% |
| 37 | 1 | 0.29% |
| 35 | 1 | 0.29% |
| 33 | 1 | 0.29% |
| 32 | 1 | 0.29% |
| 29 | 1 | 0.29% |
| 28 | 1 | 0.29% |
Monitor Width
Physical width


| Width in mm | Computers | Percent |
|---|---|---|
| 301-350 | 127 | 37.57% |
| 501-600 | 74 | 21.89% |
| 401-500 | 56 | 16.57% |
| 351-400 | 26 | 7.69% |
| 201-300 | 26 | 7.69% |
| 601-700 | 12 | 3.55% |
| 701-800 | 6 | 1.78% |
| 801-900 | 4 | 1.18% |
| 1001-1500 | 3 | 0.89% |
| Unknown | 2 | 0.59% |
| More than 2000 | 1 | 0.3% |
| 901-1000 | 1 | 0.3% |
Aspect Ratio
Proportional relationship between the width and the height


| Ratio | Computers | Percent |
|---|---|---|
| 16/9 | 247 | 75.77% |
| 16/10 | 51 | 15.64% |
| 5/4 | 18 | 5.52% |
| 4/3 | 4 | 1.23% |
| 21/9 | 4 | 1.23% |
| 3/2 | 1 | 0.31% |
| 1.00 | 1 | 0.31% |
Monitor Area
Area in inch²


| Area in inch² | Computers | Percent |
|---|---|---|
| 101-110 | 94 | 27.57% |
| 201-250 | 72 | 21.11% |
| 151-200 | 31 | 9.09% |
| 301-350 | 27 | 7.92% |
| 81-90 | 26 | 7.62% |
| 141-150 | 17 | 4.99% |
| 351-500 | 15 | 4.4% |
| 121-130 | 13 | 3.81% |
| 61-70 | 11 | 3.23% |
| 71-80 | 9 | 2.64% |
| 251-300 | 6 | 1.76% |
| 501-1000 | 6 | 1.76% |
| More than 1000 | 4 | 1.17% |
| 131-140 | 4 | 1.17% |
| 51-60 | 3 | 0.88% |
| Unknown | 2 | 0.59% |
| 111-120 | 1 | 0.29% |
Pixel Density
Pixels per inch


| Density | Computers | Percent |
|---|---|---|
| 51-100 | 149 | 44.88% |
| 101-120 | 91 | 27.41% |
| 121-160 | 68 | 20.48% |
| 161-240 | 13 | 3.92% |
| 1-50 | 7 | 2.11% |
| More than 240 | 2 | 0.6% |
| Unknown | 2 | 0.6% |
Multiple Monitors
Total monitors connected


| Total | Computers | Percent |
|---|---|---|
| 1 | 309 | 90.62% |
| 2 | 28 | 8.21% |
| 0 | 4 | 1.17% |
Network
Net Controller Vendor
Controller vendors


| Vendor | Computers | Percent |
|---|---|---|
| Realtek Semiconductor | 193 | 37.84% |
| Intel | 126 | 24.71% |
| Qualcomm Atheros | 80 | 15.69% |
| Broadcom | 23 | 4.51% |
| Marvell Technology Group | 11 | 2.16% |
| Broadcom Limited | 9 | 1.76% |
| Ralink Technology | 7 | 1.37% |
| MediaTek | 7 | 1.37% |
| Samsung Electronics | 6 | 1.18% |
| Ralink | 6 | 1.18% |
| Nvidia | 6 | 1.18% |
| TP-Link | 5 | 0.98% |
| JMicron Technology | 4 | 0.78% |
| Belkin Components | 3 | 0.59% |
| T & A Mobile Phones | 2 | 0.39% |
| Qualcomm Atheros Communications | 2 | 0.39% |
| Huawei Technologies | 2 | 0.39% |
| Hewlett-Packard | 2 | 0.39% |
| Ericsson Business Mobile Networks | 2 | 0.39% |
| ASUSTek Computer | 2 | 0.39% |
| Sweex | 1 | 0.2% |
| Spreadtrum Communications | 1 | 0.2% |
| Sierra Wireless | 1 | 0.2% |
| PLANEX | 1 | 0.2% |
| Mellanox Technologies | 1 | 0.2% |
| IMC Networks | 1 | 0.2% |
| HTC (High Tech Computer) | 1 | 0.2% |
| Edimax Technology | 1 | 0.2% |
| DisplayLink | 1 | 0.2% |
| Davicom Semiconductor | 1 | 0.2% |
| Attansic Technology | 1 | 0.2% |
| ASIX Electronics | 1 | 0.2% |
Net Controller Model
Controller models


| Model | Computers | Percent |
|---|---|---|
| Realtek RTL8111/8168/8411 PCI Express Gigabit Ethernet Controller | 132 | 22.68% |
| Realtek RTL810xE PCI Express Fast Ethernet controller | 20 | 3.44% |
| Qualcomm Atheros AR9485 Wireless Network Adapter | 13 | 2.23% |
| Realtek RTL8125 2.5GbE Controller | 11 | 1.89% |
| Qualcomm Atheros QCA9565 / AR9565 Wireless Network Adapter | 11 | 1.89% |
| Qualcomm Atheros AR9285 Wireless Network Adapter (PCI-Express) | 11 | 1.89% |
| Intel Wi-Fi 6 AX200 | 9 | 1.55% |
| Realtek RTL8821CE 802.11ac PCIe Wireless Network Adapter | 7 | 1.2% |
| Qualcomm Atheros QCA9377 802.11ac Wireless Network Adapter | 7 | 1.2% |
| Qualcomm Atheros AR8162 Fast Ethernet | 7 | 1.2% |
| Intel I211 Gigabit Network Connection | 7 | 1.2% |
| Intel Ethernet Connection I217-LM | 7 | 1.2% |
| Intel 82579LM Gigabit Network Connection (Lewisville) | 7 | 1.2% |
| Samsung Galaxy series, misc. (tethering mode) | 6 | 1.03% |
| Realtek RTL8188CE 802.11b/g/n WiFi Adapter | 6 | 1.03% |
| Intel Tiger Lake PCH CNVi WiFi | 6 | 1.03% |
| Intel Centrino Advanced-N 6205 [Taylor Peak] | 6 | 1.03% |
| Realtek Killer E2600 Gigabit Ethernet Controller | 5 | 0.86% |
| Intel Wireless 7265 | 5 | 0.86% |
| Intel Wireless 3165 | 5 | 0.86% |
| Intel 82567LM-3 Gigabit Network Connection | 5 | 0.86% |
| Broadcom Limited BCM4360 802.11ac Wireless Network Adapter | 5 | 0.86% |
| Broadcom BCM4313 802.11bgn Wireless Network Adapter | 5 | 0.86% |
| Realtek RTL8723BE PCIe Wireless Network Adapter | 4 | 0.69% |
| Realtek RTL8153 Gigabit Ethernet Adapter | 4 | 0.69% |
| Realtek RTL-8100/8101L/8139 PCI Fast Ethernet Adapter | 4 | 0.69% |
| Qualcomm Atheros QCA6174 802.11ac Wireless Network Adapter | 4 | 0.69% |
| Qualcomm Atheros AR9462 Wireless Network Adapter | 4 | 0.69% |
| Qualcomm Atheros AR8131 Gigabit Ethernet | 4 | 0.69% |
| Intel PRO/Wireless 3945ABG [Golan] Network Connection | 4 | 0.69% |
| Intel Ethernet Controller I225-V | 4 | 0.69% |
| Intel Dual Band Wireless-AC 3168NGW [Stone Peak] | 4 | 0.69% |
| Intel Cannon Lake PCH CNVi WiFi | 4 | 0.69% |
| Intel 82579V Gigabit Network Connection | 4 | 0.69% |
| Realtek RTL8822CE 802.11ac PCIe Wireless Network Adapter | 3 | 0.52% |
| Realtek RTL8188EE Wireless Network Adapter | 3 | 0.52% |
| Ralink MT7601U Wireless Adapter | 3 | 0.52% |
| Ralink RT3290 Wireless 802.11n 1T/1R PCIe | 3 | 0.52% |
| Qualcomm Atheros Attansic L1 Gigabit Ethernet | 3 | 0.52% |
| Qualcomm Atheros AR928X Wireless Network Adapter (PCI-Express) | 3 | 0.52% |
Wireless Vendor
Wireless vendors


| Vendor | Computers | Percent |
|---|---|---|
| Intel | 86 | 35.25% |
| Qualcomm Atheros | 62 | 25.41% |
| Realtek Semiconductor | 38 | 15.57% |
| Broadcom | 12 | 4.92% |
| Ralink Technology | 7 | 2.87% |
| MediaTek | 7 | 2.87% |
| Broadcom Limited | 7 | 2.87% |
| Ralink | 6 | 2.46% |
| TP-Link | 4 | 1.64% |
| Belkin Components | 3 | 1.23% |
| Qualcomm Atheros Communications | 2 | 0.82% |
| Hewlett-Packard | 2 | 0.82% |
| ASUSTek Computer | 2 | 0.82% |
| Sweex | 1 | 0.41% |
| Sierra Wireless | 1 | 0.41% |
| PLANEX | 1 | 0.41% |
| Marvell Technology Group | 1 | 0.41% |
| IMC Networks | 1 | 0.41% |
| Edimax Technology | 1 | 0.41% |
Wireless Model
Wireless models


| Model | Computers | Percent |
|---|---|---|
| Qualcomm Atheros AR9485 Wireless Network Adapter | 13 | 5.33% |
| Qualcomm Atheros QCA9565 / AR9565 Wireless Network Adapter | 11 | 4.51% |
| Qualcomm Atheros AR9285 Wireless Network Adapter (PCI-Express) | 11 | 4.51% |
| Intel Wi-Fi 6 AX200 | 9 | 3.69% |
| Realtek RTL8821CE 802.11ac PCIe Wireless Network Adapter | 7 | 2.87% |
| Qualcomm Atheros QCA9377 802.11ac Wireless Network Adapter | 7 | 2.87% |
| Realtek RTL8188CE 802.11b/g/n WiFi Adapter | 6 | 2.46% |
| Intel Tiger Lake PCH CNVi WiFi | 6 | 2.46% |
| Intel Centrino Advanced-N 6205 [Taylor Peak] | 6 | 2.46% |
| Intel Wireless 7265 | 5 | 2.05% |
| Intel Wireless 3165 | 5 | 2.05% |
| Broadcom Limited BCM4360 802.11ac Wireless Network Adapter | 5 | 2.05% |
| Broadcom BCM4313 802.11bgn Wireless Network Adapter | 5 | 2.05% |
| Realtek RTL8723BE PCIe Wireless Network Adapter | 4 | 1.64% |
| Qualcomm Atheros QCA6174 802.11ac Wireless Network Adapter | 4 | 1.64% |
| Qualcomm Atheros AR9462 Wireless Network Adapter | 4 | 1.64% |
| Intel PRO/Wireless 3945ABG [Golan] Network Connection | 4 | 1.64% |
| Intel Dual Band Wireless-AC 3168NGW [Stone Peak] | 4 | 1.64% |
| Intel Cannon Lake PCH CNVi WiFi | 4 | 1.64% |
| Realtek RTL8822CE 802.11ac PCIe Wireless Network Adapter | 3 | 1.23% |
| Realtek RTL8188EE Wireless Network Adapter | 3 | 1.23% |
| Ralink MT7601U Wireless Adapter | 3 | 1.23% |
| Ralink RT3290 Wireless 802.11n 1T/1R PCIe | 3 | 1.23% |
| Qualcomm Atheros AR928X Wireless Network Adapter (PCI-Express) | 3 | 1.23% |
| MediaTek MT7921 802.11ax PCI Express Wireless Network Adapter | 3 | 1.23% |
| Intel Wireless 8260 | 3 | 1.23% |
| Intel Wireless 7260 | 3 | 1.23% |
| Intel Wi-Fi 6 AX210/AX211/AX411 160MHz | 3 | 1.23% |
| Intel Wi-Fi 6 AX201 | 3 | 1.23% |
| Intel Comet Lake PCH CNVi WiFi | 3 | 1.23% |
| Realtek RTL8852AE 802.11ax PCIe Wireless Network Adapter | 2 | 0.82% |
| Realtek RTL8821AE 802.11ac PCIe Wireless Network Adapter | 2 | 0.82% |
| Ralink RT2870/RT3070 Wireless Adapter | 2 | 0.82% |
| Qualcomm Atheros AR9271 802.11n | 2 | 0.82% |
| Qualcomm Atheros AR93xx Wireless Network Adapter | 2 | 0.82% |
| Qualcomm Atheros AR9287 Wireless Network Adapter (PCI-Express) | 2 | 0.82% |
| Qualcomm Atheros AR242x / AR542x Wireless Network Adapter (PCI-Express) | 2 | 0.82% |
| MediaTek MT7921K (RZ608) Wi-Fi 6E 80MHz | 2 | 0.82% |
| Intel Wireless-AC 9260 | 2 | 0.82% |
| Intel Wireless 8265 / 8275 | 2 | 0.82% |
Ethernet Vendor
Ethernet vendors


| Vendor | Computers | Percent |
|---|---|---|
| Realtek Semiconductor | 177 | 54.63% |
| Intel | 71 | 21.91% |
| Qualcomm Atheros | 26 | 8.02% |
| Broadcom | 12 | 3.7% |
| Marvell Technology Group | 10 | 3.09% |
| Samsung Electronics | 6 | 1.85% |
| Nvidia | 6 | 1.85% |
| JMicron Technology | 4 | 1.23% |
| Huawei Technologies | 2 | 0.62% |
| Broadcom Limited | 2 | 0.62% |
| TP-Link | 1 | 0.31% |
| Spreadtrum Communications | 1 | 0.31% |
| Mellanox Technologies | 1 | 0.31% |
| HTC (High Tech Computer) | 1 | 0.31% |
| DisplayLink | 1 | 0.31% |
| Davicom Semiconductor | 1 | 0.31% |
| Attansic Technology | 1 | 0.31% |
| ASIX Electronics | 1 | 0.31% |
Ethernet Model
Ethernet models


| Model | Computers | Percent |
|---|---|---|
| Realtek RTL8111/8168/8411 PCI Express Gigabit Ethernet Controller | 132 | 39.52% |
| Realtek RTL810xE PCI Express Fast Ethernet controller | 20 | 5.99% |
| Realtek RTL8125 2.5GbE Controller | 11 | 3.29% |
| Qualcomm Atheros AR8162 Fast Ethernet | 7 | 2.1% |
| Intel I211 Gigabit Network Connection | 7 | 2.1% |
| Intel Ethernet Connection I217-LM | 7 | 2.1% |
| Intel 82579LM Gigabit Network Connection (Lewisville) | 7 | 2.1% |
| Samsung Galaxy series, misc. (tethering mode) | 6 | 1.8% |
| Realtek Killer E2600 Gigabit Ethernet Controller | 5 | 1.5% |
| Intel 82567LM-3 Gigabit Network Connection | 5 | 1.5% |
| Realtek RTL8153 Gigabit Ethernet Adapter | 4 | 1.2% |
| Realtek RTL-8100/8101L/8139 PCI Fast Ethernet Adapter | 4 | 1.2% |
| Qualcomm Atheros AR8131 Gigabit Ethernet | 4 | 1.2% |
| Intel Ethernet Controller I225-V | 4 | 1.2% |
| Intel 82579V Gigabit Network Connection | 4 | 1.2% |
| Qualcomm Atheros Attansic L1 Gigabit Ethernet | 3 | 0.9% |
| Qualcomm Atheros AR8151 v2.0 Gigabit Ethernet | 3 | 0.9% |
| Marvell Group 88E8040 PCI-E Fast Ethernet Controller | 3 | 0.9% |
| Intel Ethernet Connection (3) I218-LM | 3 | 0.9% |
| Intel Ethernet Connection (2) I219-V | 3 | 0.9% |
| Intel Ethernet Connection (14) I219-V | 3 | 0.9% |
| Intel 82574L Gigabit Network Connection | 3 | 0.9% |
| Broadcom NetLink BCM57780 Gigabit Ethernet PCIe | 3 | 0.9% |
| Realtek RTL8152 Fast Ethernet Adapter | 2 | 0.6% |
| Qualcomm Atheros AR8152 v1.1 Fast Ethernet | 2 | 0.6% |
| Qualcomm Atheros AR8121/AR8113/AR8114 Gigabit or Fast Ethernet | 2 | 0.6% |
| Nvidia MCP51 Ethernet Controller | 2 | 0.6% |
| Marvell Group 88E8057 PCI-E Gigabit Ethernet Controller | 2 | 0.6% |
| Marvell Group 88E8056 PCI-E Gigabit Ethernet Controller | 2 | 0.6% |
| JMicron JMC260 PCI Express Fast Ethernet Controller | 2 | 0.6% |
| JMicron JMC250 PCI Express Gigabit Ethernet Controller | 2 | 0.6% |
| Intel I210 Gigabit Network Connection | 2 | 0.6% |
| Intel Ethernet Connection I218-LM | 2 | 0.6% |
| Intel Ethernet Connection (4) I219-LM | 2 | 0.6% |
| Intel Ethernet Connection (2) I219-LM | 2 | 0.6% |
| Intel 82577LM Gigabit Network Connection | 2 | 0.6% |
| Intel 82573L Gigabit Ethernet Controller | 2 | 0.6% |
| Intel 82567LM Gigabit Network Connection | 2 | 0.6% |
| Intel 82562V-2 10/100 Network Connection | 2 | 0.6% |
| Broadcom NetXtreme BCM57765 Gigabit Ethernet PCIe | 2 | 0.6% |
Net Controller Kind
Ethernet, WiFi or modem


| Kind | Computers | Percent |
|---|---|---|
| Ethernet | 312 | 56.73% |
| WiFi | 234 | 42.55% |
| Modem | 2 | 0.36% |
| Unknown | 2 | 0.36% |
Used Controller
Currently used network controller


| Kind | Computers | Percent |
|---|---|---|
| Ethernet | 190 | 58.82% |
| WiFi | 133 | 41.18% |
NICs
Total network controllers on board


| Total | Computers | Percent |
|---|---|---|
| 2 | 190 | 55.72% |
| 1 | 140 | 41.06% |
| 0 | 5 | 1.47% |
| 4 | 3 | 0.88% |
| 3 | 3 | 0.88% |
IPv6
IPv6 vs IPv4


| Used | Computers | Percent |
|---|---|---|
| No | 243 | 71.26% |
| Yes | 98 | 28.74% |
Bluetooth
Bluetooth Vendor
Controller vendors


| Vendor | Computers | Percent |
|---|---|---|
| Intel | 64 | 37.87% |
| Realtek Semiconductor | 14 | 8.28% |
| Cambridge Silicon Radio | 13 | 7.69% |
| Qualcomm Atheros Communications | 12 | 7.1% |
| Broadcom | 11 | 6.51% |
| Lite-On Technology | 9 | 5.33% |
| IMC Networks | 9 | 5.33% |
| Foxconn / Hon Hai | 8 | 4.73% |
| Apple | 8 | 4.73% |
| Toshiba | 3 | 1.78% |
| Ralink | 3 | 1.78% |
| TP-Link | 2 | 1.18% |
| MediaTek | 2 | 1.18% |
| Dell | 2 | 1.18% |
| SINO WEALTH | 1 | 0.59% |
| Realtek | 1 | 0.59% |
| Marvell Semiconductor | 1 | 0.59% |
| Integrated System Solution | 1 | 0.59% |
| Hewlett-Packard | 1 | 0.59% |
| Fujitsu | 1 | 0.59% |
| Foxconn International | 1 | 0.59% |
| Edimax Technology | 1 | 0.59% |
| ASUSTek Computer | 1 | 0.59% |
Bluetooth Model
Controller models


| Model | Computers | Percent |
|---|---|---|
| Intel Bluetooth wireless interface | 21 | 12.35% |
| Intel AX201 Bluetooth | 13 | 7.65% |
| Cambridge Silicon Radio Bluetooth Dongle (HCI mode) | 13 | 7.65% |
| Realtek Bluetooth Radio | 9 | 5.29% |
| Intel AX200 Bluetooth | 8 | 4.71% |
| Intel Bluetooth 9460/9560 Jefferson Peak (JfP) | 7 | 4.12% |
| IMC Networks Bluetooth Radio | 6 | 3.53% |
| Apple Bluetooth USB Host Controller | 6 | 3.53% |
| Qualcomm Atheros AR3012 Bluetooth 4.0 | 5 | 2.94% |
| Lite-On Qualcomm Atheros QCA9377 Bluetooth | 5 | 2.94% |
| Intel Wireless-AC 3168 Bluetooth | 4 | 2.35% |
| Intel Centrino Bluetooth Wireless Transceiver | 4 | 2.35% |
| Realtek Bluetooth 4.2 Adapter | 3 | 1.76% |
| Ralink RT3290 Bluetooth | 3 | 1.76% |
| Qualcomm Atheros AR3011 Bluetooth | 3 | 1.76% |
| Lite-On Bluetooth Device | 3 | 1.76% |
| Intel AX210 Bluetooth | 3 | 1.76% |
| TP-Link UB500 Adapter | 2 | 1.18% |
| Qualcomm Atheros Bluetooth Device | 2 | 1.18% |
| Qualcomm Atheros QCA61x4 Bluetooth 4.0 | 2 | 1.18% |
| MediaTek Wireless_Device | 2 | 1.18% |
| Intel Wireless-AC 9260 Bluetooth Adapter | 2 | 1.18% |
| IMC Networks Bluetooth Device | 2 | 1.18% |
| Foxconn / Hon Hai Wireless_Device | 2 | 1.18% |
| Foxconn / Hon Hai Broadcom Bluetooth 2.1 Device | 2 | 1.18% |
| Foxconn / Hon Hai Bluetooth Device | 2 | 1.18% |
| Dell DW375 Bluetooth Module | 2 | 1.18% |
| Broadcom BCM20702 Bluetooth 4.0 [ThinkPad] | 2 | 1.18% |
| Broadcom BCM2045B (BDC-2.1) | 2 | 1.18% |
| Apple Built-in Bluetooth 2.0+EDR HCI | 2 | 1.18% |
| Toshiba Bluetooth Device | 1 | 0.59% |
| Toshiba Askey for | 1 | 0.59% |
| Toshiba Askey Bluetooth Module | 1 | 0.59% |
| SINO WEALTH RK Bluetooth Keyboar | 1 | 0.59% |
| Realtek RTL8821A Bluetooth | 1 | 0.59% |
| Realtek RTL8723B Bluetooth | 1 | 0.59% |
| Realtek Bluetooth Radio | 1 | 0.59% |
| Qualcomm Atheros AR3011 Bluetooth (no firmware) | 1 | 0.59% |
| Marvell Bluetooth and Wireless LAN Composite | 1 | 0.59% |
| Lite-On Wireless_Device | 1 | 0.59% |
Sound
Sound Vendor
Sound card vendors


| Vendor | Computers | Percent |
|---|---|---|
| Intel | 249 | 54.37% |
| AMD | 102 | 22.27% |
| Nvidia | 76 | 16.59% |
| C-Media Electronics | 7 | 1.53% |
| Creative Labs | 4 | 0.87% |
| Texas Instruments | 2 | 0.44% |
| Logitech | 2 | 0.44% |
| JMTek | 2 | 0.44% |
| Yamaha | 1 | 0.22% |
| TTGK Technology | 1 | 0.22% |
| Thesycon Systemsoftware & Consulting | 1 | 0.22% |
| SteelSeries ApS | 1 | 0.22% |
| OPPO Electronics | 1 | 0.22% |
| Micro Star International | 1 | 0.22% |
| KTMicro | 1 | 0.22% |
| Hewlett-Packard | 1 | 0.22% |
| GN Netcom | 1 | 0.22% |
| Giga-Byte Technology | 1 | 0.22% |
| Generalplus Technology | 1 | 0.22% |
| Focusrite-Novation | 1 | 0.22% |
| Ensoniq | 1 | 0.22% |
| CMX Systems | 1 | 0.22% |
Sound Model
Sound card models


| Model | Computers | Percent |
|---|---|---|
| Intel 7 Series/C216 Chipset Family High Definition Audio Controller | 30 | 5.4% |
| Intel 6 Series/C200 Series Chipset Family High Definition Audio Controller | 27 | 4.86% |
| AMD Family 17h/19h HD Audio Controller | 24 | 4.32% |
| AMD SBx00 Azalia (Intel HDA) | 20 | 3.6% |
| Intel 82801I (ICH9 Family) HD Audio Controller | 18 | 3.24% |
| Intel NM10/ICH7 Family High Definition Audio Controller | 17 | 3.06% |
| Intel 8 Series/C220 Series Chipset High Definition Audio Controller | 17 | 3.06% |
| Intel 5 Series/3400 Series Chipset High Definition Audio | 14 | 2.52% |
| Intel Xeon E3-1200 v3/4th Gen Core Processor HD Audio Controller | 13 | 2.34% |
| Intel Broadwell-U Audio Controller | 13 | 2.34% |
| Intel Wildcat Point-LP High Definition Audio Controller | 12 | 2.16% |
| Intel Haswell-ULT HD Audio Controller | 11 | 1.98% |
| Intel 8 Series HD Audio Controller | 11 | 1.98% |
| AMD Starship/Matisse HD Audio Controller | 11 | 1.98% |
| AMD Renoir Radeon High Definition Audio Controller | 11 | 1.98% |
| AMD FCH Azalia Controller | 11 | 1.98% |
| Intel Sunrise Point-LP HD Audio | 10 | 1.8% |
| AMD Raven/Raven2/Fenghuang HDMI/DP Audio Controller | 10 | 1.8% |
| Intel Tiger Lake-H HD Audio Controller | 9 | 1.62% |
| Intel Atom Processor Z36xxx/Z37xxx Series High Definition Audio Controller | 9 | 1.62% |
| Nvidia High Definition Audio Controller | 8 | 1.44% |
| Nvidia GF108 High Definition Audio Controller | 8 | 1.44% |
| Intel 100 Series/C230 Series Chipset Family HD Audio Controller | 8 | 1.44% |
| AMD Family 15h (Models 60h-6fh) Audio Controller | 8 | 1.44% |
| Intel 82801JI (ICH10 Family) HD Audio Controller | 7 | 1.26% |
| Nvidia GK208 HDMI/DP Audio Controller | 6 | 1.08% |
| Nvidia GA104 High Definition Audio Controller | 6 | 1.08% |
| Intel Cannon Lake PCH cAVS | 6 | 1.08% |
| AMD High Definition Audio Controller | 6 | 1.08% |
| AMD Cedar HDMI Audio [Radeon HD 5400/6300/7300 Series] | 6 | 1.08% |
| Nvidia GP107GL High Definition Audio Controller | 5 | 0.9% |
| Nvidia GM107 High Definition Audio Controller [GeForce 940MX] | 5 | 0.9% |
| Intel 82801JD/DO (ICH10 Family) HD Audio Controller | 5 | 0.9% |
| AMD Navi 21/23 HDMI/DP Audio Controller | 5 | 0.9% |
| AMD Family 17h (Models 00h-0fh) HD Audio Controller | 5 | 0.9% |
| AMD Ellesmere HDMI Audio [Radeon RX 470/480 / 570/580/590] | 5 | 0.9% |
| AMD Baffin HDMI/DP Audio [Radeon RX 550 640SP / RX 560/560X] | 5 | 0.9% |
| Nvidia GA106 High Definition Audio Controller | 4 | 0.72% |
| Intel Tiger Lake-LP Smart Sound Technology Audio Controller | 4 | 0.72% |
| Intel Comet Lake PCH cAVS | 4 | 0.72% |
Memory
Memory Vendor
Memory module vendors


| Vendor | Computers | Percent |
|---|---|---|
| Samsung Electronics | 91 | 22.41% |
| Unknown | 58 | 14.29% |
| SK hynix | 57 | 14.04% |
| Kingston | 49 | 12.07% |
| Micron Technology | 32 | 7.88% |
| Crucial | 27 | 6.65% |
| A-DATA Technology | 13 | 3.2% |
| Corsair | 11 | 2.71% |
| Elpida | 10 | 2.46% |
| G.Skill | 8 | 1.97% |
| Unknown | 6 | 1.48% |
| Smart | 4 | 0.99% |
| Ramaxel Technology | 4 | 0.99% |
| Nanya Technology | 4 | 0.99% |
| Patriot | 3 | 0.74% |
| GOODRAM | 3 | 0.74% |
| AMD | 3 | 0.74% |
| Teikon | 2 | 0.49% |
| Silicon Power | 2 | 0.49% |
| Unknown (ABCD) | 1 | 0.25% |
| Unknown (0x4D342037305435363633515A332D43453620) | 1 | 0.25% |
| Unknown (0x0DD5) | 1 | 0.25% |
| Toshiba | 1 | 0.25% |
| Timetec | 1 | 0.25% |
| Team | 1 | 0.25% |
| Super Talent | 1 | 0.25% |
| SHARETRONIC | 1 | 0.25% |
| PNY | 1 | 0.25% |
| Patriot Memory (PDP Systems) | 1 | 0.25% |
| Patriot Memory | 1 | 0.25% |
| Kllisre | 1 | 0.25% |
| Kingmax | 1 | 0.25% |
| Kembona | 1 | 0.25% |
| GSkill | 1 | 0.25% |
| Avant | 1 | 0.25% |
| Atermiter | 1 | 0.25% |
| Apacer | 1 | 0.25% |
| 48spaces | 1 | 0.25% |
Memory Model
Memory module models


| Model | Computers | Percent |
|---|---|---|
| Samsung RAM M471B5273CH0-CK0 4GB SODIMM DDR3 1600MT/s | 6 | 1.39% |
| Unknown | 6 | 1.39% |
| Unknown RAM Module 2GB SODIMM DDR2 667MT/s | 5 | 1.15% |
| SK hynix RAM HMT451S6BFR8A-PB 4GB SODIMM DDR3 1600MT/s | 5 | 1.15% |
| Samsung RAM M471A5244CB0-CTD 4GB SODIMM DDR4 3266MT/s | 5 | 1.15% |
| SK hynix RAM HMA81GS6AFR8N-UH 8GB SODIMM DDR4 2667MT/s | 4 | 0.92% |
| Samsung RAM M471B5273CH0-CH9 4GB SODIMM DDR3 1334MT/s | 4 | 0.92% |
| Samsung RAM M471B5173DB0-YK0 4GB SODIMM DDR3 1600MT/s | 4 | 0.92% |
| Micron RAM Module 4GB SODIMM DDR3 1600MT/s | 4 | 0.92% |
| Elpida RAM Module 2GB SODIMM DDR3 1333MT/s | 4 | 0.92% |
| Unknown RAM Module 4GB DIMM DDR3 1333MT/s | 3 | 0.69% |
| Unknown RAM Module 2GB DIMM SDRAM | 3 | 0.69% |
| Unknown RAM Module 2GB DIMM DDR2 800MT/s | 3 | 0.69% |
| Unknown RAM Module 2GB DIMM 800MT/s | 3 | 0.69% |
| Unknown RAM Module 1GB DIMM DDR2 800MT/s | 3 | 0.69% |
| SK hynix RAM HMT425S6AFR6A-PB 2GB SODIMM DDR3 3200MT/s | 3 | 0.69% |
| SK hynix RAM HMT41GS6BFR8A-PB 8GB SODIMM DDR3 1600MT/s | 3 | 0.69% |
| SK hynix RAM HMT351S6EFR8C-PB 4GB SODIMM DDR3 1600MT/s | 3 | 0.69% |
| Samsung RAM M471B5273DH0-CH9 4096MB SODIMM DDR3 1334MT/s | 3 | 0.69% |
| Samsung RAM M471B5173QH0-YK0 4GB SODIMM DDR3 1600MT/s | 3 | 0.69% |
| Samsung RAM M471A1K43EB1-CWE 8GB SODIMM DDR4 3200MT/s | 3 | 0.69% |
| Samsung RAM M471A1K43CB1-CTD 8GB SODIMM DDR4 2667MT/s | 3 | 0.69% |
| Samsung RAM M378B5173QH0-CK0 4GB DIMM DDR3 1600MT/s | 3 | 0.69% |
| Unknown RAM Module 8GB DIMM DDR3 1333MT/s | 2 | 0.46% |
| Unknown RAM Module 512MB SODIMM DDR2 667MT/s | 2 | 0.46% |
| Unknown RAM Module 4GB DIMM 1333MT/s | 2 | 0.46% |
| Unknown RAM Module 4GB DIMM 1066MT/s | 2 | 0.46% |
| Unknown RAM Module 2GB SODIMM DDR2 | 2 | 0.46% |
| Unknown RAM Module 2GB DIMM DDR2 | 2 | 0.46% |
| Unknown RAM Module 2GB DIMM DDR 800MT/s | 2 | 0.46% |
| Unknown RAM Module 1GB SODIMM DDR2 667MT/s | 2 | 0.46% |
| Unknown RAM Module 1GB DIMM 667MT/s | 2 | 0.46% |
| SK hynix RAM HMT451S6CFR6A-PB 4GB SODIMM DDR3 1600MT/s | 2 | 0.46% |
| SK hynix RAM HMA851S6CJR6N-VK 4GB SODIMM DDR4 2667MT/s | 2 | 0.46% |
| Samsung RAM Module 4GB SODIMM DDR3 1333MT/s | 2 | 0.46% |
| Samsung RAM M471B5773CHS-CH9 2GB SODIMM DDR3 4199MT/s | 2 | 0.46% |
| Samsung RAM M471B5273DH0-CK0 4GB SODIMM DDR3 1600MT/s | 2 | 0.46% |
| Samsung RAM M471B5173EB0-YK0 4GB SODIMM DDR3 1600MT/s | 2 | 0.46% |
| Samsung RAM M471B1G73DB0-YK0 8GB SODIMM DDR3 1600MT/s | 2 | 0.46% |
| Samsung RAM M471A1K43BB1-CRC 8192MB SODIMM DDR4 2667MT/s | 2 | 0.46% |
Memory Kind
Memory module kinds


| Kind | Computers | Percent |
|---|---|---|
| DDR3 | 154 | 44.64% |
| DDR4 | 110 | 31.88% |
| DDR2 | 31 | 8.99% |
| SDRAM | 21 | 6.09% |
| Unknown | 15 | 4.35% |
| DDR | 6 | 1.74% |
| LPDDR4 | 3 | 0.87% |
| LPDDR3 | 2 | 0.58% |
| DDR5 | 2 | 0.58% |
| DRAM | 1 | 0.29% |
Memory Form Factor
Physical design of the memory module


| Name | Computers | Percent |
|---|---|---|
| SODIMM | 177 | 52.99% |
| DIMM | 146 | 43.71% |
| Row Of Chips | 9 | 2.69% |
| FB-DIMM | 1 | 0.3% |
| Chip | 1 | 0.3% |
Memory Size
Memory module size


| Size | Computers | Percent |
|---|---|---|
| 4096 | 134 | 35.08% |
| 8192 | 114 | 29.84% |
| 2048 | 83 | 21.73% |
| 16384 | 24 | 6.28% |
| 1024 | 20 | 5.24% |
| 32768 | 5 | 1.31% |
| 512 | 2 | 0.52% |
Memory Speed
Memory module speed


| Speed | Computers | Percent |
|---|---|---|
| 1600 | 90 | 23.94% |
| 1333 | 44 | 11.7% |
| 3200 | 37 | 9.84% |
| 2667 | 28 | 7.45% |
| 2400 | 22 | 5.85% |
| 800 | 22 | 5.85% |
| 667 | 20 | 5.32% |
| 1334 | 15 | 3.99% |
| 2133 | 13 | 3.46% |
| 3600 | 12 | 3.19% |
| Unknown | 8 | 2.13% |
| 1866 | 7 | 1.86% |
| 1066 | 6 | 1.6% |
| 3400 | 5 | 1.33% |
| 3266 | 5 | 1.33% |
| 1867 | 5 | 1.33% |
| 1067 | 5 | 1.33% |
| 4199 | 4 | 1.06% |
| 975 | 3 | 0.8% |
| 4800 | 2 | 0.53% |
| 3733 | 2 | 0.53% |
| 3000 | 2 | 0.53% |
| 2666 | 2 | 0.53% |
| 2048 | 2 | 0.53% |
| 533 | 2 | 0.53% |
| 49926 | 1 | 0.27% |
| 8400 | 1 | 0.27% |
| 6400 | 1 | 0.27% |
| 4267 | 1 | 0.27% |
| 3866 | 1 | 0.27% |
| 3466 | 1 | 0.27% |
| 3333 | 1 | 0.27% |
| 2800 | 1 | 0.27% |
| 2000 | 1 | 0.27% |
| 1639 | 1 | 0.27% |
| 1400 | 1 | 0.27% |
| 400 | 1 | 0.27% |
| 333 | 1 | 0.27% |
Printers & scanners
Printer Vendor
Printer device vendors


| Vendor | Computers | Percent |
|---|---|---|
| Hewlett-Packard | 4 | 36.36% |
| Canon | 2 | 18.18% |
| Seiko Epson | 1 | 9.09% |
| Samsung Electronics | 1 | 9.09% |
| MIIIW | 1 | 9.09% |
| Citizen | 1 | 9.09% |
| Brother Industries | 1 | 9.09% |
Printer Model
Printer device models


| Model | Computers | Percent |
|---|---|---|
| Seiko Epson L355 Series | 1 | 9.09% |
| Samsung ML-1640 Series Laser Printer | 1 | 9.09% |
| MIIIW MW Keyboard Air Mini | 1 | 9.09% |
| HP OfficeJet Pro 7740 series | 1 | 9.09% |
| HP LaserJet Pro M12a | 1 | 9.09% |
| HP DeskJet 3940 | 1 | 9.09% |
| HP DeskJet 2620 All-in-One Printer | 1 | 9.09% |
| Citizen Barcode Printer | 1 | 9.09% |
| Canon TS5100 series | 1 | 9.09% |
| Canon PIXMA MG3600 Series | 1 | 9.09% |
| Brother HL-L2390DW | 1 | 9.09% |
Scanner Vendor
Scanner device vendors


| Vendor | Computers | Percent |
|---|---|---|
| Canon | 2 | 100% |
Scanner Model
Scanner device models


| Model | Computers | Percent |
|---|---|---|
| Canon CanoScan LIDE 25 | 1 | 50% |
| Canon CanoScan LiDE 120 | 1 | 50% |
Camera
Camera Vendor
Camera device vendors


| Vendor | Computers | Percent |
|---|---|---|
| Chicony Electronics | 33 | 20.12% |
| IMC Networks | 17 | 10.37% |
| Realtek Semiconductor | 13 | 7.93% |
| Microdia | 12 | 7.32% |
| Quanta | 11 | 6.71% |
| Acer | 11 | 6.71% |
| Logitech | 9 | 5.49% |
| Suyin | 6 | 3.66% |
| Sunplus Innovation Technology | 6 | 3.66% |
| Syntek | 5 | 3.05% |
| Alcor Micro | 5 | 3.05% |
| Z-Star Microelectronics | 4 | 2.44% |
| Ricoh | 4 | 2.44% |
| Importek | 4 | 2.44% |
| Cheng Uei Precision Industry (Foxlink) | 4 | 2.44% |
| Lenovo | 3 | 1.83% |
| Apple | 3 | 1.83% |
| Silicon Motion | 2 | 1.22% |
| Lite-On Technology | 2 | 1.22% |
| WaveRider Communications | 1 | 0.61% |
| USB3.0 HD Audio Capture | 1 | 0.61% |
| Samsung Electronics | 1 | 0.61% |
| Microsoft | 1 | 0.61% |
| KYE Systems (Mouse Systems) | 1 | 0.61% |
| HD 2MP WEBCAM | 1 | 0.61% |
| Generalplus Technology | 1 | 0.61% |
| Creative Technology | 1 | 0.61% |
| Aveo Technology | 1 | 0.61% |
| ALi | 1 | 0.61% |
Camera Model
Camera device models


| Model | Computers | Percent |
|---|---|---|
| Acer Integrated Camera | 6 | 3.66% |
| Chicony Integrated Camera | 5 | 3.05% |
| Quanta VGA WebCam | 4 | 2.44% |
| Quanta HD User Facing | 4 | 2.44% |
| IMC Networks Integrated Camera | 4 | 2.44% |
| Syntek Lenovo EasyCamera | 3 | 1.83% |
| Realtek USB Camera | 3 | 1.83% |
| Realtek Integrated_Webcam_HD | 3 | 1.83% |
| Microdia Webcam Vitade AF | 3 | 1.83% |
| Microdia Integrated Webcam | 3 | 1.83% |
| IMC Networks USB2.0 VGA UVC WebCam | 3 | 1.83% |
| IMC Networks USB2.0 HD UVC WebCam | 3 | 1.83% |
| Chicony USB 2.0 Camera | 3 | 1.83% |
| Chicony HD WebCam | 3 | 1.83% |
| Alcor Micro Asus Integrated Webcam | 3 | 1.83% |
| Sunplus Integrated_Webcam_HD | 2 | 1.22% |
| Realtek HD WebCam | 2 | 1.22% |
| Microdia Integrated Camera | 2 | 1.22% |
| Logitech Webcam C310 | 2 | 1.22% |
| Logitech HD Webcam C525 | 2 | 1.22% |
| Logitech HD Pro Webcam C920 | 2 | 1.22% |
| Lenovo Integrated Webcam [R5U877] | 2 | 1.22% |
| Importek TOSHIBA Web Camera - HD | 2 | 1.22% |
| Importek Laptop Integrated Webcam | 2 | 1.22% |
| Chicony USB2.0 HD UVC WebCam | 2 | 1.22% |
| Chicony Lenovo EasyCamera | 2 | 1.22% |
| Chicony HP TrueVision HD | 2 | 1.22% |
| Cheng Uei Precision Industry (Foxlink) HP Truevision HD | 2 | 1.22% |
| Apple FaceTime HD Camera (Built-in) | 2 | 1.22% |
| Z-Star WebCam SC-03FFL11739P | 1 | 0.61% |
| Z-Star Webcam | 1 | 0.61% |
| Z-Star Venus USB2.0 Camera | 1 | 0.61% |
| Z-Star A4 TECH HD PC Camera | 1 | 0.61% |
| WaveRider USB 2.0 Camera | 1 | 0.61% |
| USB3.0 HD Audio Capture USB3.0 HD Video Capture | 1 | 0.61% |
| Syntek Sonix USB 2.0 Camera | 1 | 0.61% |
| Syntek Integrated Camera | 1 | 0.61% |
| Suyin WebCam | 1 | 0.61% |
| Suyin USB2.0 UVC 1.3M WebCam | 1 | 0.61% |
| Suyin Lenovo EasyCamera | 1 | 0.61% |
Security
Fingerprint Vendor
Fingerprint sensor vendors


| Vendor | Computers | Percent |
|---|---|---|
| Validity Sensors | 4 | 25% |
| Upek | 3 | 18.75% |
| Shenzhen Goodix Technology | 3 | 18.75% |
| Synaptics | 2 | 12.5% |
| AuthenTec | 2 | 12.5% |
| LighTuning Technology | 1 | 6.25% |
| Elan Microelectronics | 1 | 6.25% |
Fingerprint Model
Fingerprint sensor models


| Model | Computers | Percent |
|---|---|---|
| Upek Biometric Touchchip/Touchstrip Fingerprint Sensor | 3 | 18.75% |
| Validity Sensors VFS 5011 fingerprint sensor | 2 | 12.5% |
| Validity Sensors Synaptics WBDI | 2 | 12.5% |
| Shenzhen Goodix Fingerprint Device | 2 | 12.5% |
| AuthenTec AES1600 | 2 | 12.5% |
| Synaptics VFS7552 Touch Fingerprint Sensor with PurePrint | 1 | 6.25% |
| Synaptics Prometheus MIS Touch Fingerprint Reader | 1 | 6.25% |
| Shenzhen Goodix Fingerprint Reader | 1 | 6.25% |
| LighTuning Fingerprint Reader | 1 | 6.25% |
| Elan ELAN:Fingerprint | 1 | 6.25% |
Chipcard Vendor
Chipcard module vendors


| Vendor | Computers | Percent |
|---|---|---|
| Broadcom | 5 | 50% |
| Upek | 2 | 20% |
| O2 Micro | 1 | 10% |
| Lenovo | 1 | 10% |
| Alcor Micro | 1 | 10% |
Chipcard Model
Chipcard module models


| Model | Computers | Percent |
|---|---|---|
| Upek TouchChip Fingerprint Coprocessor (WBF advanced mode) | 2 | 20% |
| Broadcom BCM5880 Secure Applications Processor with fingerprint swipe sensor | 2 | 20% |
| O2 Micro OZ776 CCID Smartcard Reader | 1 | 10% |
| Lenovo Integrated Smart Card Reader | 1 | 10% |
| Broadcom BCM5880 Secure Applications Processor | 1 | 10% |
| Broadcom 5880 | 1 | 10% |
| Broadcom 58200 | 1 | 10% |
| Alcor Micro AU9540 Smartcard Reader | 1 | 10% |
Unsupported
Unsupported Devices
Total unsupported devices on board


| Total | Computers | Percent |
|---|---|---|
| 0 | 281 | 82.4% |
| 1 | 53 | 15.54% |
| 2 | 6 | 1.76% |
| 3 | 1 | 0.29% |
Unsupported Device Types
Types of unsupported devices


| Type | Computers | Percent |
|---|---|---|
| Fingerprint reader | 16 | 24.24% |
| Graphics card | 12 | 18.18% |
| Chipcard | 10 | 15.15% |
| Net/wireless | 8 | 12.12% |
| Multimedia controller | 5 | 7.58% |
| Bluetooth | 5 | 7.58% |
| Camera | 3 | 4.55% |
| Unassigned class | 2 | 3.03% |
| Storage | 2 | 3.03% |
| Communication controller | 2 | 3.03% |
| Net/ethernet | 1 | 1.52% |