Manjaro - Hardware Trends
A project to identify most popular hardware characteristics and track their change over time based on data collected by Linux users at https://Linux-Hardware.org.
Anyone can contribute to this report by the hw-probe tool:
sudo -E hw-probe -all -uploadThis is a report for all computer types. See also reports for desktops and notebooks.
This report is for one last month. Overall report since the beginning of time: TestCoverage
Period: Oct, 2022.
Contents
System
OS
Installed operating systems


| Name | Computers | Percent |
|---|---|---|
| Manjaro | 88 | 50.29% |
| Manjaro 22.0.0 | 83 | 47.43% |
| Manjaro 21.3.7 | 3 | 1.71% |
| Manjaro 21.2.6 | 1 | 0.57% |
OS Family
OS without a version


| Name | Computers | Percent |
|---|---|---|
| Manjaro | 175 | 100% |
Kernel
Version of the Linux kernel


| Version | Computers | Percent |
|---|---|---|
| 5.15.74-3-MANJARO | 36 | 20.57% |
| 5.15.65-1-MANJARO | 24 | 13.71% |
| 6.0.2-2-MANJARO | 22 | 12.57% |
| 6.0.0-1-MANJARO | 16 | 9.14% |
| 5.15.71-1-MANJARO | 13 | 7.43% |
| 5.15.72-1-MANJARO | 12 | 6.86% |
| 5.19.7-1-MANJARO | 9 | 5.14% |
| 5.19.16-2-MANJARO | 9 | 5.14% |
| 5.15.60-1-MANJARO | 6 | 3.43% |
| 5.19.0-3-rt10-MANJARO | 5 | 2.86% |
| 6.1.0-1-MANJARO | 3 | 1.71% |
| 5.19.13-1-MANJARO | 3 | 1.71% |
| 6.0.2-3-MANJARO | 2 | 1.14% |
| 5.18.19-3-MANJARO | 2 | 1.14% |
| 5.10.141-1-MANJARO | 2 | 1.14% |
| 5.4.218-2-MANJARO | 1 | 0.57% |
| 5.4.217-1-MANJARO | 1 | 0.57% |
| 5.19.14-lqx1-2-lqx | 1 | 0.57% |
| 5.19.14-1-MANJARO | 1 | 0.57% |
| 5.19.10-1-MANJARO | 1 | 0.57% |
| 5.18.0-4-rt11-MANJARO | 1 | 0.57% |
| 5.15.32-1-MANJARO | 1 | 0.57% |
| 5.14.21-2-MANJARO | 1 | 0.57% |
| 5.10.148-1-MANJARO | 1 | 0.57% |
| 5.10.146-1-MANJARO | 1 | 0.57% |
| 5.10.136-1-MANJARO | 1 | 0.57% |
Kernel Family
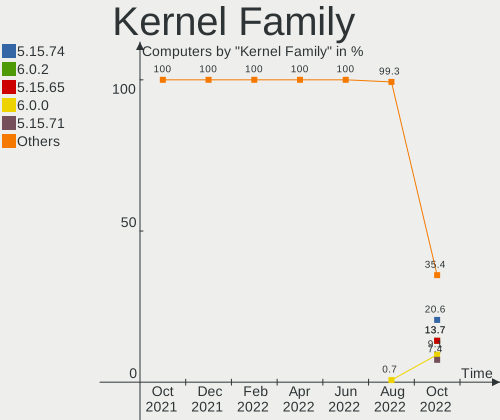
Linux kernel without a distro release

| Version | Computers | Percent |
|---|---|---|
| 5.15.74 | 36 | 20.57% |
| 6.0.2 | 24 | 13.71% |
| 5.15.65 | 24 | 13.71% |
| 6.0.0 | 16 | 9.14% |
| 5.15.71 | 13 | 7.43% |
| 5.15.72 | 12 | 6.86% |
| 5.19.7 | 9 | 5.14% |
| 5.19.16 | 9 | 5.14% |
| 5.15.60 | 6 | 3.43% |
| 5.19.0 | 5 | 2.86% |
| 6.1.0 | 3 | 1.71% |
| 5.19.13 | 3 | 1.71% |
| 5.19.14 | 2 | 1.14% |
| 5.18.19 | 2 | 1.14% |
| 5.10.141 | 2 | 1.14% |
| 5.4.218 | 1 | 0.57% |
| 5.4.217 | 1 | 0.57% |
| 5.19.10 | 1 | 0.57% |
| 5.18.0 | 1 | 0.57% |
| 5.15.32 | 1 | 0.57% |
| 5.14.21 | 1 | 0.57% |
| 5.10.148 | 1 | 0.57% |
| 5.10.146 | 1 | 0.57% |
| 5.10.136 | 1 | 0.57% |
Kernel Major Ver.
Linux kernel major version


| Version | Computers | Percent |
|---|---|---|
| 5.15 | 92 | 52.57% |
| 6.0 | 40 | 22.86% |
| 5.19 | 29 | 16.57% |
| 5.10 | 5 | 2.86% |
| 6.1 | 3 | 1.71% |
| 5.18 | 3 | 1.71% |
| 5.4 | 2 | 1.14% |
| 5.14 | 1 | 0.57% |
Arch
OS architecture (x86_64, i586, etc.)


| Name | Computers | Percent |
|---|---|---|
| x86_64 | 175 | 100% |
DE
Desktop Environment


| Name | Computers | Percent |
|---|---|---|
| KDE5 | 102 | 58.29% |
| GNOME | 36 | 20.57% |
| XFCE | 17 | 9.71% |
| X-Cinnamon | 8 | 4.57% |
| Unknown | 5 | 2.86% |
| MATE | 3 | 1.71% |
| i3 | 2 | 1.14% |
| Deepin | 1 | 0.57% |
| Cinnamon | 1 | 0.57% |
Display Server
X11 or Wayland


| Name | Computers | Percent |
|---|---|---|
| X11 | 139 | 79.43% |
| Wayland | 29 | 16.57% |
| Unknown | 5 | 2.86% |
| Tty | 2 | 1.14% |
Display Manager
SDDM, LightDM, etc.


| Name | Computers | Percent |
|---|---|---|
| Unknown | 87 | 49.71% |
| SDDM | 46 | 26.29% |
| LightDM | 24 | 13.71% |
| GDM | 18 | 10.29% |
OS Lang
Language


| Lang | Computers | Percent |
|---|---|---|
| en_US | 70 | 40% |
| de_DE | 16 | 9.14% |
| it_IT | 15 | 8.57% |
| pt_BR | 8 | 4.57% |
| es_ES | 7 | 4% |
| en_GB | 7 | 4% |
| ru_RU | 6 | 3.43% |
| nl_NL | 3 | 1.71% |
| fr_FR | 3 | 1.71% |
| es_MX | 3 | 1.71% |
| es_CL | 3 | 1.71% |
| es_AR | 3 | 1.71% |
| en_IN | 3 | 1.71% |
| zh_CN | 2 | 1.14% |
| pl_PL | 2 | 1.14% |
| es_UY | 2 | 1.14% |
| en_IE | 2 | 1.14% |
| de_AT | 2 | 1.14% |
| cs_CZ | 2 | 1.14% |
| sl_SI | 1 | 0.57% |
| pt_PT | 1 | 0.57% |
| fr_CA | 1 | 0.57% |
| fr_BE | 1 | 0.57% |
| es_SV | 1 | 0.57% |
| es_HN | 1 | 0.57% |
| es_CR | 1 | 0.57% |
| en_ZA | 1 | 0.57% |
| en_PH | 1 | 0.57% |
| en_IL | 1 | 0.57% |
| en_DK | 1 | 0.57% |
| en_DE | 1 | 0.57% |
| el_GR | 1 | 0.57% |
| Default | 1 | 0.57% |
| C | 1 | 0.57% |
| Unknown | 1 | 0.57% |
Boot Mode
EFI or BIOS


| Mode | Computers | Percent |
|---|---|---|
| BIOS | 113 | 64.57% |
| EFI | 62 | 35.43% |
Filesystem
Type of filesystem


| Type | Computers | Percent |
|---|---|---|
| Ext4 | 133 | 76% |
| Btrfs | 35 | 20% |
| Overlay | 4 | 2.29% |
| Xfs | 2 | 1.14% |
| Unknown | 1 | 0.57% |
Part. scheme
Scheme of partitioning


| Type | Computers | Percent |
|---|---|---|
| Unknown | 85 | 48.57% |
| GPT | 82 | 46.86% |
| MBR | 8 | 4.57% |
Dual Boot with Linux/BSD
Hosting more than one Linux/BSD


| Dual boot | Computers | Percent |
|---|---|---|
| No | 157 | 89.71% |
| Yes | 18 | 10.29% |
Dual Boot (Win)
Hosting Linux and Windows


| Dual boot | Computers | Percent |
|---|---|---|
| No | 129 | 73.71% |
| Yes | 46 | 26.29% |
Board
Vendor
Motherboard manufacturer


| Name | Computers | Percent |
|---|---|---|
| ASUSTek Computer | 32 | 18.29% |
| Lenovo | 29 | 16.57% |
| Hewlett-Packard | 29 | 16.57% |
| Gigabyte Technology | 17 | 9.71% |
| Dell | 17 | 9.71% |
| Acer | 12 | 6.86% |
| MSI | 7 | 4% |
| ASRock | 7 | 4% |
| HUAWEI | 3 | 1.71% |
| Toshiba | 2 | 1.14% |
| Tactus | 2 | 1.14% |
| Chuwi | 2 | 1.14% |
| Sony | 1 | 0.57% |
| Schenker | 1 | 0.57% |
| SANTECH | 1 | 0.57% |
| RuggedPC | 1 | 0.57% |
| Medion | 1 | 0.57% |
| MACHINIST | 1 | 0.57% |
| Jumper | 1 | 0.57% |
| HONOR | 1 | 0.57% |
| GPD | 1 | 0.57% |
| Global Distribution FZE | 1 | 0.57% |
| Foxconn | 1 | 0.57% |
| CyberPowerPC | 1 | 0.57% |
| AVITA | 1 | 0.57% |
| Apple | 1 | 0.57% |
| Alienware | 1 | 0.57% |
| Unknown | 1 | 0.57% |
Model
Motherboard model


| Name | Computers | Percent |
|---|---|---|
| ASUS VivoBook_ASUSLaptop X512FJ_X512FJ | 2 | 1.14% |
| ASUS TUF Gaming B550M-PLUS | 2 | 1.14% |
| Acer Aspire E5-553G | 2 | 1.14% |
| Toshiba Satellite P755 | 1 | 0.57% |
| Toshiba Encore | 1 | 0.57% |
| Tactus GeoFlex 110 | 1 | 0.57% |
| Tactus GeoBook_240 | 1 | 0.57% |
| Sony SVF15N17CXB | 1 | 0.57% |
| Schenker VISION 15 (SVS15E21) | 1 | 0.57% |
| SANTECH NL5xRU | 1 | 0.57% |
| RuggedPC RuggedBookJ87 | 1 | 0.57% |
| MSI Raider GE76 12UGS | 1 | 0.57% |
| MSI Pulse GL76 12UEK | 1 | 0.57% |
| MSI MS-7850 | 1 | 0.57% |
| MSI MS-7676 | 1 | 0.57% |
| MSI Modern 15 A11MU | 1 | 0.57% |
| MSI Katana GF76 11UG | 1 | 0.57% |
| MSI GP66 Leopard 11UG | 1 | 0.57% |
| Medion S15449 | 1 | 0.57% |
| MACHINIST X79 V2.82H | 1 | 0.57% |
| Lenovo Z50-75 80EC | 1 | 0.57% |
| Lenovo Yoga Slim 7 ProX 14ARH7 82TL | 1 | 0.57% |
| Lenovo Yoga Slim 7 Pro 14IAP7 82SV | 1 | 0.57% |
| Lenovo Yoga Slim 7 14ARE05 82A2 | 1 | 0.57% |
| Lenovo Y50-70 20378 | 1 | 0.57% |
| Lenovo ThinkPad X380 Yoga 20LJS2YE1H | 1 | 0.57% |
| Lenovo ThinkPad X270 W10DG 20K5S0B700 | 1 | 0.57% |
| Lenovo ThinkPad T490 20RYS07R00 | 1 | 0.57% |
| Lenovo ThinkPad T440p 20AW005BGE | 1 | 0.57% |
| Lenovo ThinkPad T440p 20AN0069US | 1 | 0.57% |
| Lenovo ThinkPad T410s 2912AJ7 | 1 | 0.57% |
| Lenovo ThinkPad T14 Gen 3 21CFCTO1WW | 1 | 0.57% |
| Lenovo ThinkPad S1 Yoga 20CD00B1US | 1 | 0.57% |
| Lenovo ThinkPad R500 2716W2K | 1 | 0.57% |
| Lenovo ThinkPad E14 Gen 3 20YDS05600 | 1 | 0.57% |
| Lenovo ThinkCentre A57 9851CDF | 1 | 0.57% |
| Lenovo ThinkBook 15-IIL 20SM | 1 | 0.57% |
| Lenovo ThinkBook 14p Gen 2 20YN | 1 | 0.57% |
| Lenovo N23 80UR | 1 | 0.57% |
| Lenovo Legion 5 82B5 | 1 | 0.57% |
Model Family
Motherboard model prefix


| Name | Computers | Percent |
|---|---|---|
| Lenovo ThinkPad | 10 | 5.71% |
| Acer Aspire | 10 | 5.71% |
| ASUS ROG | 9 | 5.14% |
| HP Pavilion | 6 | 3.43% |
| Lenovo IdeaPad | 5 | 2.86% |
| HP ProBook | 5 | 2.86% |
| HP Laptop | 4 | 2.29% |
| Dell OptiPlex | 4 | 2.29% |
| Dell Latitude | 4 | 2.29% |
| Dell Inspiron | 4 | 2.29% |
| ASUS VivoBook | 4 | 2.29% |
| Lenovo Yoga | 3 | 1.71% |
| HP ENVY | 3 | 1.71% |
| Dell XPS | 3 | 1.71% |
| ASUS TUF | 3 | 1.71% |
| Lenovo ThinkBook | 2 | 1.14% |
| Lenovo Legion | 2 | 1.14% |
| HP Compaq | 2 | 1.14% |
| Gigabyte B450 | 2 | 1.14% |
| ASUS PRIME | 2 | 1.14% |
| ASRock X570 | 2 | 1.14% |
| ASRock B550M | 2 | 1.14% |
| Toshiba Satellite | 1 | 0.57% |
| Toshiba Encore | 1 | 0.57% |
| Tactus GeoFlex | 1 | 0.57% |
| Tactus GeoBook | 1 | 0.57% |
| Sony SVF15N17CXB | 1 | 0.57% |
| Schenker VISION | 1 | 0.57% |
| SANTECH NL5xRU | 1 | 0.57% |
| RuggedPC RuggedBookJ87 | 1 | 0.57% |
| MSI Raider | 1 | 0.57% |
| MSI Pulse | 1 | 0.57% |
| MSI MS-7850 | 1 | 0.57% |
| MSI MS-7676 | 1 | 0.57% |
| MSI Modern | 1 | 0.57% |
| MSI Katana | 1 | 0.57% |
| MSI GP66 | 1 | 0.57% |
| Medion S15449 | 1 | 0.57% |
| MACHINIST X79 | 1 | 0.57% |
| Lenovo Z50-75 | 1 | 0.57% |
MFG Year
Motherboard manufacture year


| Year | Computers | Percent |
|---|---|---|
| 2021 | 30 | 17.14% |
| 2020 | 27 | 15.43% |
| 2019 | 19 | 10.86% |
| 2022 | 14 | 8% |
| 2016 | 13 | 7.43% |
| 2012 | 12 | 6.86% |
| 2014 | 11 | 6.29% |
| 2018 | 10 | 5.71% |
| 2011 | 10 | 5.71% |
| 2017 | 7 | 4% |
| 2013 | 6 | 3.43% |
| 2015 | 5 | 2.86% |
| 2010 | 5 | 2.86% |
| 2008 | 4 | 2.29% |
| 2009 | 2 | 1.14% |
Form Factor
Physical design of the computer


| Name | Computers | Percent |
|---|---|---|
| Notebook | 101 | 57.71% |
| Desktop | 61 | 34.86% |
| Convertible | 8 | 4.57% |
| Tablet | 2 | 1.14% |
| All in one | 2 | 1.14% |
| Server | 1 | 0.57% |
Secure Boot
Enabled or disabled


| State | Computers | Percent |
|---|---|---|
| Disabled | 175 | 100% |
Coreboot
Have coreboot on board


| Used | Computers | Percent |
|---|---|---|
| No | 175 | 100% |
RAM Size
Total RAM memory


| Size in GB | Computers | Percent |
|---|---|---|
| 16.01-24.0 | 43 | 24.57% |
| 4.01-8.0 | 35 | 20% |
| 8.01-16.0 | 29 | 16.57% |
| 32.01-64.0 | 26 | 14.86% |
| 3.01-4.0 | 21 | 12% |
| 64.01-256.0 | 10 | 5.71% |
| 24.01-32.0 | 5 | 2.86% |
| 1.01-2.0 | 4 | 2.29% |
| More than 256.0 | 1 | 0.57% |
| 2.01-3.0 | 1 | 0.57% |
RAM Used
Used RAM memory


| Used GB | Computers | Percent |
|---|---|---|
| 4.01-8.0 | 52 | 29.71% |
| 2.01-3.0 | 45 | 25.71% |
| 1.01-2.0 | 27 | 15.43% |
| 3.01-4.0 | 26 | 14.86% |
| 8.01-16.0 | 16 | 9.14% |
| 0.51-1.0 | 5 | 2.86% |
| 16.01-24.0 | 2 | 1.14% |
| More than 256.0 | 1 | 0.57% |
| 24.01-32.0 | 1 | 0.57% |
Total Drives
Number of drives on board


| Drives | Computers | Percent |
|---|---|---|
| 1 | 95 | 54.29% |
| 2 | 35 | 20% |
| 3 | 23 | 13.14% |
| 5 | 11 | 6.29% |
| 4 | 10 | 5.71% |
| 7 | 1 | 0.57% |
Has CD-ROM
Has CD-ROM on board


| Presented | Computers | Percent |
|---|---|---|
| No | 133 | 76% |
| Yes | 42 | 24% |
Has Ethernet
Has Ethernet on board


| Presented | Computers | Percent |
|---|---|---|
| Yes | 134 | 76.57% |
| No | 41 | 23.43% |
Has WiFi
Has WiFi module


| Presented | Computers | Percent |
|---|---|---|
| Yes | 132 | 75.43% |
| No | 43 | 24.57% |
Has Bluetooth
Has Bluetooth module


| Presented | Computers | Percent |
|---|---|---|
| Yes | 125 | 71.43% |
| No | 50 | 28.57% |
Location
Country
Geographic location (country)


| Country | Computers | Percent |
|---|---|---|
| USA | 30 | 17.14% |
| Italy | 20 | 11.43% |
| Germany | 19 | 10.86% |
| Russia | 12 | 6.86% |
| Brazil | 9 | 5.14% |
| Spain | 6 | 3.43% |
| Netherlands | 5 | 2.86% |
| India | 5 | 2.86% |
| UK | 4 | 2.29% |
| Mexico | 4 | 2.29% |
| Greece | 4 | 2.29% |
| France | 4 | 2.29% |
| Uruguay | 3 | 1.71% |
| Poland | 3 | 1.71% |
| Czechia | 3 | 1.71% |
| Chile | 3 | 1.71% |
| Belgium | 3 | 1.71% |
| Austria | 3 | 1.71% |
| Argentina | 3 | 1.71% |
| Turkey | 2 | 1.14% |
| Norway | 2 | 1.14% |
| Ireland | 2 | 1.14% |
| Estonia | 2 | 1.14% |
| China | 2 | 1.14% |
| Vatican | 1 | 0.57% |
| Taiwan | 1 | 0.57% |
| Switzerland | 1 | 0.57% |
| South Africa | 1 | 0.57% |
| Slovenia | 1 | 0.57% |
| Romania | 1 | 0.57% |
| Portugal | 1 | 0.57% |
| Philippines | 1 | 0.57% |
| Nepal | 1 | 0.57% |
| Morocco | 1 | 0.57% |
| Moldova | 1 | 0.57% |
| Israel | 1 | 0.57% |
| Indonesia | 1 | 0.57% |
| Hungary | 1 | 0.57% |
| Honduras | 1 | 0.57% |
| El Salvador | 1 | 0.57% |
City
Geographic location (city)


| City | Computers | Percent |
|---|---|---|
| Vienna | 3 | 1.71% |
| St Petersburg | 3 | 1.71% |
| Montevideo | 3 | 1.71% |
| Maracanau | 3 | 1.71% |
| Athens | 3 | 1.71% |
| Amsterdam | 3 | 1.71% |
| St Louis | 2 | 1.14% |
| Sao Paulo | 2 | 1.14% |
| Pune | 2 | 1.14% |
| Munich | 2 | 1.14% |
| Moscow | 2 | 1.14% |
| Maipu | 2 | 1.14% |
| Madrid | 2 | 1.14% |
| Jackson | 2 | 1.14% |
| Heidelberg | 2 | 1.14% |
| Galati Mamertino | 2 | 1.14% |
| Coventry | 2 | 1.14% |
| Cincinnati | 2 | 1.14% |
| Brussels | 2 | 1.14% |
| Ames | 2 | 1.14% |
| Zurich | 1 | 0.57% |
| Zagreb | 1 | 0.57% |
| Zaandam | 1 | 0.57% |
| Wymondham | 1 | 0.57% |
| Wetteren | 1 | 0.57% |
| Weitramsdorf | 1 | 0.57% |
| Wakefield | 1 | 0.57% |
| Vladimir | 1 | 0.57% |
| Viggianello | 1 | 0.57% |
| Vatican City | 1 | 0.57% |
| Valasske Mezirici | 1 | 0.57% |
| Turin | 1 | 0.57% |
| Todtnau | 1 | 0.57% |
| Tiraspol | 1 | 0.57% |
| Tijuana | 1 | 0.57% |
| Texcoco | 1 | 0.57% |
| Tegucigalpa | 1 | 0.57% |
| Tallinn | 1 | 0.57% |
| Taipei | 1 | 0.57% |
| Statesboro | 1 | 0.57% |
Drives
Drive Vendor
Hard drive vendors


| Vendor | Computers | Drives | Percent |
|---|---|---|---|
| Samsung Electronics | 54 | 72 | 18.31% |
| Seagate | 31 | 38 | 10.51% |
| WDC | 29 | 41 | 9.83% |
| Sandisk | 22 | 23 | 7.46% |
| Unknown | 16 | 17 | 5.42% |
| Toshiba | 15 | 16 | 5.08% |
| Kingston | 15 | 16 | 5.08% |
| Crucial | 14 | 15 | 4.75% |
| Micron Technology | 9 | 9 | 3.05% |
| SK hynix | 8 | 9 | 2.71% |
| Hitachi | 7 | 8 | 2.37% |
| Phison Electronics | 6 | 6 | 2.03% |
| Micron/Crucial Technology | 5 | 5 | 1.69% |
| KIOXIA | 5 | 5 | 1.69% |
| PNY | 4 | 4 | 1.36% |
| GOODRAM | 4 | 4 | 1.36% |
| Silicon Motion | 3 | 3 | 1.02% |
| Realtek Semiconductor | 3 | 3 | 1.02% |
| OCZ | 3 | 3 | 1.02% |
| Intel | 3 | 4 | 1.02% |
| China | 3 | 3 | 1.02% |
| Unknown | 3 | 3 | 1.02% |
| SPCC | 2 | 2 | 0.68% |
| Netac | 2 | 2 | 0.68% |
| Lexar | 2 | 2 | 0.68% |
| Kingston Technology Company | 2 | 2 | 0.68% |
| Intenso | 2 | 2 | 0.68% |
| BUFFALO | 2 | 2 | 0.68% |
| WALRAM | 1 | 1 | 0.34% |
| Verbatim | 1 | 1 | 0.34% |
| USB | 1 | 1 | 0.34% |
| Union Memory | 1 | 1 | 0.34% |
| Transcend | 1 | 1 | 0.34% |
| Team | 1 | 2 | 0.34% |
| Shenzhen Longsys Electronics | 1 | 1 | 0.34% |
| SABRENT | 1 | 1 | 0.34% |
| Patriot | 1 | 1 | 0.34% |
| Mushkin | 1 | 1 | 0.34% |
| Maxone | 1 | 1 | 0.34% |
| KIOXIA-EXCERIA | 1 | 1 | 0.34% |
Drive Model
Hard drive models


| Model | Computers | Percent |
|---|---|---|
| Samsung NVMe SSD Controller SM981/PM981/PM983 500GB | 11 | 3.33% |
| Samsung NVMe SSD Controller PM9A1/PM9A3/980PRO 250GB | 7 | 2.12% |
| Samsung SSD 980 1TB | 5 | 1.52% |
| Sandisk WD Blue SN550 NVMe SSD 1TB | 4 | 1.21% |
| Samsung MZVLQ512HALU-000H1 512GB | 4 | 1.21% |
| Kingston SA400S37480G 480GB SSD | 4 | 1.21% |
| Unknown MMC Card 64GB | 3 | 0.91% |
| Unknown MMC Card 32GB | 3 | 0.91% |
| Seagate ST4000DM000-1F2168 4TB | 3 | 0.91% |
| Samsung SSD 870 QVO 1TB | 3 | 0.91% |
| Samsung NVMe SSD Controller SM961/PM961/SM963 250GB | 3 | 0.91% |
| Phison E16 PCIe4 NVMe Controller 1TB | 3 | 0.91% |
| Kingston SA400S37240G 240GB SSD | 3 | 0.91% |
| Crucial CT1000BX500SSD1 1TB | 3 | 0.91% |
| Unknown | 3 | 0.91% |
| WDC WDS240G2G0A-00JH30 240GB SSD | 2 | 0.61% |
| WDC WD10EZEX-08WN4A0 1TB | 2 | 0.61% |
| Unknown SD/MMC/MS PRO 1TB | 2 | 0.61% |
| Unknown C500 128GB | 2 | 0.61% |
| Toshiba MQ04ABF100 1TB | 2 | 0.61% |
| Toshiba MQ01ABD100 1TB | 2 | 0.61% |
| Toshiba DT01ACA300 3TB | 2 | 0.61% |
| Toshiba DT01ACA100 1TB | 2 | 0.61% |
| SK hynix SKHynix_HFS512GD9TNI-L2A0B 512GB | 2 | 0.61% |
| Silicon Motion SM2263EN/SM2263XT SSD Controller 256GB | 2 | 0.61% |
| Seagate ST4000DM004-2CV104 4TB | 2 | 0.61% |
| Seagate ST1000LM024 HN-M101MBB 1TB | 2 | 0.61% |
| Seagate ST1000DM010-2EP102 1TB | 2 | 0.61% |
| Seagate ST1000DM003-1CH162 1TB | 2 | 0.61% |
| Seagate Expansion 2TB | 2 | 0.61% |
| Sandisk WD Black SN750 / PC SN730 NVMe SSD 1TB | 2 | 0.61% |
| Sandisk WD Black 2018/SN750 / PC SN720 NVMe SSD 1TB | 2 | 0.61% |
| SanDisk SSD PLUS 480GB | 2 | 0.61% |
| SanDisk SSD PLUS 1000GB | 2 | 0.61% |
| Samsung SSD 870 QVO 2TB | 2 | 0.61% |
| Samsung SSD 870 EVO 500GB | 2 | 0.61% |
| Samsung SSD 860 EVO 1TB | 2 | 0.61% |
| Samsung SSD 850 EVO 500GB | 2 | 0.61% |
| Samsung SSD 840 Series 120GB | 2 | 0.61% |
| Samsung SSD 840 EVO 250GB | 2 | 0.61% |
HDD Vendor
Hard disk drive vendors


| Vendor | Computers | Drives | Percent |
|---|---|---|---|
| Seagate | 30 | 37 | 34.09% |
| WDC | 27 | 34 | 30.68% |
| Toshiba | 13 | 14 | 14.77% |
| Hitachi | 7 | 8 | 7.95% |
| Unknown | 4 | 4 | 4.55% |
| Samsung Electronics | 2 | 4 | 2.27% |
| USB | 1 | 1 | 1.14% |
| SABRENT | 1 | 1 | 1.14% |
| Maxone | 1 | 1 | 1.14% |
| HGST | 1 | 1 | 1.14% |
| Unknown | 1 | 1 | 1.14% |
SSD Vendor
Solid state drive vendors


| Vendor | Computers | Drives | Percent |
|---|---|---|---|
| Samsung Electronics | 21 | 25 | 20.59% |
| Kingston | 14 | 15 | 13.73% |
| Crucial | 14 | 15 | 13.73% |
| SanDisk | 9 | 10 | 8.82% |
| WDC | 5 | 7 | 4.9% |
| PNY | 4 | 4 | 3.92% |
| GOODRAM | 4 | 4 | 3.92% |
| OCZ | 3 | 3 | 2.94% |
| China | 3 | 3 | 2.94% |
| Unknown | 2 | 2 | 1.96% |
| SPCC | 2 | 2 | 1.96% |
| Netac | 2 | 2 | 1.96% |
| Lexar | 2 | 2 | 1.96% |
| Intenso | 2 | 2 | 1.96% |
| BUFFALO | 2 | 2 | 1.96% |
| Verbatim | 1 | 1 | 0.98% |
| Transcend | 1 | 1 | 0.98% |
| Team | 1 | 2 | 0.98% |
| Patriot | 1 | 1 | 0.98% |
| Mushkin | 1 | 1 | 0.98% |
| Micron Technology | 1 | 1 | 0.98% |
| KIOXIA-EXCERIA | 1 | 1 | 0.98% |
| Hoodisk | 1 | 1 | 0.98% |
| Gigabyte Technology | 1 | 1 | 0.98% |
| FORESEE | 1 | 1 | 0.98% |
| Apple | 1 | 1 | 0.98% |
| A-DATA Technology | 1 | 1 | 0.98% |
| Unknown | 1 | 1 | 0.98% |
Drive Kind
HDD or SSD


| Kind | Computers | Drives | Percent |
|---|---|---|---|
| NVMe | 90 | 108 | 35.71% |
| SSD | 79 | 112 | 31.35% |
| HDD | 69 | 106 | 27.38% |
| MMC | 9 | 10 | 3.57% |
| Unknown | 5 | 5 | 1.98% |
Drive Connector
SATA, SAS, NVMe, etc.


| Type | Computers | Drives | Percent |
|---|---|---|---|
| SATA | 114 | 203 | 49.14% |
| NVMe | 90 | 108 | 38.79% |
| SAS | 19 | 20 | 8.19% |
| MMC | 9 | 10 | 3.88% |
Drive Size
Size of hard drive


| Size in TB | Computers | Drives | Percent |
|---|---|---|---|
| 0.01-0.5 | 87 | 117 | 50.29% |
| 0.51-1.0 | 50 | 60 | 28.9% |
| 1.01-2.0 | 18 | 21 | 10.4% |
| 3.01-4.0 | 8 | 8 | 4.62% |
| 4.01-10.0 | 7 | 9 | 4.05% |
| 2.01-3.0 | 3 | 3 | 1.73% |
Space Total
Amount of disk space available on the file system


| Size in GB | Computers | Percent |
|---|---|---|
| 251-500 | 38 | 21.71% |
| 101-250 | 30 | 17.14% |
| 501-1000 | 24 | 13.71% |
| More than 3000 | 22 | 12.57% |
| 1001-2000 | 20 | 11.43% |
| Unknown | 18 | 10.29% |
| 51-100 | 10 | 5.71% |
| 1-20 | 6 | 3.43% |
| 2001-3000 | 4 | 2.29% |
| 21-50 | 3 | 1.71% |
Space Used
Amount of used disk space


| Used GB | Computers | Percent |
|---|---|---|
| 101-250 | 31 | 17.71% |
| 21-50 | 27 | 15.43% |
| 51-100 | 25 | 14.29% |
| 1-20 | 19 | 10.86% |
| Unknown | 18 | 10.29% |
| 501-1000 | 17 | 9.71% |
| 251-500 | 14 | 8% |
| 1001-2000 | 11 | 6.29% |
| More than 3000 | 6 | 3.43% |
| 2001-3000 | 6 | 3.43% |
| 0 | 1 | 0.57% |
Malfunc. Drives
Drive models with a malfunction


| Model | Computers | Drives | Percent |
|---|---|---|---|
| Seagate ST4000DM000-1F2168 4TB | 2 | 2 | 20% |
| WDC WD5000AADS-00S9B0 500GB | 1 | 1 | 10% |
| WDC WD20EFRX-68EUZN0 2TB | 1 | 1 | 10% |
| Toshiba MQ01ABD100 1TB | 1 | 1 | 10% |
| Toshiba HDWE140 4TB | 1 | 1 | 10% |
| Seagate ST500LT012-9WS142 500GB | 1 | 1 | 10% |
| Samsung Electronics SSD 840 Series 120GB | 1 | 1 | 10% |
| Samsung Electronics MMCRE28G8MXP-0VBH1 128GB SSD | 1 | 1 | 10% |
| Hitachi HDT725050VLA360 500GB | 1 | 1 | 10% |
Malfunc. Drive Vendor
Vendors of faulty drives


| Vendor | Computers | Drives | Percent |
|---|---|---|---|
| Seagate | 3 | 3 | 33.33% |
| WDC | 2 | 2 | 22.22% |
| Toshiba | 2 | 2 | 22.22% |
| Samsung Electronics | 1 | 2 | 11.11% |
| Hitachi | 1 | 1 | 11.11% |
Malfunc. HDD Vendor
Vendors of faulty HDD drives


| Vendor | Computers | Drives | Percent |
|---|---|---|---|
| Seagate | 3 | 3 | 37.5% |
| WDC | 2 | 2 | 25% |
| Toshiba | 2 | 2 | 25% |
| Hitachi | 1 | 1 | 12.5% |
Malfunc. Drive Kind
Kinds of faulty drives


| Kind | Computers | Drives | Percent |
|---|---|---|---|
| HDD | 8 | 8 | 88.89% |
| SSD | 1 | 2 | 11.11% |
Failed Drives
Failed drive models
Zero info for selected period =(
Failed Drive Vendor
Failed drive vendors
Zero info for selected period =(
Drive Status
Number of failed and malfunc. drives


| Status | Computers | Drives | Percent |
|---|---|---|---|
| Detected | 127 | 233 | 66.84% |
| Works | 54 | 98 | 28.42% |
| Malfunc | 9 | 10 | 4.74% |
Storage controller
Storage Vendor
Storage controller vendors


| Vendor | Computers | Percent |
|---|---|---|
| Intel | 103 | 41.7% |
| AMD | 40 | 16.19% |
| Samsung Electronics | 38 | 15.38% |
| SanDisk | 13 | 5.26% |
| SK hynix | 8 | 3.24% |
| Micron Technology | 8 | 3.24% |
| Phison Electronics | 6 | 2.43% |
| Micron/Crucial Technology | 5 | 2.02% |
| KIOXIA | 5 | 2.02% |
| ASMedia Technology | 4 | 1.62% |
| Silicon Motion | 3 | 1.21% |
| Realtek Semiconductor | 3 | 1.21% |
| Kingston Technology Company | 3 | 1.21% |
| Toshiba America Info Systems | 2 | 0.81% |
| Union Memory (Shenzhen) | 1 | 0.4% |
| Shenzhen Longsys Electronics | 1 | 0.4% |
| Marvell Technology Group | 1 | 0.4% |
| JMicron Technology | 1 | 0.4% |
| Biwin Storage Technology | 1 | 0.4% |
| ADATA Technology | 1 | 0.4% |
Storage Model
Storage controller models


| Model | Computers | Percent |
|---|---|---|
| AMD FCH SATA Controller [AHCI mode] | 32 | 12.08% |
| Samsung NVMe SSD Controller 980 | 14 | 5.28% |
| Samsung NVMe SSD Controller SM981/PM981/PM983 | 12 | 4.53% |
| Intel 82801 Mobile SATA Controller [RAID mode] | 9 | 3.4% |
| Micron Non-Volatile memory controller | 8 | 3.02% |
| Samsung NVMe SSD Controller PM9A1/PM9A3/980PRO | 7 | 2.64% |
| Intel Volume Management Device NVMe RAID Controller | 6 | 2.26% |
| Intel 8 Series/C220 Series Chipset Family 6-port SATA Controller 1 [AHCI mode] | 6 | 2.26% |
| AMD 500 Series Chipset SATA Controller | 6 | 2.26% |
| AMD 400 Series Chipset SATA Controller | 6 | 2.26% |
| SanDisk WD Blue SN550 NVMe SSD | 5 | 1.89% |
| KIOXIA NVMe SSD Controller BG4 | 5 | 1.89% |
| Intel Sunrise Point-LP SATA Controller [AHCI mode] | 5 | 1.89% |
| Intel Q170/Q150/B150/H170/H110/Z170/CM236 Chipset SATA Controller [AHCI Mode] | 5 | 1.89% |
| Intel Celeron/Pentium Silver Processor SATA Controller | 5 | 1.89% |
| Intel 7 Series/C210 Series Chipset Family 6-port SATA Controller [AHCI mode] | 5 | 1.89% |
| Intel 7 Series Chipset Family 6-port SATA Controller [AHCI mode] | 5 | 1.89% |
| Intel 6 Series/C200 Series Chipset Family 6 port Desktop SATA AHCI Controller | 5 | 1.89% |
| Intel 200 Series PCH SATA controller [AHCI mode] | 5 | 1.89% |
| SK hynix Gold P31 SSD | 4 | 1.51% |
| Intel Cannon Lake PCH SATA AHCI Controller | 4 | 1.51% |
| Intel 8 Series SATA Controller 1 [AHCI mode] | 4 | 1.51% |
| Intel 6 Series/C200 Series Chipset Family 6 port Mobile SATA AHCI Controller | 4 | 1.51% |
| SK hynix Non-Volatile memory controller | 3 | 1.13% |
| SanDisk Non-Volatile memory controller | 3 | 1.13% |
| Samsung NVMe SSD Controller SM961/PM961/SM963 | 3 | 1.13% |
| Phison E16 PCIe4 NVMe Controller | 3 | 1.13% |
| Intel Comet Lake SATA AHCI Controller | 3 | 1.13% |
| ASMedia ASM1062 Serial ATA Controller | 3 | 1.13% |
| Silicon Motion SM2263EN/SM2263XT SSD Controller | 2 | 0.75% |
| SanDisk WD Black SN750 / PC SN730 NVMe SSD | 2 | 0.75% |
| SanDisk WD Black 2018/SN750 / PC SN720 NVMe SSD | 2 | 0.75% |
| Samsung NVMe SSD Controller SM951/PM951 | 2 | 0.75% |
| Realtek Realtek Non-Volatile memory controller | 2 | 0.75% |
| Phison E12 NVMe Controller | 2 | 0.75% |
| Micron/Crucial P2 NVMe PCIe SSD | 2 | 0.75% |
| Micron/Crucial P1 NVMe PCIe SSD | 2 | 0.75% |
| Intel SSD 660P Series | 2 | 0.75% |
| Intel SATA Controller [RAID mode] | 2 | 0.75% |
| Intel NM10/ICH7 Family SATA Controller [IDE mode] | 2 | 0.75% |
Storage Kind
Kind of storage controller (IDE, SATA, NVMe, SAS, ...)


| Kind | Computers | Percent |
|---|---|---|
| SATA | 123 | 52.34% |
| NVMe | 90 | 38.3% |
| RAID | 17 | 7.23% |
| IDE | 5 | 2.13% |
Processor
CPU Vendor
Processor vendors


| Vendor | Computers | Percent |
|---|---|---|
| Intel | 120 | 68.57% |
| AMD | 55 | 31.43% |
CPU Model
Processor models


| Model | Computers | Percent |
|---|---|---|
| Intel 11th Gen Core i7-1165G7 @ 2.80GHz | 4 | 2.29% |
| AMD Ryzen 7 4700U with Radeon Graphics | 4 | 2.29% |
| Intel Core i7-8550U CPU @ 1.80GHz | 3 | 1.71% |
| Intel Core i5-10210U CPU @ 1.60GHz | 3 | 1.71% |
| Intel Celeron N4020 CPU @ 1.10GHz | 3 | 1.71% |
| AMD Ryzen 7 4800H with Radeon Graphics | 3 | 1.71% |
| AMD Ryzen 7 3700X 8-Core Processor | 3 | 1.71% |
| AMD Ryzen 7 2700X Eight-Core Processor | 3 | 1.71% |
| Intel Core i7-8700 CPU @ 3.20GHz | 2 | 1.14% |
| Intel Core i7-8565U CPU @ 1.80GHz | 2 | 1.14% |
| Intel Core i7-7700 CPU @ 3.60GHz | 2 | 1.14% |
| Intel Core i7-6700 CPU @ 3.40GHz | 2 | 1.14% |
| Intel Core i7-3770 CPU @ 3.40GHz | 2 | 1.14% |
| Intel Core i5-3450 CPU @ 3.10GHz | 2 | 1.14% |
| Intel Core i5-2450M CPU @ 2.50GHz | 2 | 1.14% |
| Intel Core i5-2410M CPU @ 2.30GHz | 2 | 1.14% |
| Intel Core i3-4005U CPU @ 1.70GHz | 2 | 1.14% |
| Intel Celeron N5100 @ 1.10GHz | 2 | 1.14% |
| Intel 12th Gen Core i5-1235U | 2 | 1.14% |
| Intel 11th Gen Core i7-1195G7 @ 2.90GHz | 2 | 1.14% |
| Intel 11th Gen Core i7-11800H @ 2.30GHz | 2 | 1.14% |
| Intel 11th Gen Core i5-1135G7 @ 2.40GHz | 2 | 1.14% |
| AMD Ryzen 9 3900X 12-Core Processor | 2 | 1.14% |
| AMD Ryzen 7 5700G with Radeon Graphics | 2 | 1.14% |
| AMD Ryzen 5 5500U with Radeon Graphics | 2 | 1.14% |
| AMD Ryzen 5 3600 6-Core Processor | 2 | 1.14% |
| AMD A10-9600P RADEON R5, 10 COMPUTE CORES 4C+6G | 2 | 1.14% |
| Intel Xeon CPU X5680 @ 3.33GHz | 1 | 0.57% |
| Intel Xeon CPU E5-2650 v2 @ 2.60GHz | 1 | 0.57% |
| Intel Pentium Silver N5030 CPU @ 1.10GHz | 1 | 0.57% |
| Intel Pentium Dual-Core CPU E6600 @ 3.06GHz | 1 | 0.57% |
| Intel Pentium CPU N3540 @ 2.16GHz | 1 | 0.57% |
| Intel Pentium CPU 2117U @ 1.80GHz | 1 | 0.57% |
| Intel Pentium CPU 2020M @ 2.40GHz | 1 | 0.57% |
| Intel Core i7-9750H CPU @ 2.60GHz | 1 | 0.57% |
| Intel Core i7-9700K CPU @ 3.60GHz | 1 | 0.57% |
| Intel Core i7-9700 CPU @ 3.00GHz | 1 | 0.57% |
| Intel Core i7-7700HQ CPU @ 2.80GHz | 1 | 0.57% |
| Intel Core i7-6700K CPU @ 4.00GHz | 1 | 0.57% |
| Intel Core i7-4820K CPU @ 3.70GHz | 1 | 0.57% |
CPU Model Family
Processor model prefix


| Model | Computers | Percent |
|---|---|---|
| Intel Core i5 | 38 | 21.71% |
| Intel Core i7 | 29 | 16.57% |
| Other | 21 | 12% |
| AMD Ryzen 7 | 20 | 11.43% |
| AMD Ryzen 5 | 13 | 7.43% |
| Intel Celeron | 10 | 5.71% |
| Intel Core i3 | 9 | 5.14% |
| AMD Ryzen 9 | 7 | 4% |
| Intel Core 2 Duo | 4 | 2.29% |
| Intel Pentium | 3 | 1.71% |
| Intel Atom | 3 | 1.71% |
| AMD Ryzen 7 PRO | 3 | 1.71% |
| AMD A10 | 3 | 1.71% |
| Intel Xeon | 2 | 1.14% |
| AMD Ryzen Threadripper | 2 | 1.14% |
| AMD Ryzen 3 | 2 | 1.14% |
| AMD FX | 2 | 1.14% |
| Intel Pentium Silver | 1 | 0.57% |
| Intel Pentium Dual-Core | 1 | 0.57% |
| AMD A8 | 1 | 0.57% |
| AMD A4 | 1 | 0.57% |
CPU Cores
Number of processor cores


| Number | Computers | Percent |
|---|---|---|
| 4 | 64 | 36.57% |
| 2 | 45 | 25.71% |
| 8 | 33 | 18.86% |
| 6 | 19 | 10.86% |
| 12 | 6 | 3.43% |
| 16 | 2 | 1.14% |
| 10 | 2 | 1.14% |
| 32 | 1 | 0.57% |
| 14 | 1 | 0.57% |
| 3 | 1 | 0.57% |
| 1 | 1 | 0.57% |
CPU Sockets
Number of sockets


| Number | Computers | Percent |
|---|---|---|
| 1 | 175 | 100% |
CPU Threads
Threads per core (Hyper-Threading)


| Number | Computers | Percent |
|---|---|---|
| 2 | 124 | 70.86% |
| 1 | 51 | 29.14% |
CPU Op-Modes
CPU Operation Modes (32-bit, 64-bit)


| Op mode | Computers | Percent |
|---|---|---|
| 32-bit, 64-bit | 175 | 100% |
CPU Microcode
Microcode number


| Number | Computers | Percent |
|---|---|---|
| Unknown | 106 | 60.57% |
| 0x306a9 | 6 | 3.43% |
| 0x08600106 | 6 | 3.43% |
| 0x806ec | 4 | 2.29% |
| 0x806c1 | 4 | 2.29% |
| 0x0a50000c | 4 | 2.29% |
| 0x08701021 | 4 | 2.29% |
| 0x906ea | 3 | 1.71% |
| 0x806d1 | 3 | 1.71% |
| 0x306c3 | 3 | 1.71% |
| 0x906a3 | 2 | 1.14% |
| 0x806ea | 2 | 1.14% |
| 0x306e4 | 2 | 1.14% |
| 0x206a7 | 2 | 1.14% |
| 0x0a201009 | 2 | 1.14% |
| 0x0800820d | 2 | 1.14% |
| 0x906c0 | 1 | 0.57% |
| 0x906a4 | 1 | 0.57% |
| 0x706e5 | 1 | 0.57% |
| 0x706a8 | 1 | 0.57% |
| 0x506e3 | 1 | 0.57% |
| 0x506ca | 1 | 0.57% |
| 0x406c4 | 1 | 0.57% |
| 0x40651 | 1 | 0.57% |
| 0x30673 | 1 | 0.57% |
| 0x20655 | 1 | 0.57% |
| 0x106e5 | 1 | 0.57% |
| 0x0a50000d | 1 | 0.57% |
| 0x0a404101 | 1 | 0.57% |
| 0x0a008204 | 1 | 0.57% |
| 0x08701013 | 1 | 0.57% |
| 0x08608103 | 1 | 0.57% |
| 0x08001137 | 1 | 0.57% |
| 0x07030105 | 1 | 0.57% |
| 0x0600611a | 1 | 0.57% |
| 0x03000027 | 1 | 0.57% |
CPU Microarch
Microarchitecture


| Name | Computers | Percent |
|---|---|---|
| KabyLake | 26 | 14.86% |
| Zen 2 | 20 | 11.43% |
| IvyBridge | 16 | 9.14% |
| Unknown | 15 | 8.57% |
| Zen 3 | 11 | 6.29% |
| TigerLake | 11 | 6.29% |
| Haswell | 11 | 6.29% |
| SandyBridge | 9 | 5.14% |
| Skylake | 8 | 4.57% |
| Zen+ | 6 | 3.43% |
| Silvermont | 6 | 3.43% |
| Penryn | 5 | 2.86% |
| Goldmont plus | 5 | 2.86% |
| Westmere | 4 | 2.29% |
| Icelake | 3 | 1.71% |
| Excavator | 3 | 1.71% |
| Alderlake Hybrid | 3 | 1.71% |
| Goldmont | 2 | 1.14% |
| Broadwell | 2 | 1.14% |
| Zen | 1 | 0.57% |
| Tremont | 1 | 0.57% |
| Steamroller | 1 | 0.57% |
| Puma | 1 | 0.57% |
| Piledriver | 1 | 0.57% |
| Nehalem | 1 | 0.57% |
| K10 Llano | 1 | 0.57% |
| CometLake | 1 | 0.57% |
| Bulldozer | 1 | 0.57% |
Graphics
GPU Vendor
Vendors of graphics cards


| Vendor | Computers | Percent |
|---|---|---|
| Intel | 95 | 45.02% |
| Nvidia | 60 | 28.44% |
| AMD | 55 | 26.07% |
| ASPEED Technology | 1 | 0.47% |
GPU Model
Graphics card models


| Model | Computers | Percent |
|---|---|---|
| Intel TigerLake-LP GT2 [Iris Xe Graphics] | 11 | 5.09% |
| AMD Renoir | 10 | 4.63% |
| Intel 2nd Generation Core Processor Family Integrated Graphics Controller | 7 | 3.24% |
| Intel 3rd Gen Core processor Graphics Controller | 6 | 2.78% |
| Intel UHD Graphics 620 | 5 | 2.31% |
| Intel CometLake-U GT2 [UHD Graphics] | 5 | 2.31% |
| Intel 4th Gen Core Processor Integrated Graphics Controller | 5 | 2.31% |
| AMD Cezanne | 5 | 2.31% |
| Nvidia GA106M [GeForce RTX 3060 Mobile / Max-Q] | 4 | 1.85% |
| Intel Haswell-ULT Integrated Graphics Controller | 4 | 1.85% |
| Intel GeminiLake [UHD Graphics 600] | 4 | 1.85% |
| AMD Rembrandt [Radeon 680M] | 4 | 1.85% |
| AMD Ellesmere [Radeon RX 470/480/570/570X/580/580X/590] | 4 | 1.85% |
| Intel TigerLake-H GT1 [UHD Graphics] | 3 | 1.39% |
| Intel HD Graphics 530 | 3 | 1.39% |
| Intel Core Processor Integrated Graphics Controller | 3 | 1.39% |
| Intel CoffeeLake-S GT2 [UHD Graphics 630] | 3 | 1.39% |
| Intel Atom/Celeron/Pentium Processor x5-E8000/J3xxx/N3xxx Integrated Graphics Controller | 3 | 1.39% |
| Intel Atom Processor Z36xxx/Z37xxx Series Graphics & Display | 3 | 1.39% |
| Intel Alder Lake-P Integrated Graphics Controller | 3 | 1.39% |
| AMD Lucienne | 3 | 1.39% |
| Nvidia TU117 [GeForce GTX 1650] | 2 | 0.93% |
| Nvidia GP108M [GeForce MX250] | 2 | 0.93% |
| Nvidia GP108M [GeForce MX230] | 2 | 0.93% |
| Nvidia GP107 [GeForce GTX 1050 Ti] | 2 | 0.93% |
| Nvidia GP104 [GeForce GTX 1070] | 2 | 0.93% |
| Nvidia GM206 [GeForce GTX 960] | 2 | 0.93% |
| Nvidia GM107M [GeForce GTX 860M] | 2 | 0.93% |
| Nvidia GA107M [GeForce RTX 3050 Mobile] | 2 | 0.93% |
| Nvidia GA104M [GeForce RTX 3070 Mobile / Max-Q] | 2 | 0.93% |
| Nvidia GA104 [Geforce RTX 3070 Ti Laptop GPU] | 2 | 0.93% |
| Intel WhiskeyLake-U GT2 [UHD Graphics 620] | 2 | 0.93% |
| Intel VGA compatible controller | 2 | 0.93% |
| Intel Mobile 4 Series Chipset Integrated Graphics Controller | 2 | 0.93% |
| Intel JasperLake [UHD Graphics] | 2 | 0.93% |
| Intel HD Graphics 630 | 2 | 0.93% |
| Intel HD Graphics 620 | 2 | 0.93% |
| Intel HD Graphics 5500 | 2 | 0.93% |
| Intel HD Graphics 500 | 2 | 0.93% |
| Intel 4 Series Chipset Integrated Graphics Controller | 2 | 0.93% |
GPU Combo
Combinations of graphics cards


| Name | Computers | Percent |
|---|---|---|
| 1 x Intel | 67 | 38.29% |
| 1 x AMD | 41 | 23.43% |
| 1 x Nvidia | 27 | 15.43% |
| Intel + Nvidia | 25 | 14.29% |
| AMD + Nvidia | 8 | 4.57% |
| 2 x AMD | 5 | 2.86% |
| Intel + AMD | 1 | 0.57% |
| 1 x ASPEED | 1 | 0.57% |
GPU Driver
Free vs proprietary


| Driver | Computers | Percent |
|---|---|---|
| Free | 136 | 77.71% |
| Proprietary | 39 | 22.29% |
GPU Memory
Total video memory


| Size in GB | Computers | Percent |
|---|---|---|
| Unknown | 117 | 66.86% |
| 1.01-2.0 | 15 | 8.57% |
| 3.01-4.0 | 12 | 6.86% |
| 7.01-8.0 | 10 | 5.71% |
| 0.01-0.5 | 8 | 4.57% |
| 0.51-1.0 | 7 | 4% |
| 5.01-6.0 | 5 | 2.86% |
| 8.01-16.0 | 1 | 0.57% |
Monitor
Monitor Vendor
Monitor vendors


| Vendor | Computers | Percent |
|---|---|---|
| Samsung Electronics | 26 | 12.09% |
| BOE | 23 | 10.7% |
| AU Optronics | 19 | 8.84% |
| Chimei Innolux | 18 | 8.37% |
| LG Display | 16 | 7.44% |
| Goldstar | 15 | 6.98% |
| Dell | 11 | 5.12% |
| BenQ | 8 | 3.72% |
| AOC | 8 | 3.72% |
| ViewSonic | 5 | 2.33% |
| PANDA | 5 | 2.33% |
| Lenovo | 5 | 2.33% |
| Sharp | 4 | 1.86% |
| Hewlett-Packard | 4 | 1.86% |
| ASUSTek Computer | 4 | 1.86% |
| Ancor Communications | 4 | 1.86% |
| Unknown | 3 | 1.4% |
| Philips | 3 | 1.4% |
| LG Electronics | 3 | 1.4% |
| InfoVision | 3 | 1.4% |
| Acer | 3 | 1.4% |
| Chi Mei Optoelectronics | 2 | 0.93% |
| ___ | 1 | 0.47% |
| Vizio | 1 | 0.47% |
| TRU | 1 | 0.47% |
| TMX | 1 | 0.47% |
| Sony | 1 | 0.47% |
| Plain Tree Systems | 1 | 0.47% |
| ONB | 1 | 0.47% |
| MStar | 1 | 0.47% |
| MSI | 1 | 0.47% |
| Microstep | 1 | 0.47% |
| Medion | 1 | 0.47% |
| Lenovo Group Limited | 1 | 0.47% |
| Iiyama | 1 | 0.47% |
| HPN | 1 | 0.47% |
| HannStar | 1 | 0.47% |
| Haier | 1 | 0.47% |
| FUS | 1 | 0.47% |
| FUN | 1 | 0.47% |
Monitor Model
Monitor models


| Model | Computers | Percent |
|---|---|---|
| Chimei Innolux LCD Monitor CMN15F5 1920x1080 344x193mm 15.5-inch | 3 | 1.35% |
| Samsung Electronics U28E590 SAM0C4D 3840x2160 607x345mm 27.5-inch | 2 | 0.9% |
| PANDA LCD Monitor NCP0040 1920x1080 344x194mm 15.5-inch | 2 | 0.9% |
| Goldstar ULTRAWIDE GSM59F1 2560x1080 798x334mm 34.1-inch | 2 | 0.9% |
| Goldstar LG HDR 4K GSM7707 3840x2160 600x340mm 27.2-inch | 2 | 0.9% |
| Goldstar IPS QHD GSM5BC4 2560x1440 527x296mm 23.8-inch | 2 | 0.9% |
| Goldstar FULL HD GSM5B55 1920x1080 480x270mm 21.7-inch | 2 | 0.9% |
| Dell P2419H DELD0DA 1920x1080 527x296mm 23.8-inch | 2 | 0.9% |
| BOE LCD Monitor BOE0872 1920x1080 344x194mm 15.5-inch | 2 | 0.9% |
| BOE LCD Monitor BOE07F6 1920x1080 309x174mm 14.0-inch | 2 | 0.9% |
| AU Optronics LCD Monitor AUOD1ED 1920x1080 344x193mm 15.5-inch | 2 | 0.9% |
| AOC Q3279WG5B AOC3279 2560x1440 725x428mm 33.1-inch | 2 | 0.9% |
| ___ LCD TV ___0101 1366x768 | 1 | 0.45% |
| Vizio D24h-G9 VIZ1028 1366x768 521x293mm 23.5-inch | 1 | 0.45% |
| ViewSonic VX2739wm VSC3F24 1920x1080 598x336mm 27.0-inch | 1 | 0.45% |
| ViewSonic VX2376 Series VSC3B32 1920x1080 509x286mm 23.0-inch | 1 | 0.45% |
| ViewSonic VA2730 Series VSCA539 1920x1080 598x336mm 27.0-inch | 1 | 0.45% |
| ViewSonic VA2418-FHD VSCD739 1920x1080 527x296mm 23.8-inch | 1 | 0.45% |
| ViewSonic VA2407 Series VSC8C31 1920x1080 521x293mm 23.5-inch | 1 | 0.45% |
| Unknown LCD TV 0101 1920x1080 1600x900mm 72.3-inch | 1 | 0.45% |
| Unknown LCD Monitor Toshiba TSB-TV 1920x1080 | 1 | 0.45% |
| Unknown LCD Monitor RTK | 1 | 0.45% |
| TRU LCD Monitor TRU235C 1366x768 256x144mm 11.6-inch | 1 | 0.45% |
| TMX TL140BDXP01-0 TMX1400 2560x1440 310x174mm 14.0-inch | 1 | 0.45% |
| Sony TV SNYE903 1920x1080 | 1 | 0.45% |
| Sharp LQ134N1JW55 SHP1558 1920x1200 288x180mm 13.4-inch | 1 | 0.45% |
| Sharp LCD Monitor SHP1515 1920x1200 336x210mm 15.6-inch | 1 | 0.45% |
| Sharp LCD Monitor SHP14F9 1920x1200 288x180mm 13.4-inch | 1 | 0.45% |
| Sharp LCD Monitor SHP14F7 1920x1200 288x180mm 13.4-inch | 1 | 0.45% |
| Samsung Electronics SyncMaster SAM05B0 1920x1080 | 1 | 0.45% |
| Samsung Electronics SyncMaster SAM03E5 1680x1050 474x296mm 22.0-inch | 1 | 0.45% |
| Samsung Electronics SyncMaster SAM0304 1680x1050 494x320mm 23.2-inch | 1 | 0.45% |
| Samsung Electronics SyncMaster SAM02E3 1440x900 367x229mm 17.0-inch | 1 | 0.45% |
| Samsung Electronics SMXL2370HD SAM072A 1920x1080 510x290mm 23.1-inch | 1 | 0.45% |
| Samsung Electronics SMT22A300 SAM087B 1920x1080 477x268mm 21.5-inch | 1 | 0.45% |
| Samsung Electronics S34J55x SAM0F70 3440x1440 797x333mm 34.0-inch | 1 | 0.45% |
| Samsung Electronics S27F350 SAM0D22 1920x1080 598x336mm 27.0-inch | 1 | 0.45% |
| Samsung Electronics S24D590 SAM0B47 1920x1080 521x293mm 23.5-inch | 1 | 0.45% |
| Samsung Electronics S22C650 SAM0A05 1920x1080 477x268mm 21.5-inch | 1 | 0.45% |
| Samsung Electronics LCD Monitor SEC5541 1366x768 344x193mm 15.5-inch | 1 | 0.45% |
Monitor Resolution
Monitor screen resolution


| Resolution | Computers | Percent |
|---|---|---|
| 1920x1080 (FHD) | 93 | 46.73% |
| 1366x768 (WXGA) | 30 | 15.08% |
| 3840x2160 (4K) | 16 | 8.04% |
| 2560x1440 (QHD) | 12 | 6.03% |
| 1920x1200 (WUXGA) | 6 | 3.02% |
| 1680x1050 (WSXGA+) | 6 | 3.02% |
| 2560x1080 | 5 | 2.51% |
| Unknown | 5 | 2.51% |
| 3840x1080 | 4 | 2.01% |
| 1600x900 (HD+) | 4 | 2.01% |
| 3440x1440 | 3 | 1.51% |
| 1440x900 (WXGA+) | 3 | 1.51% |
| 1280x800 (WXGA) | 2 | 1.01% |
| 1280x1024 (SXGA) | 2 | 1.01% |
| 5504x1440 | 1 | 0.5% |
| 5120x1440 | 1 | 0.5% |
| 3520x1080 | 1 | 0.5% |
| 3072x1920 | 1 | 0.5% |
| 2880x1800 | 1 | 0.5% |
| 2560x1600 | 1 | 0.5% |
| 2240x1400 | 1 | 0.5% |
| 2160x1440 | 1 | 0.5% |
Monitor Diagonal
Diagonal size in inches


| Inches | Computers | Percent |
|---|---|---|
| 15 | 51 | 24.06% |
| 14 | 20 | 9.43% |
| 13 | 17 | 8.02% |
| Unknown | 17 | 8.02% |
| 27 | 16 | 7.55% |
| 24 | 15 | 7.08% |
| 23 | 15 | 7.08% |
| 21 | 11 | 5.19% |
| 17 | 8 | 3.77% |
| 34 | 5 | 2.36% |
| 22 | 5 | 2.36% |
| 19 | 4 | 1.89% |
| 12 | 4 | 1.89% |
| 72 | 3 | 1.42% |
| 31 | 3 | 1.42% |
| 11 | 3 | 1.42% |
| 48 | 2 | 0.94% |
| 33 | 2 | 0.94% |
| 18 | 2 | 0.94% |
| 16 | 2 | 0.94% |
| 65 | 1 | 0.47% |
| 54 | 1 | 0.47% |
| 52 | 1 | 0.47% |
| 46 | 1 | 0.47% |
| 40 | 1 | 0.47% |
| 26 | 1 | 0.47% |
| 20 | 1 | 0.47% |
Monitor Width
Physical width


| Width in mm | Computers | Percent |
|---|---|---|
| 301-350 | 76 | 37.25% |
| 501-600 | 40 | 19.61% |
| 401-500 | 19 | 9.31% |
| 201-300 | 18 | 8.82% |
| Unknown | 17 | 8.33% |
| 351-400 | 12 | 5.88% |
| 701-800 | 7 | 3.43% |
| 601-700 | 6 | 2.94% |
| 1001-1500 | 5 | 2.45% |
| 1501-2000 | 3 | 1.47% |
| 801-900 | 1 | 0.49% |
Aspect Ratio
Proportional relationship between the width and the height


| Ratio | Computers | Percent |
|---|---|---|
| 16/9 | 138 | 75% |
| 16/10 | 20 | 10.87% |
| Unknown | 14 | 7.61% |
| 21/9 | 5 | 2.72% |
| 5/4 | 2 | 1.09% |
| 32/9 | 2 | 1.09% |
| 3/2 | 2 | 1.09% |
| 4/3 | 1 | 0.54% |
Monitor Area
Area in inch²


| Area in inch² | Computers | Percent |
|---|---|---|
| 101-110 | 51 | 24.52% |
| 201-250 | 32 | 15.38% |
| 81-90 | 27 | 12.98% |
| 301-350 | 17 | 8.17% |
| Unknown | 17 | 8.17% |
| 71-80 | 10 | 4.81% |
| 351-500 | 10 | 4.81% |
| 151-200 | 10 | 4.81% |
| 121-130 | 7 | 3.37% |
| More than 1000 | 6 | 2.88% |
| 251-300 | 5 | 2.4% |
| 501-1000 | 4 | 1.92% |
| 61-70 | 3 | 1.44% |
| 51-60 | 3 | 1.44% |
| 141-150 | 2 | 0.96% |
| 111-120 | 2 | 0.96% |
| 131-140 | 1 | 0.48% |
| 91-100 | 1 | 0.48% |
Pixel Density
Pixels per inch


| Density | Computers | Percent |
|---|---|---|
| 121-160 | 63 | 30.88% |
| 51-100 | 56 | 27.45% |
| 101-120 | 39 | 19.12% |
| 161-240 | 21 | 10.29% |
| Unknown | 17 | 8.33% |
| 1-50 | 6 | 2.94% |
| More than 240 | 2 | 0.98% |
Multiple Monitors
Total monitors connected


| Total | Computers | Percent |
|---|---|---|
| 1 | 131 | 74.86% |
| 2 | 38 | 21.71% |
| 3 | 6 | 3.43% |
Network
Net Controller Vendor
Controller vendors


| Vendor | Computers | Percent |
|---|---|---|
| Realtek Semiconductor | 94 | 36.58% |
| Intel | 93 | 36.19% |
| Qualcomm Atheros | 24 | 9.34% |
| Broadcom | 8 | 3.11% |
| MediaTek | 7 | 2.72% |
| TP-Link | 5 | 1.95% |
| Ralink | 3 | 1.17% |
| Lenovo | 3 | 1.17% |
| ASIX Electronics | 3 | 1.17% |
| Ralink Technology | 2 | 0.78% |
| Huawei Technologies | 2 | 0.78% |
| DisplayLink | 2 | 0.78% |
| Xiaomi | 1 | 0.39% |
| U-Blox | 1 | 0.39% |
| Sierra Wireless | 1 | 0.39% |
| Samsung Electronics | 1 | 0.39% |
| Qualcomm | 1 | 0.39% |
| NetGear | 1 | 0.39% |
| Microsoft | 1 | 0.39% |
| Mercucys | 1 | 0.39% |
| Mellanox Technologies | 1 | 0.39% |
| Marvell Technology Group | 1 | 0.39% |
| Broadcom Limited | 1 | 0.39% |
Net Controller Model
Controller models


| Model | Computers | Percent |
|---|---|---|
| Realtek RTL8111/8168/8411 PCI Express Gigabit Ethernet Controller | 62 | 21.02% |
| Intel Wi-Fi 6 AX200 | 14 | 4.75% |
| Realtek RTL8125 2.5GbE Controller | 11 | 3.73% |
| Intel I211 Gigabit Network Connection | 9 | 3.05% |
| Intel Wi-Fi 6 AX201 | 8 | 2.71% |
| Realtek RTL8822CE 802.11ac PCIe Wireless Network Adapter | 7 | 2.37% |
| Realtek RTL8821CE 802.11ac PCIe Wireless Network Adapter | 6 | 2.03% |
| Realtek RTL810xE PCI Express Fast Ethernet controller | 6 | 2.03% |
| Qualcomm Atheros QCA9565 / AR9565 Wireless Network Adapter | 6 | 2.03% |
| Intel Wireless 7265 | 6 | 2.03% |
| Intel Wireless 8265 / 8275 | 5 | 1.69% |
| Intel Wireless 7260 | 5 | 1.69% |
| Intel Comet Lake PCH-LP CNVi WiFi | 5 | 1.69% |
| Intel Alder Lake-P PCH CNVi WiFi | 5 | 1.69% |
| Realtek RTL8723BE PCIe Wireless Network Adapter | 4 | 1.36% |
| Qualcomm Atheros QCA9377 802.11ac Wireless Network Adapter | 4 | 1.36% |
| Qualcomm Atheros AR9485 Wireless Network Adapter | 4 | 1.36% |
| Intel Ethernet Connection (2) I219-V | 4 | 1.36% |
| Qualcomm Atheros AR9287 Wireless Network Adapter (PCI-Express) | 3 | 1.02% |
| Intel Wi-Fi 6 AX210/AX211/AX411 160MHz | 3 | 1.02% |
| Intel Ethernet Connection I217-LM | 3 | 1.02% |
| Intel Ethernet Connection (7) I219-V | 3 | 1.02% |
| Intel 82579V Gigabit Network Connection | 3 | 1.02% |
| Intel 82579LM Gigabit Network Connection (Lewisville) | 3 | 1.02% |
| Realtek RTL8821AE 802.11ac PCIe Wireless Network Adapter | 2 | 0.68% |
| Realtek RTL8169 PCI Gigabit Ethernet Controller | 2 | 0.68% |
| Realtek RTL8153 Gigabit Ethernet Adapter | 2 | 0.68% |
| Realtek RTL8152 Fast Ethernet Adapter | 2 | 0.68% |
| Qualcomm Atheros AR8151 v2.0 Gigabit Ethernet | 2 | 0.68% |
| MediaTek MT7922 802.11ax PCI Express Wireless Network Adapter | 2 | 0.68% |
| MediaTek MT7921 802.11ax PCI Express Wireless Network Adapter | 2 | 0.68% |
| Intel Wireless 8260 | 2 | 0.68% |
| Intel Tiger Lake PCH CNVi WiFi | 2 | 0.68% |
| Intel Ethernet Controller I225-V | 2 | 0.68% |
| Intel Cannon Point-LP CNVi [Wireless-AC] | 2 | 0.68% |
| Intel Cannon Lake PCH CNVi WiFi | 2 | 0.68% |
| Intel 82574L Gigabit Network Connection | 2 | 0.68% |
| Broadcom NetLink BCM57785 Gigabit Ethernet PCIe | 2 | 0.68% |
| ASIX AX88179 Gigabit Ethernet | 2 | 0.68% |
| Xiaomi Mi/Redmi series (RNDIS) | 1 | 0.34% |
Wireless Vendor
Wireless vendors


| Vendor | Computers | Percent |
|---|---|---|
| Intel | 68 | 49.28% |
| Realtek Semiconductor | 24 | 17.39% |
| Qualcomm Atheros | 19 | 13.77% |
| MediaTek | 7 | 5.07% |
| TP-Link | 5 | 3.62% |
| Broadcom | 4 | 2.9% |
| Ralink | 3 | 2.17% |
| Ralink Technology | 2 | 1.45% |
| Sierra Wireless | 1 | 0.72% |
| Qualcomm | 1 | 0.72% |
| NetGear | 1 | 0.72% |
| Microsoft | 1 | 0.72% |
| Mercucys | 1 | 0.72% |
| Broadcom Limited | 1 | 0.72% |
Wireless Model
Wireless models


| Model | Computers | Percent |
|---|---|---|
| Intel Wi-Fi 6 AX200 | 14 | 10.14% |
| Intel Wi-Fi 6 AX201 | 8 | 5.8% |
| Realtek RTL8822CE 802.11ac PCIe Wireless Network Adapter | 7 | 5.07% |
| Realtek RTL8821CE 802.11ac PCIe Wireless Network Adapter | 6 | 4.35% |
| Qualcomm Atheros QCA9565 / AR9565 Wireless Network Adapter | 6 | 4.35% |
| Intel Wireless 7265 | 6 | 4.35% |
| Intel Wireless 8265 / 8275 | 5 | 3.62% |
| Intel Wireless 7260 | 5 | 3.62% |
| Intel Comet Lake PCH-LP CNVi WiFi | 5 | 3.62% |
| Intel Alder Lake-P PCH CNVi WiFi | 5 | 3.62% |
| Realtek RTL8723BE PCIe Wireless Network Adapter | 4 | 2.9% |
| Qualcomm Atheros QCA9377 802.11ac Wireless Network Adapter | 4 | 2.9% |
| Qualcomm Atheros AR9485 Wireless Network Adapter | 4 | 2.9% |
| Qualcomm Atheros AR9287 Wireless Network Adapter (PCI-Express) | 3 | 2.17% |
| Intel Wi-Fi 6 AX210/AX211/AX411 160MHz | 3 | 2.17% |
| Realtek RTL8821AE 802.11ac PCIe Wireless Network Adapter | 2 | 1.45% |
| MediaTek MT7922 802.11ax PCI Express Wireless Network Adapter | 2 | 1.45% |
| MediaTek MT7921 802.11ax PCI Express Wireless Network Adapter | 2 | 1.45% |
| Intel Wireless 8260 | 2 | 1.45% |
| Intel Tiger Lake PCH CNVi WiFi | 2 | 1.45% |
| Intel Cannon Point-LP CNVi [Wireless-AC] | 2 | 1.45% |
| Intel Cannon Lake PCH CNVi WiFi | 2 | 1.45% |
| TP-Link TL-WN823N v2/v3 [Realtek RTL8192EU] | 1 | 0.72% |
| TP-Link TL-WN821N v5/v6 [RTL8192EU] | 1 | 0.72% |
| TP-Link Archer T4U ver.3 | 1 | 0.72% |
| TP-Link Archer T3U [Realtek RTL8812BU] | 1 | 0.72% |
| TP-Link AC600 wireless Realtek RTL8811AU [Archer T2U Nano] | 1 | 0.72% |
| Sierra Wireless EM7455 Qualcomm Snapdragon X7 LTE-A | 1 | 0.72% |
| Realtek RTL88x2bu [AC1200 Techkey] | 1 | 0.72% |
| Realtek RTL8811AU 802.11a/b/g/n/ac WLAN Adapter | 1 | 0.72% |
| Realtek RTL8723BU 802.11b/g/n WLAN Adapter | 1 | 0.72% |
| Realtek Realtek Network controller | 1 | 0.72% |
| Realtek 802.11ac NIC | 1 | 0.72% |
| Ralink WLAN controller | 1 | 0.72% |
| Ralink RT5370 Wireless Adapter | 1 | 0.72% |
| Ralink MT7601U Wireless Adapter | 1 | 0.72% |
| Ralink RT3290 Wireless 802.11n 1T/1R PCIe | 1 | 0.72% |
| Ralink RT3092 Wireless 802.11n 2T/2R PCIe | 1 | 0.72% |
| Qualcomm QCNFA765 Wireless Network Adapter | 1 | 0.72% |
| Qualcomm Atheros QCA6174 802.11ac Wireless Network Adapter | 1 | 0.72% |
Ethernet Vendor
Ethernet vendors


| Vendor | Computers | Percent |
|---|---|---|
| Realtek Semiconductor | 82 | 54.67% |
| Intel | 41 | 27.33% |
| Qualcomm Atheros | 8 | 5.33% |
| Broadcom | 5 | 3.33% |
| Lenovo | 3 | 2% |
| ASIX Electronics | 3 | 2% |
| Huawei Technologies | 2 | 1.33% |
| DisplayLink | 2 | 1.33% |
| Xiaomi | 1 | 0.67% |
| Samsung Electronics | 1 | 0.67% |
| Mellanox Technologies | 1 | 0.67% |
| Marvell Technology Group | 1 | 0.67% |
Ethernet Model
Ethernet models


| Model | Computers | Percent |
|---|---|---|
| Realtek RTL8111/8168/8411 PCI Express Gigabit Ethernet Controller | 62 | 39.74% |
| Realtek RTL8125 2.5GbE Controller | 11 | 7.05% |
| Intel I211 Gigabit Network Connection | 9 | 5.77% |
| Realtek RTL810xE PCI Express Fast Ethernet controller | 6 | 3.85% |
| Intel Ethernet Connection (2) I219-V | 4 | 2.56% |
| Intel Ethernet Connection I217-LM | 3 | 1.92% |
| Intel Ethernet Connection (7) I219-V | 3 | 1.92% |
| Intel 82579V Gigabit Network Connection | 3 | 1.92% |
| Intel 82579LM Gigabit Network Connection (Lewisville) | 3 | 1.92% |
| Realtek RTL8169 PCI Gigabit Ethernet Controller | 2 | 1.28% |
| Realtek RTL8153 Gigabit Ethernet Adapter | 2 | 1.28% |
| Realtek RTL8152 Fast Ethernet Adapter | 2 | 1.28% |
| Qualcomm Atheros AR8151 v2.0 Gigabit Ethernet | 2 | 1.28% |
| Intel Ethernet Controller I225-V | 2 | 1.28% |
| Intel 82574L Gigabit Network Connection | 2 | 1.28% |
| Broadcom NetLink BCM57785 Gigabit Ethernet PCIe | 2 | 1.28% |
| ASIX AX88179 Gigabit Ethernet | 2 | 1.28% |
| Xiaomi Mi/Redmi series (RNDIS) | 1 | 0.64% |
| Samsung GT-I9070 (network tethering, USB debugging enabled) | 1 | 0.64% |
| Realtek Killer E3000 2.5GbE Controller | 1 | 0.64% |
| Qualcomm Atheros Killer E2500 Gigabit Ethernet Controller | 1 | 0.64% |
| Qualcomm Atheros Killer E2400 Gigabit Ethernet Controller | 1 | 0.64% |
| Qualcomm Atheros AR8162 Fast Ethernet | 1 | 0.64% |
| Qualcomm Atheros AR8161 Gigabit Ethernet | 1 | 0.64% |
| Qualcomm Atheros AR8152 v2.0 Fast Ethernet | 1 | 0.64% |
| Qualcomm Atheros AR8151 v1.0 Gigabit Ethernet | 1 | 0.64% |
| Mellanox MT27500 Family [ConnectX-3] | 1 | 0.64% |
| Marvell Group 88E8056 PCI-E Gigabit Ethernet Controller | 1 | 0.64% |
| Lenovo ThinkPad TBT3 LAN | 1 | 0.64% |
| Lenovo ThinkPad TBT 3 Dock | 1 | 0.64% |
| Lenovo ThinkPad Lan | 1 | 0.64% |
| Intel I210 Gigabit Network Connection | 1 | 0.64% |
| Intel Ethernet Controller X550 | 1 | 0.64% |
| Intel Ethernet Connection I219-V | 1 | 0.64% |
| Intel Ethernet Connection (7) I219-LM | 1 | 0.64% |
| Intel Ethernet Connection (6) I219-V | 1 | 0.64% |
| Intel Ethernet Connection (5) I219-LM | 1 | 0.64% |
| Intel Ethernet Connection (4) I219-LM | 1 | 0.64% |
| Intel Ethernet Connection (3) I218-LM | 1 | 0.64% |
| Intel Ethernet Connection (2) I219-LM | 1 | 0.64% |
Net Controller Kind
Ethernet, WiFi or modem


| Kind | Computers | Percent |
|---|---|---|
| Ethernet | 134 | 50.19% |
| WiFi | 132 | 49.44% |
| Modem | 1 | 0.37% |
Used Controller
Currently used network controller


| Kind | Computers | Percent |
|---|---|---|
| WiFi | 106 | 58.89% |
| Ethernet | 74 | 41.11% |
NICs
Total network controllers on board


| Total | Computers | Percent |
|---|---|---|
| 2 | 89 | 50.86% |
| 1 | 78 | 44.57% |
| 0 | 5 | 2.86% |
| 3 | 3 | 1.71% |
IPv6
IPv6 vs IPv4


| Used | Computers | Percent |
|---|---|---|
| No | 124 | 70.86% |
| Yes | 51 | 29.14% |
Bluetooth
Bluetooth Vendor
Controller vendors


| Vendor | Computers | Percent |
|---|---|---|
| Intel | 61 | 48.41% |
| Realtek Semiconductor | 21 | 16.67% |
| Cambridge Silicon Radio | 10 | 7.94% |
| Qualcomm Atheros Communications | 6 | 4.76% |
| Foxconn / Hon Hai | 5 | 3.97% |
| Lite-On Technology | 4 | 3.17% |
| IMC Networks | 4 | 3.17% |
| Broadcom | 4 | 3.17% |
| Realtek | 2 | 1.59% |
| ASUSTek Computer | 2 | 1.59% |
| USI | 1 | 0.79% |
| TP-Link | 1 | 0.79% |
| Ralink | 1 | 0.79% |
| MediaTek | 1 | 0.79% |
| Foxconn International | 1 | 0.79% |
| Dynex | 1 | 0.79% |
| Apple | 1 | 0.79% |
Bluetooth Model
Controller models


| Model | Computers | Percent |
|---|---|---|
| Intel Bluetooth wireless interface | 17 | 13.49% |
| Intel AX201 Bluetooth | 16 | 12.7% |
| Realtek Bluetooth Radio | 15 | 11.9% |
| Intel AX200 Bluetooth | 14 | 11.11% |
| Cambridge Silicon Radio Bluetooth Dongle (HCI mode) | 10 | 7.94% |
| Intel Bluetooth 9460/9560 Jefferson Peak (JfP) | 7 | 5.56% |
| Realtek Bluetooth 4.2 Adapter | 3 | 2.38% |
| Intel Bluetooth Device | 3 | 2.38% |
| Foxconn / Hon Hai Wireless_Device | 3 | 2.38% |
| Realtek RTL8821A Bluetooth | 2 | 1.59% |
| Realtek Bluetooth Radio | 2 | 1.59% |
| Qualcomm Atheros Bluetooth Device | 2 | 1.59% |
| Lite-On Qualcomm Atheros QCA9377 Bluetooth | 2 | 1.59% |
| Intel AX210 Bluetooth | 2 | 1.59% |
| IMC Networks Bluetooth Device | 2 | 1.59% |
| Broadcom BCM20702A0 Bluetooth 4.0 | 2 | 1.59% |
| USI Bluetooth Device | 1 | 0.79% |
| TP-Link TPuLink UB500 Adapter | 1 | 0.79% |
| Realtek RTL8723B Bluetooth | 1 | 0.79% |
| Ralink RT3290 Bluetooth | 1 | 0.79% |
| Qualcomm Atheros Bluetooth USB Host Controller | 1 | 0.79% |
| Qualcomm Atheros AR9462 Bluetooth | 1 | 0.79% |
| Qualcomm Atheros AR3012 Bluetooth 4.0 | 1 | 0.79% |
| Qualcomm Atheros AR3011 Bluetooth | 1 | 0.79% |
| MediaTek Wireless_Device | 1 | 0.79% |
| Lite-On Wireless_Device | 1 | 0.79% |
| Lite-On Bluetooth Device | 1 | 0.79% |
| Intel Wireless-AC 9260 Bluetooth Adapter | 1 | 0.79% |
| Intel Wireless-AC 3168 Bluetooth | 1 | 0.79% |
| IMC Networks Wireless_Device | 1 | 0.79% |
| IMC Networks Bluetooth Radio | 1 | 0.79% |
| Foxconn International BCM43142A0 Bluetooth module | 1 | 0.79% |
| Foxconn / Hon Hai BT | 1 | 0.79% |
| Foxconn / Hon Hai Bluetooth Device | 1 | 0.79% |
| Dynex Bluetooth 4.0 Adapter [Broadcom, 1.12, BCM20702A0] | 1 | 0.79% |
| Broadcom HP Portable SoftSailing | 1 | 0.79% |
| Broadcom HP Bluetooth Module | 1 | 0.79% |
| ASUS Bluetooth Adapter | 1 | 0.79% |
| ASUS ASUS USB-BT500 | 1 | 0.79% |
| Apple Bluetooth Host Controller | 1 | 0.79% |
Sound
Sound Vendor
Sound card vendors


| Vendor | Computers | Percent |
|---|---|---|
| Intel | 116 | 44.96% |
| AMD | 61 | 23.64% |
| Nvidia | 40 | 15.5% |
| C-Media Electronics | 9 | 3.49% |
| RODE Microphones | 2 | 0.78% |
| Logitech | 2 | 0.78% |
| Lenovo | 2 | 0.78% |
| JMTek | 2 | 0.78% |
| Giga-Byte Technology | 2 | 0.78% |
| Generalplus Technology | 2 | 0.78% |
| Creative Technology | 2 | 0.78% |
| Creative Labs | 2 | 0.78% |
| VIA Technologies | 1 | 0.39% |
| Texas Instruments | 1 | 0.39% |
| SteelSeries ApS | 1 | 0.39% |
| Soundprese | 1 | 0.39% |
| Sennheiser Communications | 1 | 0.39% |
| Realtek Semiconductor | 1 | 0.39% |
| Plantronics | 1 | 0.39% |
| miniDSP | 1 | 0.39% |
| Medeli Electronics | 1 | 0.39% |
| GYROCOM C&C | 1 | 0.39% |
| Focusrite-Novation | 1 | 0.39% |
| DSEA A/S | 1 | 0.39% |
| Compal Electronics | 1 | 0.39% |
| Blue Microphones | 1 | 0.39% |
| BEHRINGER International | 1 | 0.39% |
| Alesis | 1 | 0.39% |
Sound Model
Sound card models


| Model | Computers | Percent |
|---|---|---|
| AMD Family 17h/19h HD Audio Controller | 23 | 7.4% |
| AMD Renoir Radeon High Definition Audio Controller | 17 | 5.47% |
| AMD Starship/Matisse HD Audio Controller | 13 | 4.18% |
| Intel 7 Series/C216 Chipset Family High Definition Audio Controller | 12 | 3.86% |
| Intel Tiger Lake-LP Smart Sound Technology Audio Controller | 11 | 3.54% |
| Intel 6 Series/C200 Series Chipset Family High Definition Audio Controller | 10 | 3.22% |
| Intel Sunrise Point-LP HD Audio | 9 | 2.89% |
| Intel 100 Series/C230 Series Chipset Family HD Audio Controller | 7 | 2.25% |
| Nvidia GA104 High Definition Audio Controller | 6 | 1.93% |
| Intel Xeon E3-1200 v3/4th Gen Core Processor HD Audio Controller | 6 | 1.93% |
| Intel 8 Series/C220 Series Chipset High Definition Audio Controller | 6 | 1.93% |
| AMD Family 17h (Models 00h-0fh) HD Audio Controller | 6 | 1.93% |
| Intel Comet Lake PCH-LP cAVS | 5 | 1.61% |
| Intel Celeron/Pentium Silver Processor High Definition Audio | 5 | 1.61% |
| Intel Cannon Lake PCH cAVS | 5 | 1.61% |
| Intel Alder Lake PCH-P High Definition Audio Controller | 5 | 1.61% |
| Intel 200 Series PCH HD Audio | 5 | 1.61% |
| AMD Navi 21/23 HDMI/DP Audio Controller | 5 | 1.61% |
| Nvidia GP104 High Definition Audio Controller | 4 | 1.29% |
| Intel Haswell-ULT HD Audio Controller | 4 | 1.29% |
| Intel 8 Series HD Audio Controller | 4 | 1.29% |
| Intel 5 Series/3400 Series Chipset High Definition Audio | 4 | 1.29% |
| C-Media Electronics Audio Adapter (Unitek Y-247A) | 4 | 1.29% |
| AMD Oland/Hainan/Cape Verde/Pitcairn HDMI Audio [Radeon HD 7000 Series] | 4 | 1.29% |
| AMD FCH Azalia Controller | 4 | 1.29% |
| AMD Ellesmere HDMI Audio [Radeon RX 470/480 / 570/580/590] | 4 | 1.29% |
| Nvidia TU107 GeForce GTX 1650 High Definition Audio Controller | 3 | 0.96% |
| Nvidia GF108 High Definition Audio Controller | 3 | 0.96% |
| Nvidia GA106 High Definition Audio Controller | 3 | 0.96% |
| Intel Tiger Lake-H HD Audio Controller | 3 | 0.96% |
| AMD Rembrandt Radeon High Definition Audio Controller | 3 | 0.96% |
| AMD Kabini HDMI/DP Audio | 3 | 0.96% |
| AMD Family 15h (Models 60h-6fh) Audio Controller | 3 | 0.96% |
| AMD Baffin HDMI/DP Audio [Radeon RX 550 640SP / RX 560/560X] | 3 | 0.96% |
| Nvidia TU106 High Definition Audio Controller | 2 | 0.64% |
| Nvidia TU104 HD Audio Controller | 2 | 0.64% |
| Nvidia GP107GL High Definition Audio Controller | 2 | 0.64% |
| Nvidia GM206 High Definition Audio Controller | 2 | 0.64% |
| Nvidia GM107 High Definition Audio Controller [GeForce 940MX] | 2 | 0.64% |
| Nvidia GK208 HDMI/DP Audio Controller | 2 | 0.64% |
Memory
Memory Vendor
Memory module vendors


| Vendor | Computers | Percent |
|---|---|---|
| Samsung Electronics | 22 | 22.68% |
| SK hynix | 16 | 16.49% |
| Micron Technology | 14 | 14.43% |
| Crucial | 9 | 9.28% |
| Kingston | 8 | 8.25% |
| Corsair | 8 | 8.25% |
| G.Skill | 6 | 6.19% |
| Unknown | 5 | 5.15% |
| Unknown (ABCD) | 2 | 2.06% |
| Team | 2 | 2.06% |
| Patriot | 2 | 2.06% |
| Unknown (AB) | 1 | 1.03% |
| Ramaxel Technology | 1 | 1.03% |
| A-DATA Technology | 1 | 1.03% |
Memory Model
Memory module models


| Model | Computers | Percent |
|---|---|---|
| Samsung RAM M471A1K43CB1-CRC 8GB SODIMM DDR4 2667MT/s | 3 | 3% |
| SK hynix RAM HMAB2GS6AMR6N-XN 16GB SODIMM DDR4 3200MT/s | 2 | 2% |
| SK hynix RAM HMAA1GS6CJR6N-XN 8192MB SODIMM DDR4 3200MT/s | 2 | 2% |
| Samsung RAM M471A1G44AB0-CWE 8GB SODIMM DDR4 3200MT/s | 2 | 2% |
| Unknown RAM Module 8GB SODIMM DDR3 800MT/s | 1 | 1% |
| Unknown RAM Module 8GB SODIMM DDR3 1600MT/s | 1 | 1% |
| Unknown RAM Module 4GB DIMM 1333MT/s | 1 | 1% |
| Unknown RAM Module 2GB Row Of Chips LPDDR4 4267MT/s | 1 | 1% |
| Unknown RAM Module 2GB DIMM 1333MT/s | 1 | 1% |
| Unknown RAM Module 1GB SODIMM DDR3 1066MT/s | 1 | 1% |
| Unknown (ABCD) RAM 123456789012345678 8GB DIMM DDR4 2400MT/s | 1 | 1% |
| Unknown (ABCD) RAM 123456789012345678 2GB SODIMM LPDDR4 2400MT/s | 1 | 1% |
| Unknown (AB) RAM Module 3GB DIMM LPDDR3 1600MT/s | 1 | 1% |
| Team RAM TEAMGROUP-UD4-2666 8GB DIMM DDR4 2667MT/s | 1 | 1% |
| Team RAM Elite-1600 8GB DIMM DDR3 1600MT/s | 1 | 1% |
| SK hynix RAM Module 8GB SODIMM DDR4 2400MT/s | 1 | 1% |
| SK hynix RAM Module 8GB DIMM DDR4 2666MT/s | 1 | 1% |
| SK hynix RAM Module 32GB SODIMM DDR4 2667MT/s | 1 | 1% |
| SK hynix RAM Module 16GB SODIMM DDR4 3200MT/s | 1 | 1% |
| SK hynix RAM HMT451S6MFR8C-PB 4GB SODIMM DDR3 1600MT/s | 1 | 1% |
| SK hynix RAM HMT451S6BFR8A-PB 4GB SODIMM DDR3 1600MT/s | 1 | 1% |
| SK hynix RAM HMT351S6CFR8C-PB 4GB SODIMM DDR3 1600MT/s | 1 | 1% |
| SK hynix RAM HMT325S6CFR8C-PB 2GB SODIMM DDR3 1600MT/s | 1 | 1% |
| SK hynix RAM HMT325S6BFR8C-H9 2GB SODIMM DDR3 1333MT/s | 1 | 1% |
| SK hynix RAM HMAB2GS6AMR6N-XN 16GB Row Of Chips DDR4 3200MT/s | 1 | 1% |
| SK hynix RAM HMA851S6CJR6N-VK 4GB SODIMM DDR4 2667MT/s | 1 | 1% |
| SK hynix RAM HMA82GS6JJR8N-VK 16GB SODIMM DDR4 2667MT/s | 1 | 1% |
| SK hynix RAM H5ANAG6NCMR-XNC 8GB Row Of Chips DDR4 3200MT/s | 1 | 1% |
| Samsung RAM UBE3D4AA-MGCR 8GB Row Of Chips LPDDR4 4267MT/s | 1 | 1% |
| Samsung RAM Module 16GB SODIMM DDR4 3200MT/s | 1 | 1% |
| Samsung RAM M471B5773CHS-CH9 2GB SODIMM DDR3 4199MT/s | 1 | 1% |
| Samsung RAM M471B1G73EB0-YK0 8GB SODIMM DDR3 1600MT/s | 1 | 1% |
| Samsung RAM M471A5244CB0-CWE 4GB SODIMM DDR4 3200MT/s | 1 | 1% |
| Samsung RAM M471A5244CB0-CWE 4GB Row Of Chips DDR4 3200MT/s | 1 | 1% |
| Samsung RAM M471A2G43BB2-CWE 16GB SODIMM DDR4 3200MT/s | 1 | 1% |
| Samsung RAM M471A1K44BM0-CRC 8GB SODIMM DDR4 2400MT/s | 1 | 1% |
| Samsung RAM M471A1K43EB1-CWE 8GB SODIMM DDR4 3200MT/s | 1 | 1% |
| Samsung RAM M471A1G44AB0-CWE 8GB Row Of Chips DDR4 3200MT/s | 1 | 1% |
| Samsung RAM M425R2GA3BB0-CQKOD 16GB SODIMM DDR5 4800MT/s | 1 | 1% |
| Samsung RAM M425R1GB4BB0-CQKOL 8GB SODIMM DDR5 4800MT/s | 1 | 1% |
Memory Kind
Memory module kinds


| Kind | Computers | Percent |
|---|---|---|
| DDR4 | 52 | 60.47% |
| DDR3 | 18 | 20.93% |
| LPDDR4 | 7 | 8.14% |
| SDRAM | 2 | 2.33% |
| LPDDR5 | 2 | 2.33% |
| LPDDR3 | 2 | 2.33% |
| DDR5 | 2 | 2.33% |
| Unknown | 1 | 1.16% |
Memory Form Factor
Physical design of the memory module


| Name | Computers | Percent |
|---|---|---|
| SODIMM | 42 | 50% |
| DIMM | 28 | 33.33% |
| Row Of Chips | 14 | 16.67% |
Memory Size
Memory module size


| Size | Computers | Percent |
|---|---|---|
| 8192 | 38 | 42.22% |
| 16384 | 20 | 22.22% |
| 4096 | 15 | 16.67% |
| 2048 | 8 | 8.89% |
| 32768 | 6 | 6.67% |
| 65536 | 1 | 1.11% |
| 3072 | 1 | 1.11% |
| 1024 | 1 | 1.11% |
Memory Speed
Memory module speed


| Speed | Computers | Percent |
|---|---|---|
| 3200 | 30 | 32.97% |
| 1600 | 14 | 15.38% |
| 2667 | 11 | 12.09% |
| 2400 | 8 | 8.79% |
| 2133 | 4 | 4.4% |
| 4267 | 3 | 3.3% |
| 6400 | 2 | 2.2% |
| 4800 | 2 | 2.2% |
| 3600 | 2 | 2.2% |
| 2666 | 2 | 2.2% |
| 1334 | 2 | 2.2% |
| 1333 | 2 | 2.2% |
| 4266 | 1 | 1.1% |
| 4199 | 1 | 1.1% |
| 3666 | 1 | 1.1% |
| 3400 | 1 | 1.1% |
| 3000 | 1 | 1.1% |
| 1867 | 1 | 1.1% |
| 1866 | 1 | 1.1% |
| 1066 | 1 | 1.1% |
| 800 | 1 | 1.1% |
Printers & scanners
Printer Vendor
Printer device vendors


| Vendor | Computers | Percent |
|---|---|---|
| Canon | 2 | 66.67% |
| Ricoh | 1 | 33.33% |
Printer Model
Printer device models


| Model | Computers | Percent |
|---|---|---|
| Ricoh SP 112SU | 1 | 33.33% |
| Canon TS3500 series | 1 | 33.33% |
| Canon G4010 series | 1 | 33.33% |
Scanner Vendor
Scanner device vendors


| Vendor | Computers | Percent |
|---|---|---|
| Mustek Systems | 1 | 100% |
Scanner Model
Scanner device models


| Model | Computers | Percent |
|---|---|---|
| Mustek Systems ScanExpress A3 USB 1200 PRO | 1 | 100% |
Camera
Camera Vendor
Camera device vendors


| Vendor | Computers | Percent |
|---|---|---|
| Chicony Electronics | 21 | 18.26% |
| IMC Networks | 12 | 10.43% |
| Acer | 12 | 10.43% |
| Microdia | 9 | 7.83% |
| Realtek Semiconductor | 6 | 5.22% |
| Quanta | 6 | 5.22% |
| Logitech | 6 | 5.22% |
| Alcor Micro | 6 | 5.22% |
| Lite-On Technology | 5 | 4.35% |
| Sunplus Innovation Technology | 4 | 3.48% |
| Luxvisions Innotech Limited | 3 | 2.61% |
| Sonix Technology | 2 | 1.74% |
| Microsoft | 2 | 1.74% |
| Cheng Uei Precision Industry (Foxlink) | 2 | 1.74% |
| Z-Star Microelectronics | 1 | 0.87% |
| YGTek | 1 | 0.87% |
| Tripath Technology | 1 | 0.87% |
| Syntek | 1 | 0.87% |
| SunplusIT | 1 | 0.87% |
| SHENZHEN EMEET TECHNOLOGY | 1 | 0.87% |
| Samsung Electronics | 1 | 0.87% |
| Philips (or NXP) | 1 | 0.87% |
| Owon | 1 | 0.87% |
| Novatek Microelectronics | 1 | 0.87% |
| Lenovo | 1 | 0.87% |
| Jieli Technology | 1 | 0.87% |
| Intel | 1 | 0.87% |
| icSpring | 1 | 0.87% |
| GEMBIRD | 1 | 0.87% |
| Creative Technology | 1 | 0.87% |
| ARC International | 1 | 0.87% |
| Apple | 1 | 0.87% |
| ALi | 1 | 0.87% |
Camera Model
Camera device models


| Model | Computers | Percent |
|---|---|---|
| IMC Networks USB2.0 HD UVC WebCam | 5 | 4.35% |
| Chicony Integrated Camera | 5 | 4.35% |
| Acer Integrated Camera | 5 | 4.35% |
| Microdia Integrated_Webcam_HD | 4 | 3.48% |
| Chicony HD WebCam | 4 | 3.48% |
| Logitech C922 Pro Stream Webcam | 3 | 2.61% |
| IMC Networks HD Camera | 3 | 2.61% |
| Chicony Lenovo EasyCamera | 3 | 2.61% |
| Acer HD Webcam | 3 | 2.61% |
| Realtek Integrated_Webcam_HD | 2 | 1.74% |
| Quanta HP TrueVision HD Camera | 2 | 1.74% |
| Microdia Webcam Vitade AF | 2 | 1.74% |
| Lite-On Integrated Camera | 2 | 1.74% |
| Chicony USB2.0 VGA UVC WebCam | 2 | 1.74% |
| Chicony HP HD Camera | 2 | 1.74% |
| Z-Star Lenovo USB2.0 UVC Camera | 1 | 0.87% |
| YGTek Webcam | 1 | 0.87% |
| Tripath USB Camera | 1 | 0.87% |
| Syntek Lenovo EasyCamera | 1 | 0.87% |
| SunplusIT USB camera | 1 | 0.87% |
| Sunplus Laptop Integrated Webcam HD | 1 | 0.87% |
| Sunplus HP HD Webcam [Fixed] | 1 | 0.87% |
| Sunplus HD WebCam | 1 | 0.87% |
| Sunplus Full HD webcam | 1 | 0.87% |
| Sonix USB2.0 VGAUVC WebCam | 1 | 0.87% |
| Sonix USB Camera | 1 | 0.87% |
| SHENZHEN EMEET TECHNOLOGY HD Webcam eMeet C960 | 1 | 0.87% |
| Samsung Galaxy series, misc. (MTP mode) | 1 | 0.87% |
| Realtek USB Camera | 1 | 0.87% |
| Realtek Integrated Webcam HD | 1 | 0.87% |
| Realtek Integrated Camera | 1 | 0.87% |
| Realtek HP Wide Vision HD Camera | 1 | 0.87% |
| Quanta VGA WebCam | 1 | 0.87% |
| Quanta HP True Vision 5MP Camera | 1 | 0.87% |
| Quanta HP HD Camera | 1 | 0.87% |
| Quanta HD User Facing | 1 | 0.87% |
| Philips (or NXP) Webcam SPC530NC | 1 | 0.87% |
| Owon USB CAMERA | 1 | 0.87% |
| Novatek AF HD 720P Webcam | 1 | 0.87% |
| Microsoft LifeCam HD-5000 | 1 | 0.87% |
Security
Fingerprint Vendor
Fingerprint sensor vendors


| Vendor | Computers | Percent |
|---|---|---|
| Validity Sensors | 8 | 36.36% |
| Shenzhen Goodix Technology | 8 | 36.36% |
| Synaptics | 5 | 22.73% |
| Elan Microelectronics | 1 | 4.55% |
Fingerprint Model
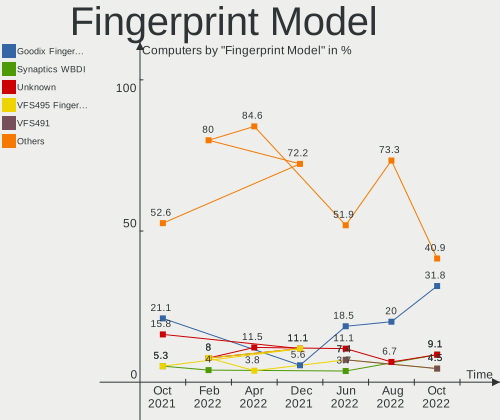
Fingerprint sensor models

| Model | Computers | Percent |
|---|---|---|
| Shenzhen Goodix FingerPrint Device | 7 | 31.82% |
| Validity Sensors Synaptics WBDI | 2 | 9.09% |
| Unknown | 2 | 9.09% |
| Validity Sensors VFS495 Fingerprint Reader | 1 | 4.55% |
| Validity Sensors VFS491 | 1 | 4.55% |
| Validity Sensors VFS451 Fingerprint Reader | 1 | 4.55% |
| Validity Sensors VFS 5011 fingerprint sensor | 1 | 4.55% |
| Validity Sensors Swipe Fingerprint Sensor | 1 | 4.55% |
| Validity Sensors Fingerprint scanner | 1 | 4.55% |
| Synaptics VFS7552 Touch Fingerprint Sensor with PurePrint | 1 | 4.55% |
| Synaptics FS7604 Touch Fingerprint Sensor with PurePrint | 1 | 4.55% |
| Synaptics Prometheus MIS Touch Fingerprint Reader | 1 | 4.55% |
| Shenzhen Goodix FingerPrint | 1 | 4.55% |
| Elan ELAN:ARM-M4 | 1 | 4.55% |
Chipcard Vendor
Chipcard module vendors


| Vendor | Computers | Percent |
|---|---|---|
| Broadcom | 4 | 40% |
| Alcor Micro | 2 | 20% |
| Lenovo | 1 | 10% |
| Gemalto (was Gemplus) | 1 | 10% |
| Clay Logic | 1 | 10% |
| Aladdin Knowledge Systems | 1 | 10% |
Chipcard Model
Chipcard module models


| Model | Computers | Percent |
|---|---|---|
| Broadcom BCM5880 Secure Applications Processor | 3 | 30% |
| Alcor Micro AU9540 Smartcard Reader | 2 | 20% |
| Lenovo Integrated Smart Card Reader | 1 | 10% |
| Gemalto (was Gemplus) GemPC Twin SmartCard Reader | 1 | 10% |
| Clay Logic Nitrokey Pro | 1 | 10% |
| Broadcom 58200 | 1 | 10% |
| Aladdin Knowledge Systems Token JC | 1 | 10% |
Unsupported
Unsupported Devices
Total unsupported devices on board


| Total | Computers | Percent |
|---|---|---|
| 0 | 123 | 70.29% |
| 1 | 43 | 24.57% |
| 2 | 8 | 4.57% |
| 3 | 1 | 0.57% |
Unsupported Device Types
Types of unsupported devices


| Type | Computers | Percent |
|---|---|---|
| Fingerprint reader | 21 | 34.43% |
| Net/wireless | 7 | 11.48% |
| Graphics card | 7 | 11.48% |
| Multimedia controller | 6 | 9.84% |
| Chipcard | 6 | 9.84% |
| Bluetooth | 4 | 6.56% |
| Net/ethernet | 2 | 3.28% |
| Dvb card | 2 | 3.28% |
| Camera | 2 | 3.28% |
| Unassigned class | 1 | 1.64% |
| Storage | 1 | 1.64% |
| Communication controller | 1 | 1.64% |
| Card reader | 1 | 1.64% |