Kali - Hardware Trends
A project to identify most popular hardware characteristics and track their change over time based on data collected by Linux users at https://Linux-Hardware.org.
Anyone can contribute to this report by the hw-probe tool:
sudo -E hw-probe -all -uploadThis is a report for all computer types. See also reports for desktops and notebooks.
This report is for one last month. Overall report since the beginning of time: TestCoverage
Period: Oct, 2022.
Contents
System
OS
Installed operating systems


| Name | Computers | Percent |
|---|---|---|
| Kali 2022.3 | 70 | 97.22% |
| Kali 2022.2 | 1 | 1.39% |
| Kali 2022.1 | 1 | 1.39% |
OS Family
OS without a version


| Name | Computers | Percent |
|---|---|---|
| Kali | 72 | 100% |
Kernel
Version of the Linux kernel


| Version | Computers | Percent |
|---|---|---|
| 5.19.0-kali2-amd64 | 26 | 36.11% |
| 5.18.0-kali7-amd64 | 25 | 34.72% |
| 5.18.0-kali5-amd64 | 14 | 19.44% |
| 6.0.0-rc6 | 1 | 1.39% |
| 5.19.10-surface | 1 | 1.39% |
| 5.19.0-kali2-rt-amd64 | 1 | 1.39% |
| 5.16.0-kali7-amd64 | 1 | 1.39% |
| 5.15.0-kali3-amd64 | 1 | 1.39% |
| 5.14.0-kali4-amd64 | 1 | 1.39% |
| 3.4.113-g3694c3a | 1 | 1.39% |
Kernel Family
Linux kernel without a distro release


| Version | Computers | Percent |
|---|---|---|
| 5.18.0 | 39 | 54.17% |
| 5.19.0 | 27 | 37.5% |
| 6.0.0 | 1 | 1.39% |
| 5.19.10 | 1 | 1.39% |
| 5.16.0 | 1 | 1.39% |
| 5.15.0 | 1 | 1.39% |
| 5.14.0 | 1 | 1.39% |
| 3.4.113 | 1 | 1.39% |
Kernel Major Ver.
Linux kernel major version


| Version | Computers | Percent |
|---|---|---|
| 5.18 | 39 | 54.17% |
| 5.19 | 28 | 38.89% |
| 6.0 | 1 | 1.39% |
| 5.16 | 1 | 1.39% |
| 5.15 | 1 | 1.39% |
| 5.14 | 1 | 1.39% |
| 3.4 | 1 | 1.39% |
Arch
OS architecture (x86_64, i586, etc.)


| Name | Computers | Percent |
|---|---|---|
| x86_64 | 71 | 98.61% |
| armv7l | 1 | 1.39% |
DE
Desktop Environment


| Name | Computers | Percent |
|---|---|---|
| XFCE | 36 | 50% |
| GNOME | 22 | 30.56% |
| KDE5 | 12 | 16.67% |
| MATE | 1 | 1.39% |
| Unknown | 1 | 1.39% |
Display Server
X11 or Wayland


| Name | Computers | Percent |
|---|---|---|
| X11 | 70 | 97.22% |
| Wayland | 1 | 1.39% |
| Tty | 1 | 1.39% |
Display Manager
SDDM, LightDM, etc.


| Name | Computers | Percent |
|---|---|---|
| LightDM | 32 | 44.44% |
| Unknown | 20 | 27.78% |
| GDM3 | 12 | 16.67% |
| SDDM | 6 | 8.33% |
| GDM | 2 | 2.78% |
OS Lang
Language


| Lang | Computers | Percent |
|---|---|---|
| en_US | 40 | 55.56% |
| en_GB | 5 | 6.94% |
| en_IN | 4 | 5.56% |
| en_AU | 3 | 4.17% |
| ru_RU | 2 | 2.78% |
| it_IT | 2 | 2.78% |
| fr_FR | 2 | 2.78% |
| en_CA | 2 | 2.78% |
| de_DE | 2 | 2.78% |
| zh_CN | 1 | 1.39% |
| ru_UA | 1 | 1.39% |
| pt_BR | 1 | 1.39% |
| pl_PL | 1 | 1.39% |
| nl_NL | 1 | 1.39% |
| ka_GE | 1 | 1.39% |
| es_ES | 1 | 1.39% |
| en_DE | 1 | 1.39% |
| en_AG | 1 | 1.39% |
| Unknown | 1 | 1.39% |
Boot Mode
EFI or BIOS


| Mode | Computers | Percent |
|---|---|---|
| EFI | 51 | 70.83% |
| BIOS | 21 | 29.17% |
Filesystem
Type of filesystem


| Type | Computers | Percent |
|---|---|---|
| Ext4 | 67 | 93.06% |
| Btrfs | 3 | 4.17% |
| Overlay | 1 | 1.39% |
| Ext2 | 1 | 1.39% |
Part. scheme
Scheme of partitioning


| Type | Computers | Percent |
|---|---|---|
| GPT | 45 | 62.5% |
| Unknown | 18 | 25% |
| MBR | 9 | 12.5% |
Dual Boot with Linux/BSD
Hosting more than one Linux/BSD


| Dual boot | Computers | Percent |
|---|---|---|
| No | 70 | 97.22% |
| Yes | 2 | 2.78% |
Dual Boot (Win)
Hosting Linux and Windows


| Dual boot | Computers | Percent |
|---|---|---|
| No | 50 | 69.44% |
| Yes | 22 | 30.56% |
Board
Vendor
Motherboard manufacturer


| Name | Computers | Percent |
|---|---|---|
| Hewlett-Packard | 15 | 20.83% |
| Lenovo | 12 | 16.67% |
| ASUSTek Computer | 9 | 12.5% |
| Apple | 8 | 11.11% |
| Dell | 5 | 6.94% |
| Microsoft | 3 | 4.17% |
| Acer | 3 | 4.17% |
| MSI | 2 | 2.78% |
| Intel | 2 | 2.78% |
| HUAWEI | 2 | 2.78% |
| 2 | 2.78% | |
| Positivo | 1 | 1.39% |
| PC Specialist | 1 | 1.39% |
| Monster | 1 | 1.39% |
| MicroByte | 1 | 1.39% |
| Medion | 1 | 1.39% |
| GPU Company | 1 | 1.39% |
| Chuwi | 1 | 1.39% |
| ASRock | 1 | 1.39% |
| Unknown | 1 | 1.39% |
Model
Motherboard model


| Name | Computers | Percent |
|---|---|---|
| Apple MacBookAir7,2 | 3 | 4.17% |
| Unknown | 3 | 4.17% |
| ASUS ASUS TUF Gaming F15 FX506LH_FX506LH | 2 | 2.78% |
| Positivo Q232A | 1 | 1.39% |
| PC Specialist N13xWU | 1 | 1.39% |
| MSI GP76 Leopard 10UE | 1 | 1.39% |
| MSI GP60 2PE | 1 | 1.39% |
| Monster HUMA H4 V4.1 | 1 | 1.39% |
| Microsoft Surface Pro 3 | 1 | 1.39% |
| Microsoft Surface Pro | 1 | 1.39% |
| Microsoft Surface Book 2 | 1 | 1.39% |
| MicroByte ezbook | 1 | 1.39% |
| Lenovo Yoga 3 14 80JH | 1 | 1.39% |
| Lenovo V310-15ISK 80SY | 1 | 1.39% |
| Lenovo ThinkPad T470s 20HGS2W300 | 1 | 1.39% |
| Lenovo ThinkPad T460 20FMS4U300 | 1 | 1.39% |
| Lenovo ThinkPad P1 Gen 5 21DC002PUS | 1 | 1.39% |
| Lenovo ThinkPad L450 20DSS00M01 | 1 | 1.39% |
| Lenovo ThinkPad E580 20KTA001GE | 1 | 1.39% |
| Lenovo Legion 5 15IAH7 82RC | 1 | 1.39% |
| Lenovo IdeaPadFlex 5 14ALC05 82HU | 1 | 1.39% |
| Lenovo IdeaPad U530 Touch 20289 | 1 | 1.39% |
| Lenovo IdeaPad P500 Touch 20253 | 1 | 1.39% |
| Lenovo IdeaPad 330-15AST 81D6 | 1 | 1.39% |
| Intel NUC8i3BEH | 1 | 1.39% |
| Intel B819 | 1 | 1.39% |
| HUAWEI KLVC-WXX9 | 1 | 1.39% |
| HUAWEI BOM-WXX9 | 1 | 1.39% |
| HP Z210 Workstation | 1 | 1.39% |
| HP ProLiant DL360 G7 | 1 | 1.39% |
| HP Pavilion x360 Convertible 14m-ba0xx | 1 | 1.39% |
| HP Pavilion Gaming Laptop 15-dk0xxx | 1 | 1.39% |
| HP Pavilion dv6 | 1 | 1.39% |
| HP Laptop 15s-du3xxx | 1 | 1.39% |
| HP Laptop 15-da0xxx | 1 | 1.39% |
| HP Laptop 15-bs0xx | 1 | 1.39% |
| HP ENVY x360 Convertible 15-cn1xxx | 1 | 1.39% |
| HP ENVY x360 Convertible 13-bd0xxx | 1 | 1.39% |
| HP ENVY x360 2-in-1 Laptop 15-ey0xxx | 1 | 1.39% |
| HP EliteBook 850 G7 Notebook PC | 1 | 1.39% |
Model Family
Motherboard model prefix


| Name | Computers | Percent |
|---|---|---|
| Lenovo ThinkPad | 5 | 6.94% |
| Microsoft Surface | 3 | 4.17% |
| Lenovo IdeaPad | 3 | 4.17% |
| HP Pavilion | 3 | 4.17% |
| HP Laptop | 3 | 4.17% |
| HP ENVY | 3 | 4.17% |
| ASUS ASUS | 3 | 4.17% |
| Apple MacBookAir7 | 3 | 4.17% |
| Unknown | 3 | 4.17% |
| HP EliteBook | 2 | 2.78% |
| Dell Inspiron | 2 | 2.78% |
| Apple iMac12 | 2 | 2.78% |
| Positivo Q232A | 1 | 1.39% |
| PC Specialist N13xWU | 1 | 1.39% |
| MSI GP76 | 1 | 1.39% |
| MSI GP60 | 1 | 1.39% |
| Monster HUMA | 1 | 1.39% |
| MicroByte ezbook | 1 | 1.39% |
| Lenovo Yoga | 1 | 1.39% |
| Lenovo V310-15ISK | 1 | 1.39% |
| Lenovo Legion | 1 | 1.39% |
| Lenovo IdeaPadFlex | 1 | 1.39% |
| Intel NUC8i3BEH | 1 | 1.39% |
| Intel B819 | 1 | 1.39% |
| HUAWEI KLVC-WXX9 | 1 | 1.39% |
| HUAWEI BOM-WXX9 | 1 | 1.39% |
| HP Z210 | 1 | 1.39% |
| HP ProLiant | 1 | 1.39% |
| HP DR56-ICA22225GL0 | 1 | 1.39% |
| HP 255 | 1 | 1.39% |
| GPU Company GWTC116-2 | 1 | 1.39% |
| Google Droid | 1 | 1.39% |
| Google Delbin | 1 | 1.39% |
| Dell Precision | 1 | 1.39% |
| Dell Latitude | 1 | 1.39% |
| Dell G5 | 1 | 1.39% |
| Chuwi HeroBook | 1 | 1.39% |
| ASUS VivoBook | 1 | 1.39% |
| ASUS Strix | 1 | 1.39% |
| ASUS StrikerExtreme | 1 | 1.39% |
MFG Year
Motherboard manufacture year


| Year | Computers | Percent |
|---|---|---|
| 2021 | 13 | 18.06% |
| 2018 | 8 | 11.11% |
| 2015 | 7 | 9.72% |
| 2022 | 6 | 8.33% |
| 2019 | 5 | 6.94% |
| 2017 | 5 | 6.94% |
| 2016 | 5 | 6.94% |
| 2014 | 5 | 6.94% |
| 2011 | 5 | 6.94% |
| 2013 | 4 | 5.56% |
| 2020 | 3 | 4.17% |
| 2010 | 3 | 4.17% |
| 2012 | 1 | 1.39% |
| 2008 | 1 | 1.39% |
| Unknown | 1 | 1.39% |
Form Factor
Physical design of the computer


| Name | Computers | Percent |
|---|---|---|
| Notebook | 50 | 69.44% |
| Desktop | 8 | 11.11% |
| Convertible | 6 | 8.33% |
| Tablet | 3 | 4.17% |
| All in one | 3 | 4.17% |
| Mini pc | 1 | 1.39% |
| Server | 1 | 1.39% |
Secure Boot
Enabled or disabled


| State | Computers | Percent |
|---|---|---|
| Disabled | 72 | 100% |
Coreboot
Have coreboot on board


| Used | Computers | Percent |
|---|---|---|
| No | 70 | 97.22% |
| Yes | 2 | 2.78% |
RAM Size
Total RAM memory


| Size in GB | Computers | Percent |
|---|---|---|
| 4.01-8.0 | 21 | 29.17% |
| 16.01-24.0 | 18 | 25% |
| 8.01-16.0 | 15 | 20.83% |
| 3.01-4.0 | 11 | 15.28% |
| 32.01-64.0 | 4 | 5.56% |
| 1.01-2.0 | 3 | 4.17% |
RAM Used
Used RAM memory


| Used GB | Computers | Percent |
|---|---|---|
| 2.01-3.0 | 24 | 33.33% |
| 1.01-2.0 | 20 | 27.78% |
| 4.01-8.0 | 14 | 19.44% |
| 3.01-4.0 | 11 | 15.28% |
| 8.01-16.0 | 1 | 1.39% |
| 0.51-1.0 | 1 | 1.39% |
| Unknown | 1 | 1.39% |
Total Drives
Number of drives on board


| Drives | Computers | Percent |
|---|---|---|
| 1 | 51 | 70.83% |
| 2 | 17 | 23.61% |
| 3 | 2 | 2.78% |
| 11 | 1 | 1.39% |
| 4 | 1 | 1.39% |
Has CD-ROM
Has CD-ROM on board


| Presented | Computers | Percent |
|---|---|---|
| No | 58 | 80.56% |
| Yes | 14 | 19.44% |
Has Ethernet
Has Ethernet on board


| Presented | Computers | Percent |
|---|---|---|
| Yes | 50 | 69.44% |
| No | 22 | 30.56% |
Has WiFi
Has WiFi module


| Presented | Computers | Percent |
|---|---|---|
| Yes | 66 | 91.67% |
| No | 6 | 8.33% |
Has Bluetooth
Has Bluetooth module


| Presented | Computers | Percent |
|---|---|---|
| Yes | 56 | 77.78% |
| No | 16 | 22.22% |
Location
Country
Geographic location (country)


| Country | Computers | Percent |
|---|---|---|
| USA | 21 | 29.17% |
| India | 5 | 6.94% |
| Germany | 5 | 6.94% |
| Russia | 4 | 5.56% |
| Canada | 4 | 5.56% |
| Italy | 3 | 4.17% |
| Australia | 3 | 4.17% |
| UK | 2 | 2.78% |
| Switzerland | 2 | 2.78% |
| Spain | 2 | 2.78% |
| Pakistan | 2 | 2.78% |
| Netherlands | 2 | 2.78% |
| Japan | 2 | 2.78% |
| France | 2 | 2.78% |
| Egypt | 2 | 2.78% |
| Ukraine | 1 | 1.39% |
| Turkey | 1 | 1.39% |
| Mexico | 1 | 1.39% |
| Indonesia | 1 | 1.39% |
| Guernsey | 1 | 1.39% |
| Ghana | 1 | 1.39% |
| Georgia | 1 | 1.39% |
| China | 1 | 1.39% |
| Brazil | 1 | 1.39% |
| Argentina | 1 | 1.39% |
| Anguilla | 1 | 1.39% |
City
Geographic location (city)


| City | Computers | Percent |
|---|---|---|
| Montreal | 2 | 2.78% |
| Milan | 2 | 2.78% |
| Littleton | 2 | 2.78% |
| Karachi | 2 | 2.78% |
| Zurich | 1 | 1.39% |
| Yogyakarta | 1 | 1.39% |
| Vonore | 1 | 1.39% |
| Vladivostok | 1 | 1.39% |
| Vincent | 1 | 1.39% |
| Toronto | 1 | 1.39% |
| The Valley | 1 | 1.39% |
| Sydney | 1 | 1.39% |
| Stiens | 1 | 1.39% |
| St Peter Port | 1 | 1.39% |
| San Clemente | 1 | 1.39% |
| Samsun | 1 | 1.39% |
| Rueti | 1 | 1.39% |
| Rostov-on-Don | 1 | 1.39% |
| Rome | 1 | 1.39% |
| Reno | 1 | 1.39% |
| Rainsville | 1 | 1.39% |
| Portland | 1 | 1.39% |
| Pittsburg | 1 | 1.39% |
| Phoenix | 1 | 1.39% |
| Pensacola | 1 | 1.39% |
| Paris | 1 | 1.39% |
| North Tonawanda | 1 | 1.39% |
| Newark | 1 | 1.39% |
| Nasu-yumoto | 1 | 1.39% |
| Nashville | 1 | 1.39% |
| Munich | 1 | 1.39% |
| Moscow | 1 | 1.39% |
| Modesto | 1 | 1.39% |
| Minneapolis | 1 | 1.39% |
| Manchester | 1 | 1.39% |
| Madrid | 1 | 1.39% |
| Ludwigshafen am Rhein | 1 | 1.39% |
| Los Angeles | 1 | 1.39% |
| London | 1 | 1.39% |
| La Prairie | 1 | 1.39% |
Drives
Drive Vendor
Hard drive vendors


| Vendor | Computers | Drives | Percent |
|---|---|---|---|
| Samsung Electronics | 16 | 17 | 17.2% |
| Seagate | 12 | 19 | 12.9% |
| WDC | 8 | 8 | 8.6% |
| Kingston | 8 | 8 | 8.6% |
| SK hynix | 6 | 6 | 6.45% |
| Apple | 6 | 6 | 6.45% |
| Unknown | 4 | 4 | 4.3% |
| Toshiba | 4 | 4 | 4.3% |
| SanDisk | 3 | 3 | 3.23% |
| Micron Technology | 3 | 3 | 3.23% |
| KIOXIA | 3 | 3 | 3.23% |
| China | 3 | 3 | 3.23% |
| A-DATA Technology | 3 | 3 | 3.23% |
| Intel | 2 | 3 | 2.15% |
| Crucial | 2 | 2 | 2.15% |
| Transcend | 1 | 1 | 1.08% |
| Team | 1 | 1 | 1.08% |
| PNY | 1 | 1 | 1.08% |
| NETAPP | 1 | 2 | 1.08% |
| Netac | 1 | 1 | 1.08% |
| Micron/Crucial Technology | 1 | 1 | 1.08% |
| LITEON | 1 | 1 | 1.08% |
| KingSpec | 1 | 1 | 1.08% |
| Intenso | 1 | 1 | 1.08% |
| 1TB | 1 | 1 | 1.08% |
Drive Model
Hard drive models


| Model | Computers | Percent |
|---|---|---|
| Seagate ST1000LM035-1RK172 1TB | 3 | 3.09% |
| Seagate ST3500418AS 500GB | 2 | 2.06% |
| Micron 2210_MTFDHBA512QFD 512GB | 2 | 2.06% |
| China SSD 256GB | 2 | 2.06% |
| Apple HDD HTS545050A7E362 500GB | 2 | 2.06% |
| WDC WDBNCE2500PNC 250GB SSD | 1 | 1.03% |
| WDC WD7500BPVX-22JC3T0 752GB | 1 | 1.03% |
| WDC WD10SPZX-60Z10T1 1TB | 1 | 1.03% |
| WDC WD10SPZX-21Z10T0 1TB | 1 | 1.03% |
| WDC WD10JPVX-60JC3T1 1TB | 1 | 1.03% |
| WDC WD10EZEX-08WN4A0 1TB | 1 | 1.03% |
| WDC WD10EADS-00L5B1 1TB | 1 | 1.03% |
| WDC PC SN530 SDBPNPZ-256G-1006 256GB | 1 | 1.03% |
| Unknown MMC Card 8GB | 1 | 1.03% |
| Unknown MMC Card 32GB | 1 | 1.03% |
| Unknown DA4064 64GB | 1 | 1.03% |
| Unknown Biwin 64GB | 1 | 1.03% |
| Transcend TS256GMTE110S 256GB | 1 | 1.03% |
| Toshiba THNSNJ128GMCU 128GB SSD | 1 | 1.03% |
| Toshiba KXG5AZNV256G 256GB | 1 | 1.03% |
| Toshiba HDWD110 1TB | 1 | 1.03% |
| Toshiba DT01ACA100 1TB | 1 | 1.03% |
| Team T253X1480G 480GB SSD | 1 | 1.03% |
| SK hynix SKHynix_HFS001TDE9X081N 1TB | 1 | 1.03% |
| SK hynix PC401 NVMe Solid State Drive 256GB | 1 | 1.03% |
| SK hynix HFS250G32TND-3110A 250GB SSD | 1 | 1.03% |
| SK hynix HFM128GDJTNG-8310A 128GB | 1 | 1.03% |
| SK hynix HCG8e 64GB | 1 | 1.03% |
| SK hynix BC511 256GB | 1 | 1.03% |
| Seagate ST9300653SS 304GB | 1 | 1.03% |
| Seagate ST930065 CLAR300 304GB | 1 | 1.03% |
| Seagate ST500LT012-1DG142 500GB | 1 | 1.03% |
| Seagate ST2000LM 015-2E8174 2TB | 1 | 1.03% |
| Seagate ST2000DM001-1ER164 2TB | 1 | 1.03% |
| Seagate ST1000LM024 HN-M101MBB 1TB | 1 | 1.03% |
| Seagate M3 2TB | 1 | 1.03% |
| Seagate Expansion 2TB | 1 | 1.03% |
| Seagate BUP Slim BK 1TB | 1 | 1.03% |
| Seagate BACKUP+ 500GB | 1 | 1.03% |
| Sandisk WD Black SN750 / PC SN730 NVMe SSD 1TB | 1 | 1.03% |
HDD Vendor
Hard disk drive vendors


| Vendor | Computers | Drives | Percent |
|---|---|---|---|
| Seagate | 10 | 17 | 45.45% |
| WDC | 6 | 6 | 27.27% |
| Toshiba | 2 | 2 | 9.09% |
| Apple | 2 | 2 | 9.09% |
| Samsung Electronics | 1 | 1 | 4.55% |
| NETAPP | 1 | 2 | 4.55% |
SSD Vendor
Solid state drive vendors


| Vendor | Computers | Drives | Percent |
|---|---|---|---|
| Samsung Electronics | 8 | 8 | 24.24% |
| Apple | 4 | 4 | 12.12% |
| Kingston | 3 | 3 | 9.09% |
| China | 3 | 3 | 9.09% |
| A-DATA Technology | 3 | 3 | 9.09% |
| WDC | 1 | 1 | 3.03% |
| Toshiba | 1 | 1 | 3.03% |
| Team | 1 | 1 | 3.03% |
| SK hynix | 1 | 1 | 3.03% |
| SanDisk | 1 | 1 | 3.03% |
| PNY | 1 | 1 | 3.03% |
| Netac | 1 | 1 | 3.03% |
| LITEON | 1 | 1 | 3.03% |
| KingSpec | 1 | 1 | 3.03% |
| Intenso | 1 | 1 | 3.03% |
| Crucial | 1 | 1 | 3.03% |
| 1TB | 1 | 1 | 3.03% |
Drive Kind
HDD or SSD


| Kind | Computers | Drives | Percent |
|---|---|---|---|
| SSD | 31 | 33 | 35.63% |
| NVMe | 28 | 32 | 32.18% |
| HDD | 20 | 30 | 22.99% |
| MMC | 6 | 6 | 6.9% |
| Unknown | 2 | 2 | 2.3% |
Drive Connector
SATA, SAS, NVMe, etc.

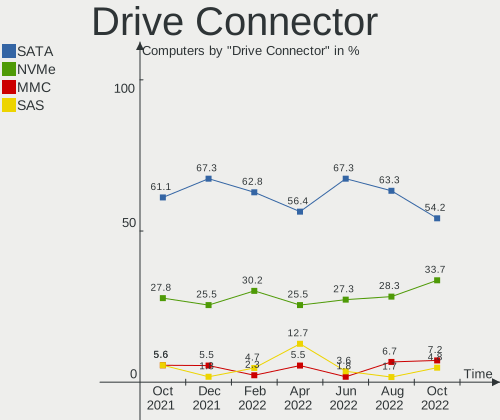
| Type | Computers | Drives | Percent |
|---|---|---|---|
| SATA | 45 | 60 | 54.22% |
| NVMe | 28 | 32 | 33.73% |
| MMC | 6 | 6 | 7.23% |
| SAS | 4 | 5 | 4.82% |
Drive Size
Size of hard drive


| Size in TB | Computers | Drives | Percent |
|---|---|---|---|
| 0.01-0.5 | 35 | 40 | 66.04% |
| 0.51-1.0 | 16 | 20 | 30.19% |
| 1.01-2.0 | 2 | 3 | 3.77% |
Space Total
Amount of disk space available on the file system


| Size in GB | Computers | Percent |
|---|---|---|
| 101-250 | 30 | 41.67% |
| 251-500 | 17 | 23.61% |
| 501-1000 | 9 | 12.5% |
| 51-100 | 6 | 8.33% |
| 21-50 | 3 | 4.17% |
| 1001-2000 | 3 | 4.17% |
| 2001-3000 | 2 | 2.78% |
| 1-20 | 1 | 1.39% |
| Unknown | 1 | 1.39% |
Space Used
Amount of used disk space


| Used GB | Computers | Percent |
|---|---|---|
| 21-50 | 22 | 30.56% |
| 1-20 | 19 | 26.39% |
| 101-250 | 14 | 19.44% |
| 51-100 | 10 | 13.89% |
| 251-500 | 3 | 4.17% |
| 1001-2000 | 2 | 2.78% |
| 501-1000 | 1 | 1.39% |
| Unknown | 1 | 1.39% |
Malfunc. Drives
Drive models with a malfunction


| Model | Computers | Drives | Percent |
|---|---|---|---|
| WDC WD10JPVX-60JC3T1 1TB | 1 | 1 | 20% |
| SK hynix HFS250G32TND-3110A 250GB SSD | 1 | 1 | 20% |
| Seagate ST2000LM 015-2E8174 2TB | 1 | 1 | 20% |
| Seagate ST1000LM035-1RK172 1TB | 1 | 1 | 20% |
| Samsung Electronics SSD 840 EVO 120GB | 1 | 1 | 20% |
Malfunc. Drive Vendor
Vendors of faulty drives


| Vendor | Computers | Drives | Percent |
|---|---|---|---|
| Seagate | 2 | 2 | 40% |
| WDC | 1 | 1 | 20% |
| SK hynix | 1 | 1 | 20% |
| Samsung Electronics | 1 | 1 | 20% |
Malfunc. HDD Vendor
Vendors of faulty HDD drives


| Vendor | Computers | Drives | Percent |
|---|---|---|---|
| Seagate | 2 | 2 | 66.67% |
| WDC | 1 | 1 | 33.33% |
Malfunc. Drive Kind
Kinds of faulty drives


| Kind | Computers | Drives | Percent |
|---|---|---|---|
| HDD | 3 | 3 | 60% |
| SSD | 2 | 2 | 40% |
Failed Drives
Failed drive models
Zero info for selected period =(
Failed Drive Vendor
Failed drive vendors
Zero info for selected period =(
Drive Status
Number of failed and malfunc. drives


| Status | Computers | Drives | Percent |
|---|---|---|---|
| Works | 42 | 59 | 53.16% |
| Detected | 32 | 39 | 40.51% |
| Malfunc | 5 | 5 | 6.33% |
Storage controller
Storage Vendor
Storage controller vendors


| Vendor | Computers | Percent |
|---|---|---|
| Intel | 46 | 54.12% |
| Samsung Electronics | 10 | 11.76% |
| Kingston Technology Company | 5 | 5.88% |
| AMD | 5 | 5.88% |
| SK hynix | 4 | 4.71% |
| Micron Technology | 3 | 3.53% |
| Toshiba America Info Systems | 2 | 2.35% |
| SanDisk | 2 | 2.35% |
| Micron/Crucial Technology | 2 | 2.35% |
| KIOXIA | 2 | 2.35% |
| Transcend | 1 | 1.18% |
| Silicon Image | 1 | 1.18% |
| Nvidia | 1 | 1.18% |
| Hewlett-Packard | 1 | 1.18% |
Storage Model
Storage controller models


| Model | Computers | Percent |
|---|---|---|
| Intel 82801 Mobile SATA Controller [RAID mode] | 6 | 6.59% |
| Intel Sunrise Point-LP SATA Controller [AHCI mode] | 5 | 5.49% |
| Intel 8 Series SATA Controller 1 [AHCI mode] | 4 | 4.4% |
| Intel 7 Series Chipset Family 6-port SATA Controller [AHCI mode] | 4 | 4.4% |
| AMD FCH SATA Controller [AHCI mode] | 4 | 4.4% |
| Samsung NVMe SSD Controller SM981/PM981/PM983 | 3 | 3.3% |
| Samsung Electronics SATA controller | 3 | 3.3% |
| Micron Non-Volatile memory controller | 3 | 3.3% |
| Kingston Company Company Non-Volatile memory controller | 3 | 3.3% |
| Intel Volume Management Device NVMe RAID Controller | 3 | 3.3% |
| Intel Celeron/Pentium Silver Processor SATA Controller | 3 | 3.3% |
| Samsung Electronics Non-Volatile memory controller | 2 | 2.2% |
| KIOXIA NVMe SSD Controller BG4 | 2 | 2.2% |
| Intel Wildcat Point-LP SATA Controller [AHCI Mode] | 2 | 2.2% |
| Intel SATA Controller [RAID mode] | 2 | 2.2% |
| Intel 8 Series/C220 Series Chipset Family 6-port SATA Controller 1 [AHCI mode] | 2 | 2.2% |
| Intel 6 Series/C200 Series Chipset Family 6 port Desktop SATA AHCI Controller | 2 | 2.2% |
| Intel 400 Series Chipset Family SATA AHCI Controller | 2 | 2.2% |
| Transcend Non-Volatile memory controller | 1 | 1.1% |
| Toshiba America Info Systems Toshiba America Info Non-Volatile memory controller | 1 | 1.1% |
| Toshiba America Info Systems BG3 NVMe SSD Controller | 1 | 1.1% |
| SK hynix PC401 NVMe Solid State Drive 256GB | 1 | 1.1% |
| SK hynix Gold P31 SSD | 1 | 1.1% |
| SK hynix BC511 | 1 | 1.1% |
| SK hynix BC501 NVMe Solid State Drive | 1 | 1.1% |
| Silicon Image SiI 3132 Serial ATA Raid II Controller | 1 | 1.1% |
| SanDisk WD Blue SN550 NVMe SSD | 1 | 1.1% |
| SanDisk WD Black SN750 / PC SN730 NVMe SSD | 1 | 1.1% |
| Samsung NVMe SSD Controller SM961/PM961/SM963 | 1 | 1.1% |
| Samsung NVMe SSD Controller 980 | 1 | 1.1% |
| Nvidia MCP55 SATA Controller | 1 | 1.1% |
| Nvidia MCP55 IDE | 1 | 1.1% |
| Micron/Crucial P2 NVMe PCIe SSD | 1 | 1.1% |
| Micron/Crucial Non-Volatile memory controller | 1 | 1.1% |
| Kingston Company OM3PDP3 NVMe SSD | 1 | 1.1% |
| Kingston Company A2000 NVMe SSD | 1 | 1.1% |
| Intel Tiger Lake-LP SATA Controller | 1 | 1.1% |
| Intel SSD 600P Series | 1 | 1.1% |
| Intel Q170/Q150/B150/H170/H110/Z170/CM236 Chipset SATA Controller [AHCI Mode] | 1 | 1.1% |
| Intel Non-Volatile memory controller | 1 | 1.1% |
Storage Kind
Kind of storage controller (IDE, SATA, NVMe, SAS, ...)


| Kind | Computers | Percent |
|---|---|---|
| SATA | 44 | 50% |
| NVMe | 28 | 31.82% |
| RAID | 13 | 14.77% |
| IDE | 3 | 3.41% |
Processor
CPU Vendor
Processor vendors


| Vendor | Computers | Percent |
|---|---|---|
| Intel | 63 | 87.5% |
| AMD | 8 | 11.11% |
| Qualcomm | 1 | 1.39% |
CPU Model
Processor models


| Model | Computers | Percent |
|---|---|---|
| Intel Core i5-8250U CPU @ 1.60GHz | 3 | 4.17% |
| Intel Core i5-7300U CPU @ 2.60GHz | 3 | 4.17% |
| Intel Celeron N4020 CPU @ 1.10GHz | 3 | 4.17% |
| Intel Core i7-5650U CPU @ 2.20GHz | 2 | 2.78% |
| Intel Core i5-3210M CPU @ 2.50GHz | 2 | 2.78% |
| Intel Core i5-10300H CPU @ 2.50GHz | 2 | 2.78% |
| Intel Core i3-6006U CPU @ 2.00GHz | 2 | 2.78% |
| Intel 11th Gen Core i7-1165G7 @ 2.80GHz | 2 | 2.78% |
| Qualcomm ARMv7 Processor rev 0 (v7l) | 1 | 1.39% |
| Intel Xeon CPU L5640 @ 2.27GHz | 1 | 1.39% |
| Intel Pentium Silver N5000 CPU @ 1.10GHz | 1 | 1.39% |
| Intel Core i7-9750H CPU @ 2.60GHz | 1 | 1.39% |
| Intel Core i7-8750H CPU @ 2.20GHz | 1 | 1.39% |
| Intel Core i7-7700HQ CPU @ 2.80GHz | 1 | 1.39% |
| Intel Core i7-6600U CPU @ 2.60GHz | 1 | 1.39% |
| Intel Core i7-5500U CPU @ 2.40GHz | 1 | 1.39% |
| Intel Core i7-4500U CPU @ 1.80GHz | 1 | 1.39% |
| Intel Core i7-2670QM CPU @ 2.20GHz | 1 | 1.39% |
| Intel Core i7-2600S CPU @ 2.80GHz | 1 | 1.39% |
| Intel Core i7-2600 CPU @ 3.40GHz | 1 | 1.39% |
| Intel Core i7-10870H CPU @ 2.20GHz | 1 | 1.39% |
| Intel Core i7-10510U CPU @ 1.80GHz | 1 | 1.39% |
| Intel Core i5-9300H CPU @ 2.40GHz | 1 | 1.39% |
| Intel Core i5-8265U CPU @ 1.60GHz | 1 | 1.39% |
| Intel Core i5-7200U CPU @ 2.50GHz | 1 | 1.39% |
| Intel Core i5-6300U CPU @ 2.40GHz | 1 | 1.39% |
| Intel Core i5-6300HQ CPU @ 2.30GHz | 1 | 1.39% |
| Intel Core i5-5350U CPU @ 1.80GHz | 1 | 1.39% |
| Intel Core i5-5300U CPU @ 2.30GHz | 1 | 1.39% |
| Intel Core i5-4460 CPU @ 3.20GHz | 1 | 1.39% |
| Intel Core i5-4440 CPU @ 3.10GHz | 1 | 1.39% |
| Intel Core i5-4300U CPU @ 1.90GHz | 1 | 1.39% |
| Intel Core i5-4260U CPU @ 1.40GHz | 1 | 1.39% |
| Intel Core i5-4210U CPU @ 1.70GHz | 1 | 1.39% |
| Intel Core i5-4210H CPU @ 2.90GHz | 1 | 1.39% |
| Intel Core i5-3427U CPU @ 1.80GHz | 1 | 1.39% |
| Intel Core i5-3230M CPU @ 2.60GHz | 1 | 1.39% |
| Intel Core i5-2500K CPU @ 3.30GHz | 1 | 1.39% |
| Intel Core i5-2400 CPU @ 3.10GHz | 1 | 1.39% |
| Intel Core i5-10310U CPU @ 1.70GHz | 1 | 1.39% |
CPU Model Family
Processor model prefix


| Model | Computers | Percent |
|---|---|---|
| Intel Core i5 | 28 | 38.89% |
| Intel Core i7 | 13 | 18.06% |
| Other | 8 | 11.11% |
| Intel Celeron | 6 | 8.33% |
| Intel Core i3 | 5 | 6.94% |
| AMD Ryzen 7 | 3 | 4.17% |
| Intel Xeon | 1 | 1.39% |
| Intel Pentium Silver | 1 | 1.39% |
| Intel Core 2 Quad | 1 | 1.39% |
| Intel Atom | 1 | 1.39% |
| AMD Ryzen 5 | 1 | 1.39% |
| AMD FX | 1 | 1.39% |
| AMD E2 | 1 | 1.39% |
| AMD Athlon | 1 | 1.39% |
| AMD A8 | 1 | 1.39% |
CPU Cores
Number of processor cores


| Number | Computers | Percent |
|---|---|---|
| 2 | 33 | 45.83% |
| 4 | 26 | 36.11% |
| 8 | 4 | 5.56% |
| 12 | 3 | 4.17% |
| 6 | 3 | 4.17% |
| 14 | 1 | 1.39% |
| 3 | 1 | 1.39% |
| 1 | 1 | 1.39% |
CPU Sockets
Number of sockets


| Number | Computers | Percent |
|---|---|---|
| 1 | 71 | 98.61% |
| 2 | 1 | 1.39% |
CPU Threads
Threads per core (Hyper-Threading)


| Number | Computers | Percent |
|---|---|---|
| 2 | 54 | 75% |
| 1 | 18 | 25% |
CPU Op-Modes
CPU Operation Modes (32-bit, 64-bit)


| Op mode | Computers | Percent |
|---|---|---|
| 32-bit, 64-bit | 71 | 98.61% |
| Unknown | 1 | 1.39% |
CPU Microcode
Microcode number


| Number | Computers | Percent |
|---|---|---|
| 0x306d4 | 5 | 6.94% |
| 0x206a7 | 5 | 6.94% |
| Unknown | 5 | 6.94% |
| 0x806e9 | 4 | 5.56% |
| 0x806c1 | 4 | 5.56% |
| 0x406e3 | 4 | 5.56% |
| 0x306a9 | 4 | 5.56% |
| 0xa0652 | 3 | 4.17% |
| 0x906ea | 3 | 4.17% |
| 0x906a3 | 3 | 4.17% |
| 0x806ec | 3 | 4.17% |
| 0x806ea | 3 | 4.17% |
| 0x706a8 | 3 | 4.17% |
| 0x40651 | 3 | 4.17% |
| 0x306c3 | 2 | 2.78% |
| 0x08608103 | 2 | 2.78% |
| 0xa0653 | 1 | 1.39% |
| 0x906e9 | 1 | 1.39% |
| 0x806eb | 1 | 1.39% |
| 0x706a1 | 1 | 1.39% |
| 0x6fb | 1 | 1.39% |
| 0x506e3 | 1 | 1.39% |
| 0x506c9 | 1 | 1.39% |
| 0x406c4 | 1 | 1.39% |
| 0x30678 | 1 | 1.39% |
| 0x206c2 | 1 | 1.39% |
| 0x1067a | 1 | 1.39% |
| 0x0a50000d | 1 | 1.39% |
| 0x08108109 | 1 | 1.39% |
| 0x06006704 | 1 | 1.39% |
| 0x06003106 | 1 | 1.39% |
| 0x0600063e | 1 | 1.39% |
CPU Microarch
Microarchitecture


| Name | Computers | Percent |
|---|---|---|
| KabyLake | 16 | 22.22% |
| Haswell | 7 | 9.72% |
| Skylake | 5 | 6.94% |
| SandyBridge | 5 | 6.94% |
| Broadwell | 5 | 6.94% |
| TigerLake | 4 | 5.56% |
| IvyBridge | 4 | 5.56% |
| Goldmont plus | 4 | 5.56% |
| CometLake | 4 | 5.56% |
| Alderlake Hybrid | 3 | 4.17% |
| Unknown | 3 | 4.17% |
| Silvermont | 2 | 2.78% |
| Zen+ | 1 | 1.39% |
| Zen 3 | 1 | 1.39% |
| Zen 2 | 1 | 1.39% |
| Westmere | 1 | 1.39% |
| Steamroller | 1 | 1.39% |
| Penryn | 1 | 1.39% |
| Goldmont | 1 | 1.39% |
| Excavator | 1 | 1.39% |
| Core | 1 | 1.39% |
| Bulldozer | 1 | 1.39% |
Graphics
GPU Vendor
Vendors of graphics cards


| Vendor | Computers | Percent |
|---|---|---|
| Intel | 58 | 62.37% |
| Nvidia | 18 | 19.35% |
| AMD | 17 | 18.28% |
GPU Model
Graphics card models


| Model | Computers | Percent |
|---|---|---|
| Intel HD Graphics 620 | 4 | 4.3% |
| Intel Haswell-ULT Integrated Graphics Controller | 4 | 4.3% |
| Intel 3rd Gen Core processor Graphics Controller | 4 | 4.3% |
| Intel UHD Graphics 620 | 3 | 3.23% |
| Intel TigerLake-LP GT2 [Iris Xe Graphics] | 3 | 3.23% |
| Intel Skylake GT2 [HD Graphics 520] | 3 | 3.23% |
| Intel HD Graphics 6000 | 3 | 3.23% |
| Intel GeminiLake [UHD Graphics 600] | 3 | 3.23% |
| Intel CometLake-H GT2 [UHD Graphics] | 3 | 3.23% |
| Intel CoffeeLake-H GT2 [UHD Graphics 630] | 3 | 3.23% |
| Intel Alder Lake-P Integrated Graphics Controller | 3 | 3.23% |
| Intel 2nd Generation Core Processor Family Integrated Graphics Controller | 3 | 3.23% |
| Nvidia TU117M | 2 | 2.15% |
| Nvidia TU116M [GeForce GTX 1660 Ti Mobile] | 2 | 2.15% |
| Nvidia GP107M [GeForce GTX 1050 Ti Mobile] | 2 | 2.15% |
| Intel WhiskeyLake-U GT2 [UHD Graphics 620] | 2 | 2.15% |
| Intel HD Graphics 5500 | 2 | 2.15% |
| Intel CometLake-U GT2 [UHD Graphics] | 2 | 2.15% |
| AMD Lucienne | 2 | 2.15% |
| Nvidia TU117M [GeForce GTX 1650 Mobile / Max-Q] | 1 | 1.08% |
| Nvidia GP108 [GeForce GT 1030] | 1 | 1.08% |
| Nvidia GP107M [GeForce MX350] | 1 | 1.08% |
| Nvidia GM108M [GeForce MX110] | 1 | 1.08% |
| Nvidia GM108M [GeForce 840M] | 1 | 1.08% |
| Nvidia GK208M [GeForce GT 730M] | 1 | 1.08% |
| Nvidia GK208B [GeForce GT 710] | 1 | 1.08% |
| Nvidia GF108 [GeForce GT 630] | 1 | 1.08% |
| Nvidia GA107GLM [RTX A2000 8GB Laptop GPU] | 1 | 1.08% |
| Nvidia GA107BM [GeForce RTX 3050 Ti Mobile] | 1 | 1.08% |
| Nvidia GA106M [GeForce RTX 3060 Mobile / Max-Q] | 1 | 1.08% |
| Nvidia G80 [GeForce 8800 GTX] | 1 | 1.08% |
| Intel Xeon E3-1200 v3/4th Gen Core Processor Integrated Graphics Controller | 1 | 1.08% |
| Intel Tiger Lake UHD Graphics | 1 | 1.08% |
| Intel Mobile 4 Series Chipset Integrated Graphics Controller | 1 | 1.08% |
| Intel HD Graphics 630 | 1 | 1.08% |
| Intel HD Graphics 530 | 1 | 1.08% |
| Intel HD Graphics 520 | 1 | 1.08% |
| Intel HD Graphics 500 | 1 | 1.08% |
| Intel GeminiLake [UHD Graphics 605] | 1 | 1.08% |
| Intel CometLake-S GT2 [UHD Graphics 630] | 1 | 1.08% |
GPU Combo
Combinations of graphics cards


| Name | Computers | Percent |
|---|---|---|
| 1 x Intel | 37 | 51.39% |
| Intel + Nvidia | 13 | 18.06% |
| 1 x AMD | 10 | 13.89% |
| Intel + AMD | 5 | 6.94% |
| 1 x Nvidia | 3 | 4.17% |
| AMD + Nvidia | 2 | 2.78% |
| Other | 1 | 1.39% |
| 2 x Intel | 1 | 1.39% |
GPU Driver
Free vs proprietary


| Driver | Computers | Percent |
|---|---|---|
| Free | 67 | 93.06% |
| Proprietary | 3 | 4.17% |
| Unknown | 2 | 2.78% |
GPU Memory
Total video memory


| Size in GB | Computers | Percent |
|---|---|---|
| Unknown | 46 | 63.89% |
| 1.01-2.0 | 11 | 15.28% |
| 3.01-4.0 | 7 | 9.72% |
| 0.01-0.5 | 5 | 6.94% |
| 0.51-1.0 | 2 | 2.78% |
| 7.01-8.0 | 1 | 1.39% |
Monitor
Monitor Vendor
Monitor vendors


| Vendor | Computers | Percent |
|---|---|---|
| BOE | 12 | 15.38% |
| LG Display | 11 | 14.1% |
| Chimei Innolux | 11 | 14.1% |
| Apple | 8 | 10.26% |
| Samsung Electronics | 6 | 7.69% |
| AU Optronics | 6 | 7.69% |
| PANDA | 5 | 6.41% |
| Panasonic | 2 | 2.56% |
| Goldstar | 2 | 2.56% |
| Dell | 2 | 2.56% |
| Chi Mei Optoelectronics | 2 | 2.56% |
| Acer | 2 | 2.56% |
| VOR | 1 | 1.28% |
| ViewSonic | 1 | 1.28% |
| Unknown (XXX) | 1 | 1.28% |
| Unknown | 1 | 1.28% |
| MiTAC | 1 | 1.28% |
| InfoVision | 1 | 1.28% |
| CS_ | 1 | 1.28% |
| BenQ | 1 | 1.28% |
| Ancor Communications | 1 | 1.28% |
Monitor Model
Monitor models


| Model | Computers | Percent |
|---|---|---|
| PANDA LCD Monitor NCP004D 1920x1080 344x194mm 15.5-inch | 2 | 2.56% |
| LG Display LCD Monitor LGD0521 1920x1080 309x174mm 14.0-inch | 2 | 2.56% |
| Chimei Innolux LCD Monitor CMN15DB 1366x768 344x193mm 15.5-inch | 2 | 2.56% |
| Chimei Innolux LCD Monitor CMN14B6 1920x1080 308x173mm 13.9-inch | 2 | 2.56% |
| Apple Color LCD APPA01B 1440x900 286x179mm 13.3-inch | 2 | 2.56% |
| VOR LED2380 VOR2380 1920x1080 527x296mm 23.8-inch | 1 | 1.28% |
| ViewSonic VA2718-FHD VSCD839 1920x1080 598x336mm 27.0-inch | 1 | 1.28% |
| Unknown LCD Monitor FFFF 2288x1287 2550x2550mm 142.0-inch | 1 | 1.28% |
| Unknown (XXX) Beyond TV XXX2851 1920x1080 1209x680mm 54.6-inch | 1 | 1.28% |
| Samsung Electronics SyncMaster SAM043F 1920x1200 518x324mm 24.1-inch | 1 | 1.28% |
| Samsung Electronics LF27T450F SAM7097 1920x1080 597x336mm 27.0-inch | 1 | 1.28% |
| Samsung Electronics LCD Monitor SEC3542 2160x1440 254x169mm 12.0-inch | 1 | 1.28% |
| Samsung Electronics LCD Monitor SDC416C 1920x1080 344x194mm 15.5-inch | 1 | 1.28% |
| Samsung Electronics LCD Monitor SDC3252 1366x768 344x194mm 15.5-inch | 1 | 1.28% |
| Samsung Electronics C27F390 SAM0D32 1920x1080 598x336mm 27.0-inch | 1 | 1.28% |
| PANDA LM116LF3L02 NCP000A 1920x1080 256x144mm 11.6-inch | 1 | 1.28% |
| PANDA LCD Monitor NCP0046 1920x1080 344x194mm 15.5-inch | 1 | 1.28% |
| PANDA LCD Monitor NCP0040 1920x1080 344x194mm 15.5-inch | 1 | 1.28% |
| Panasonic VVX14P048M00 MEI96A2 3000x2000 285x190mm 13.5-inch | 1 | 1.28% |
| Panasonic TV MEIC111 1920x540 697x392mm 31.5-inch | 1 | 1.28% |
| MiTAC LCD MONITOR MTC03D7 1920x1080 331x186mm 14.9-inch | 1 | 1.28% |
| LG Display LCD Monitor LGD06D8 1920x1080 344x194mm 15.5-inch | 1 | 1.28% |
| LG Display LCD Monitor LGD0590 1920x1080 344x194mm 15.5-inch | 1 | 1.28% |
| LG Display LCD Monitor LGD0555 2736x1824 260x173mm 12.3-inch | 1 | 1.28% |
| LG Display LCD Monitor LGD0454 1366x768 310x174mm 14.0-inch | 1 | 1.28% |
| LG Display LCD Monitor LGD0450 1366x768 277x156mm 12.5-inch | 1 | 1.28% |
| LG Display LCD Monitor LGD0446 1920x1080 309x174mm 14.0-inch | 1 | 1.28% |
| LG Display LCD Monitor LGD0335 1366x768 310x174mm 14.0-inch | 1 | 1.28% |
| LG Display LCD Monitor LGD02AC 1366x768 344x194mm 15.5-inch | 1 | 1.28% |
| LG Display LCD Monitor LGD0259 1920x1080 345x194mm 15.6-inch | 1 | 1.28% |
| InfoVision LCD Monitor IVO8584 1920x1080 294x165mm 13.3-inch | 1 | 1.28% |
| Goldstar FULL HD GSM5B55 1920x1080 480x270mm 21.7-inch | 1 | 1.28% |
| Goldstar 22EA53 GSM59A6 1920x1080 477x268mm 21.5-inch | 1 | 1.28% |
| Dell P190S DEL405A 1280x1024 376x301mm 19.0-inch | 1 | 1.28% |
| Dell E173FP DELA00B 1280x1024 338x270mm 17.0-inch | 1 | 1.28% |
| CS_ LCD Monitor CS_5211 1366x768 518x333mm 24.2-inch | 1 | 1.28% |
| Chimei Innolux LCD Monitor CMN176E 1920x1080 381x214mm 17.2-inch | 1 | 1.28% |
| Chimei Innolux LCD Monitor CMN1747 1920x1080 381x214mm 17.2-inch | 1 | 1.28% |
| Chimei Innolux LCD Monitor CMN15E3 1920x1080 344x193mm 15.5-inch | 1 | 1.28% |
| Chimei Innolux LCD Monitor CMN1535 1366x768 344x193mm 15.5-inch | 1 | 1.28% |
Monitor Resolution
Monitor screen resolution


| Resolution | Computers | Percent |
|---|---|---|
| 1920x1080 (FHD) | 38 | 50% |
| 1366x768 (WXGA) | 17 | 22.37% |
| 1440x900 (WXGA+) | 4 | 5.26% |
| 3840x2160 (4K) | 3 | 3.95% |
| 1920x1200 (WUXGA) | 3 | 3.95% |
| 2288x1287 | 2 | 2.63% |
| 2160x1440 | 2 | 2.63% |
| 2736x1824 | 1 | 1.32% |
| 2560x1600 | 1 | 1.32% |
| 2560x1440 (QHD) | 1 | 1.32% |
| 1920x540 | 1 | 1.32% |
| 1600x900 (HD+) | 1 | 1.32% |
| 1280x800 (WXGA) | 1 | 1.32% |
| 1280x1024 (SXGA) | 1 | 1.32% |
Monitor Diagonal
Diagonal size in inches


| Inches | Computers | Percent |
|---|---|---|
| 15 | 26 | 33.33% |
| 13 | 13 | 16.67% |
| 14 | 7 | 8.97% |
| 17 | 5 | 6.41% |
| 27 | 4 | 5.13% |
| 21 | 4 | 5.13% |
| 24 | 3 | 3.85% |
| 19 | 3 | 3.85% |
| 11 | 3 | 3.85% |
| 23 | 2 | 2.56% |
| 16 | 2 | 2.56% |
| 12 | 2 | 2.56% |
| 142 | 1 | 1.28% |
| 54 | 1 | 1.28% |
| 31 | 1 | 1.28% |
| 18 | 1 | 1.28% |
Monitor Width
Physical width


| Width in mm | Computers | Percent |
|---|---|---|
| 301-350 | 41 | 52.56% |
| 201-300 | 13 | 16.67% |
| 501-600 | 9 | 11.54% |
| 401-500 | 7 | 8.97% |
| 351-400 | 5 | 6.41% |
| More than 2000 | 1 | 1.28% |
| 601-700 | 1 | 1.28% |
| 1001-1500 | 1 | 1.28% |
Aspect Ratio
Proportional relationship between the width and the height


| Ratio | Computers | Percent |
|---|---|---|
| 16/9 | 56 | 77.78% |
| 16/10 | 11 | 15.28% |
| 5/4 | 2 | 2.78% |
| 3/2 | 2 | 2.78% |
| 1.00 | 1 | 1.39% |
Monitor Area
Area in inch²


| Area in inch² | Computers | Percent |
|---|---|---|
| 101-110 | 26 | 33.33% |
| 81-90 | 17 | 21.79% |
| 201-250 | 6 | 7.69% |
| 71-80 | 4 | 5.13% |
| 301-350 | 4 | 5.13% |
| 151-200 | 4 | 5.13% |
| 121-130 | 4 | 5.13% |
| 51-60 | 3 | 3.85% |
| More than 1000 | 2 | 2.56% |
| 251-300 | 2 | 2.56% |
| 141-150 | 2 | 2.56% |
| 111-120 | 2 | 2.56% |
| 61-70 | 1 | 1.28% |
| 351-500 | 1 | 1.28% |
Pixel Density
Pixels per inch


| Density | Computers | Percent |
|---|---|---|
| 121-160 | 35 | 46.05% |
| 101-120 | 19 | 25% |
| 51-100 | 14 | 18.42% |
| 161-240 | 6 | 7.89% |
| More than 240 | 1 | 1.32% |
| 1-50 | 1 | 1.32% |
Multiple Monitors
Total monitors connected


| Total | Computers | Percent |
|---|---|---|
| 1 | 62 | 86.11% |
| 2 | 9 | 12.5% |
| 0 | 1 | 1.39% |
Network
Net Controller Vendor
Controller vendors


| Vendor | Computers | Percent |
|---|---|---|
| Realtek Semiconductor | 32 | 28.83% |
| Intel | 32 | 28.83% |
| Broadcom | 8 | 7.21% |
| Qualcomm Atheros | 7 | 6.31% |
| MediaTek | 6 | 5.41% |
| Ralink Technology | 4 | 3.6% |
| TP-Link | 3 | 2.7% |
| Marvell Technology Group | 3 | 2.7% |
| Broadcom Limited | 3 | 2.7% |
| ASIX Electronics | 3 | 2.7% |
| Qualcomm Atheros Communications | 2 | 1.8% |
| OPPO Electronics | 2 | 1.8% |
| Samsung Electronics | 1 | 0.9% |
| Ralink | 1 | 0.9% |
| OnePlus | 1 | 0.9% |
| Nvidia | 1 | 0.9% |
| Lenovo | 1 | 0.9% |
| AVM | 1 | 0.9% |
Net Controller Model
Controller models


| Model | Computers | Percent |
|---|---|---|
| Realtek RTL8111/8168/8411 PCI Express Gigabit Ethernet Controller | 21 | 16.15% |
| Realtek RTL8821CE 802.11ac PCIe Wireless Network Adapter | 4 | 3.08% |
| Realtek RTL8822CE 802.11ac PCIe Wireless Network Adapter | 3 | 2.31% |
| Realtek RTL810xE PCI Express Fast Ethernet controller | 3 | 2.31% |
| MediaTek MT7921 802.11ax PCI Express Wireless Network Adapter | 3 | 2.31% |
| Marvell Group 88W8897 [AVASTAR] 802.11ac Wireless | 3 | 2.31% |
| Intel Wireless 8260 | 3 | 2.31% |
| Intel Wi-Fi 6 AX201 | 3 | 2.31% |
| Intel Cannon Point-LP CNVi [Wireless-AC] | 3 | 2.31% |
| Intel Alder Lake-P PCH CNVi WiFi | 3 | 2.31% |
| Broadcom NetXtreme BCM57765 Gigabit Ethernet PCIe | 3 | 2.31% |
| Broadcom Limited BCM4360 802.11ac Wireless Network Adapter | 3 | 2.31% |
| Realtek RTL8822BE 802.11a/b/g/n/ac WiFi adapter | 2 | 1.54% |
| Qualcomm Atheros AR9271 802.11n | 2 | 1.54% |
| Qualcomm Atheros AR93xx Wireless Network Adapter | 2 | 1.54% |
| OPPO RMX2180 | 2 | 1.54% |
| MediaTek MT7612U 802.11a/b/g/n/ac Wireless Adapter | 2 | 1.54% |
| Intel Wireless 7265 | 2 | 1.54% |
| Intel Wireless 7260 | 2 | 1.54% |
| Intel Gemini Lake PCH CNVi WiFi | 2 | 1.54% |
| Intel Ethernet Connection I219-LM | 2 | 1.54% |
| Intel Comet Lake PCH-LP CNVi WiFi | 2 | 1.54% |
| Intel Cannon Lake PCH CNVi WiFi | 2 | 1.54% |
| Intel 82579LM Gigabit Network Connection (Lewisville) | 2 | 1.54% |
| Broadcom BCM43228 802.11a/b/g/n | 2 | 1.54% |
| ASIX AX88179 Gigabit Ethernet | 2 | 1.54% |
| TP-Link Archer T9UH v1 [Realtek RTL8814AU] | 1 | 0.77% |
| TP-Link Archer T3U [Realtek RTL8812BU] | 1 | 0.77% |
| TP-Link Archer T2U PLUS [RTL8821AU] | 1 | 0.77% |
| Samsung GT-I9070 (network tethering, USB debugging enabled) | 1 | 0.77% |
| Realtek RTL8814AU 802.11a/b/g/n/ac Wireless Adapter | 1 | 0.77% |
| Realtek RTL8723DE Wireless Network Adapter | 1 | 0.77% |
| Realtek RTL8723BU 802.11b/g/n WLAN Adapter | 1 | 0.77% |
| Realtek RTL8188FTV 802.11b/g/n 1T1R 2.4G WLAN Adapter | 1 | 0.77% |
| Realtek RTL8188EUS 802.11n Wireless Network Adapter | 1 | 0.77% |
| Realtek RTL8153 Gigabit Ethernet Adapter | 1 | 0.77% |
| Realtek Killer E2500 Gigabit Ethernet Controller | 1 | 0.77% |
| Realtek 802.11n WLAN Adapter | 1 | 0.77% |
| Ralink RT5370 Wireless Adapter | 1 | 0.77% |
| Ralink RT3572 Wireless Adapter | 1 | 0.77% |
Wireless Vendor
Wireless vendors


| Vendor | Computers | Percent |
|---|---|---|
| Intel | 28 | 36.36% |
| Realtek Semiconductor | 15 | 19.48% |
| Qualcomm Atheros | 6 | 7.79% |
| MediaTek | 6 | 7.79% |
| Broadcom | 5 | 6.49% |
| Ralink Technology | 4 | 5.19% |
| TP-Link | 3 | 3.9% |
| Marvell Technology Group | 3 | 3.9% |
| Broadcom Limited | 3 | 3.9% |
| Qualcomm Atheros Communications | 2 | 2.6% |
| Ralink | 1 | 1.3% |
| AVM | 1 | 1.3% |
Wireless Model
Wireless models


| Model | Computers | Percent |
|---|---|---|
| Realtek RTL8821CE 802.11ac PCIe Wireless Network Adapter | 4 | 5.19% |
| Realtek RTL8822CE 802.11ac PCIe Wireless Network Adapter | 3 | 3.9% |
| MediaTek MT7921 802.11ax PCI Express Wireless Network Adapter | 3 | 3.9% |
| Marvell Group 88W8897 [AVASTAR] 802.11ac Wireless | 3 | 3.9% |
| Intel Wireless 8260 | 3 | 3.9% |
| Intel Wi-Fi 6 AX201 | 3 | 3.9% |
| Intel Cannon Point-LP CNVi [Wireless-AC] | 3 | 3.9% |
| Intel Alder Lake-P PCH CNVi WiFi | 3 | 3.9% |
| Broadcom Limited BCM4360 802.11ac Wireless Network Adapter | 3 | 3.9% |
| Realtek RTL8822BE 802.11a/b/g/n/ac WiFi adapter | 2 | 2.6% |
| Qualcomm Atheros AR9271 802.11n | 2 | 2.6% |
| Qualcomm Atheros AR93xx Wireless Network Adapter | 2 | 2.6% |
| MediaTek MT7612U 802.11a/b/g/n/ac Wireless Adapter | 2 | 2.6% |
| Intel Wireless 7265 | 2 | 2.6% |
| Intel Wireless 7260 | 2 | 2.6% |
| Intel Gemini Lake PCH CNVi WiFi | 2 | 2.6% |
| Intel Comet Lake PCH-LP CNVi WiFi | 2 | 2.6% |
| Intel Cannon Lake PCH CNVi WiFi | 2 | 2.6% |
| Broadcom BCM43228 802.11a/b/g/n | 2 | 2.6% |
| TP-Link Archer T9UH v1 [Realtek RTL8814AU] | 1 | 1.3% |
| TP-Link Archer T3U [Realtek RTL8812BU] | 1 | 1.3% |
| TP-Link Archer T2U PLUS [RTL8821AU] | 1 | 1.3% |
| Realtek RTL8814AU 802.11a/b/g/n/ac Wireless Adapter | 1 | 1.3% |
| Realtek RTL8723DE Wireless Network Adapter | 1 | 1.3% |
| Realtek RTL8723BU 802.11b/g/n WLAN Adapter | 1 | 1.3% |
| Realtek RTL8188FTV 802.11b/g/n 1T1R 2.4G WLAN Adapter | 1 | 1.3% |
| Realtek RTL8188EUS 802.11n Wireless Network Adapter | 1 | 1.3% |
| Realtek 802.11n WLAN Adapter | 1 | 1.3% |
| Ralink RT5370 Wireless Adapter | 1 | 1.3% |
| Ralink RT3572 Wireless Adapter | 1 | 1.3% |
| Ralink RT2870/RT3070 Wireless Adapter | 1 | 1.3% |
| Ralink MT7610U ("Archer T2U" 2.4G+5G WLAN Adapter | 1 | 1.3% |
| Ralink RT5390 Wireless 802.11n 1T/1R PCIe | 1 | 1.3% |
| Qualcomm Atheros QCA9565 / AR9565 Wireless Network Adapter | 1 | 1.3% |
| Qualcomm Atheros QCA9377 802.11ac Wireless Network Adapter | 1 | 1.3% |
| Qualcomm Atheros QCA6174 802.11ac Wireless Network Adapter | 1 | 1.3% |
| Qualcomm Atheros AR9485 Wireless Network Adapter | 1 | 1.3% |
| MediaTek MT7922 802.11ax PCI Express Wireless Network Adapter | 1 | 1.3% |
| Intel Wireless-AC 9260 | 1 | 1.3% |
| Intel Wireless 8265 / 8275 | 1 | 1.3% |
Ethernet Vendor
Ethernet vendors


| Vendor | Computers | Percent |
|---|---|---|
| Realtek Semiconductor | 26 | 49.06% |
| Intel | 12 | 22.64% |
| Broadcom | 5 | 9.43% |
| ASIX Electronics | 3 | 5.66% |
| OPPO Electronics | 2 | 3.77% |
| Samsung Electronics | 1 | 1.89% |
| Qualcomm Atheros | 1 | 1.89% |
| OnePlus | 1 | 1.89% |
| Nvidia | 1 | 1.89% |
| Lenovo | 1 | 1.89% |
Ethernet Model
Ethernet models


| Model | Computers | Percent |
|---|---|---|
| Realtek RTL8111/8168/8411 PCI Express Gigabit Ethernet Controller | 21 | 39.62% |
| Realtek RTL810xE PCI Express Fast Ethernet controller | 3 | 5.66% |
| Broadcom NetXtreme BCM57765 Gigabit Ethernet PCIe | 3 | 5.66% |
| OPPO RMX2180 | 2 | 3.77% |
| Intel Ethernet Connection I219-LM | 2 | 3.77% |
| Intel 82579LM Gigabit Network Connection (Lewisville) | 2 | 3.77% |
| ASIX AX88179 Gigabit Ethernet | 2 | 3.77% |
| Samsung GT-I9070 (network tethering, USB debugging enabled) | 1 | 1.89% |
| Realtek RTL8153 Gigabit Ethernet Adapter | 1 | 1.89% |
| Realtek Killer E2500 Gigabit Ethernet Controller | 1 | 1.89% |
| Qualcomm Atheros Killer E220x Gigabit Ethernet Controller | 1 | 1.89% |
| OnePlus OnePlus | 1 | 1.89% |
| Nvidia MCP55 Ethernet | 1 | 1.89% |
| Lenovo ThinkPad TBT 3 Dock | 1 | 1.89% |
| Intel Ethernet Controller I225-V | 1 | 1.89% |
| Intel Ethernet Connection (6) I219-V | 1 | 1.89% |
| Intel Ethernet Connection (4) I219-LM | 1 | 1.89% |
| Intel Ethernet Connection (3) I218-LM | 1 | 1.89% |
| Intel Ethernet Connection (2) I219-LM | 1 | 1.89% |
| Intel Ethernet Connection (2) I218-V | 1 | 1.89% |
| Intel Ethernet Connection (14) I219-V | 1 | 1.89% |
| Intel 82579V Gigabit Network Connection | 1 | 1.89% |
| Broadcom NetXtreme II BCM5709 Gigabit Ethernet | 1 | 1.89% |
| Broadcom NetXtreme BCM57766 Gigabit Ethernet PCIe | 1 | 1.89% |
| ASIX AX88772B | 1 | 1.89% |
Net Controller Kind
Ethernet, WiFi or modem


| Kind | Computers | Percent |
|---|---|---|
| WiFi | 66 | 56.9% |
| Ethernet | 50 | 43.1% |
Used Controller
Currently used network controller


| Kind | Computers | Percent |
|---|---|---|
| WiFi | 43 | 62.32% |
| Ethernet | 26 | 37.68% |
NICs
Total network controllers on board


| Total | Computers | Percent |
|---|---|---|
| 2 | 36 | 50% |
| 1 | 30 | 41.67% |
| 0 | 4 | 5.56% |
| 4 | 2 | 2.78% |
IPv6
IPv6 vs IPv4


| Used | Computers | Percent |
|---|---|---|
| No | 52 | 72.22% |
| Yes | 20 | 27.78% |
Bluetooth
Bluetooth Vendor
Controller vendors


| Vendor | Computers | Percent |
|---|---|---|
| Intel | 25 | 43.1% |
| Realtek Semiconductor | 8 | 13.79% |
| Apple | 8 | 13.79% |
| Foxconn / Hon Hai | 4 | 6.9% |
| IMC Networks | 3 | 5.17% |
| Qualcomm Atheros Communications | 2 | 3.45% |
| Marvell Semiconductor | 2 | 3.45% |
| Cambridge Silicon Radio | 2 | 3.45% |
| Broadcom | 2 | 3.45% |
| Realtek | 1 | 1.72% |
| Lite-On Technology | 1 | 1.72% |
Bluetooth Model
Controller models


| Model | Computers | Percent |
|---|---|---|
| Intel Bluetooth 9460/9560 Jefferson Peak (JfP) | 8 | 13.79% |
| Intel Bluetooth wireless interface | 7 | 12.07% |
| Apple Bluetooth USB Host Controller | 6 | 10.34% |
| Intel AX201 Bluetooth | 5 | 8.62% |
| Realtek Bluetooth Radio | 4 | 6.9% |
| Realtek Bluetooth 4.2 Adapter | 3 | 5.17% |
| Intel Bluetooth Device | 3 | 5.17% |
| Marvell Bluetooth and Wireless LAN Composite | 2 | 3.45% |
| IMC Networks Wireless_Device | 2 | 3.45% |
| Foxconn / Hon Hai Wireless_Device | 2 | 3.45% |
| Cambridge Silicon Radio Bluetooth Dongle (HCI mode) | 2 | 3.45% |
| Apple Built-in Bluetooth 2.0+EDR HCI | 2 | 3.45% |
| Realtek RTL8822BE Bluetooth 4.2 Adapter | 1 | 1.72% |
| Realtek Bluetooth Radio | 1 | 1.72% |
| Qualcomm Atheros Bluetooth Device | 1 | 1.72% |
| Qualcomm Atheros Bluetooth | 1 | 1.72% |
| Lite-On Bluetooth Device | 1 | 1.72% |
| Intel Wireless-AC 9260 Bluetooth Adapter | 1 | 1.72% |
| Intel Centrino Bluetooth Wireless Transceiver | 1 | 1.72% |
| IMC Networks Bluetooth Radio | 1 | 1.72% |
| Foxconn / Hon Hai Bluetooth Device | 1 | 1.72% |
| Foxconn / Hon Hai BCM20702A0 | 1 | 1.72% |
| Broadcom HP Portable SoftSailing | 1 | 1.72% |
| Broadcom BCM20702A0 Bluetooth 4.0 | 1 | 1.72% |
Sound
Sound Vendor
Sound card vendors


| Vendor | Computers | Percent |
|---|---|---|
| Intel | 60 | 63.83% |
| Nvidia | 13 | 13.83% |
| AMD | 12 | 12.77% |
| Texas Instruments | 2 | 2.13% |
| Creative Labs | 2 | 2.13% |
| Samson Technologies | 1 | 1.06% |
| Realtek Semiconductor | 1 | 1.06% |
| Logitech | 1 | 1.06% |
| Lenovo | 1 | 1.06% |
| Chicony Electronics | 1 | 1.06% |
Sound Model
Sound card models


| Model | Computers | Percent |
|---|---|---|
| Intel Sunrise Point-LP HD Audio | 11 | 10% |
| Intel Wildcat Point-LP High Definition Audio Controller | 5 | 4.55% |
| Intel Broadwell-U Audio Controller | 5 | 4.55% |
| Intel 6 Series/C200 Series Chipset Family High Definition Audio Controller | 5 | 4.55% |
| Intel Tiger Lake-LP Smart Sound Technology Audio Controller | 4 | 3.64% |
| Intel Haswell-ULT HD Audio Controller | 4 | 3.64% |
| Intel Celeron/Pentium Silver Processor High Definition Audio | 4 | 3.64% |
| Intel 8 Series HD Audio Controller | 4 | 3.64% |
| Intel 7 Series/C216 Chipset Family High Definition Audio Controller | 4 | 3.64% |
| AMD Renoir Radeon High Definition Audio Controller | 4 | 3.64% |
| AMD Family 17h/19h HD Audio Controller | 4 | 3.64% |
| Nvidia TU107 GeForce GTX 1650 High Definition Audio Controller | 3 | 2.73% |
| Intel Comet Lake PCH cAVS | 3 | 2.73% |
| Intel Cannon Point-LP High Definition Audio Controller | 3 | 2.73% |
| Intel Cannon Lake PCH cAVS | 3 | 2.73% |
| Intel Alder Lake PCH-P High Definition Audio Controller | 3 | 2.73% |
| Nvidia TU116 High Definition Audio Controller | 2 | 1.82% |
| Nvidia Audio device | 2 | 1.82% |
| Intel Xeon E3-1200 v3/4th Gen Core Processor HD Audio Controller | 2 | 1.82% |
| Intel Comet Lake PCH-LP cAVS | 2 | 1.82% |
| Intel 8 Series/C220 Series Chipset High Definition Audio Controller | 2 | 1.82% |
| Texas Instruments PCM2902 Audio Codec | 1 | 0.91% |
| Texas Instruments PCM2900C Audio CODEC | 1 | 0.91% |
| Samson Technologies C01U Pro condenser microphone | 1 | 0.91% |
| Realtek Semiconductor USB Audio | 1 | 0.91% |
| Nvidia MCP55 High Definition Audio | 1 | 0.91% |
| Nvidia GP108 High Definition Audio Controller | 1 | 0.91% |
| Nvidia GP107GL High Definition Audio Controller | 1 | 0.91% |
| Nvidia GK208 HDMI/DP Audio Controller | 1 | 0.91% |
| Nvidia GF108 High Definition Audio Controller | 1 | 0.91% |
| Nvidia GA106 High Definition Audio Controller | 1 | 0.91% |
| Logitech USB Headset | 1 | 0.91% |
| Lenovo ThinkPad Thunderbolt 3 Dock USB Audio | 1 | 0.91% |
| Intel CM238 HD Audio Controller | 1 | 0.91% |
| Intel Celeron N3350/Pentium N4200/Atom E3900 Series Audio Cluster | 1 | 0.91% |
| Intel Audio device | 1 | 0.91% |
| Intel Atom Processor Z36xxx/Z37xxx Series High Definition Audio Controller | 1 | 0.91% |
| Intel 9 Series Chipset Family HD Audio Controller | 1 | 0.91% |
| Intel 82801I (ICH9 Family) HD Audio Controller | 1 | 0.91% |
| Intel 100 Series/C230 Series Chipset Family HD Audio Controller | 1 | 0.91% |
Memory
Memory Vendor
Memory module vendors


| Vendor | Computers | Percent |
|---|---|---|
| SK hynix | 17 | 31.48% |
| Samsung Electronics | 14 | 25.93% |
| Micron Technology | 7 | 12.96% |
| Unknown | 4 | 7.41% |
| Unknown (ABCD) | 3 | 5.56% |
| Kingston | 3 | 5.56% |
| Elpida | 2 | 3.7% |
| Unknown | 2 | 3.7% |
| Avant | 1 | 1.85% |
| A-DATA Technology | 1 | 1.85% |
Memory Model
Memory module models


| Model | Computers | Percent |
|---|---|---|
| Unknown (ABCD) RAM 123456789012345678 2GB SODIMM LPDDR4 2400MT/s | 3 | 5.26% |
| SK hynix RAM Module 4GB SODIMM DDR3 1600MT/s | 3 | 5.26% |
| Samsung RAM M471A1K43CB1-CTD 8GB SODIMM DDR4 2667MT/s | 2 | 3.51% |
| Samsung RAM M471A1K43CB1-CRC 8GB SODIMM DDR4 2667MT/s | 2 | 3.51% |
| Micron RAM 8ATF1G64HZ-3G2J1 8GB SODIMM DDR4 3200MT/s | 2 | 3.51% |
| Unknown | 2 | 3.51% |
| Unknown RAM Module 8GB DIMM 1066MT/s | 1 | 1.75% |
| Unknown RAM Module 4GB DIMM DDR3 1600MT/s | 1 | 1.75% |
| Unknown RAM Module 4GB DIMM DDR3 1333MT/s | 1 | 1.75% |
| Unknown RAM Module 2GB DIMM DDR2 800MT/s | 1 | 1.75% |
| Unknown RAM Module 1GB DIMM DDR2 800MT/s | 1 | 1.75% |
| SK hynix RAM Module 2GB SODIMM DDR3 1600MT/s | 1 | 1.75% |
| SK hynix RAM Module 2GB SODIMM DDR3 1333MT/s | 1 | 1.75% |
| SK hynix RAM Module 2GB SODIMM DDR3 1066MT/s | 1 | 1.75% |
| SK hynix RAM HYMP125S64CR8-S6 2GB SODIMM DDR2 800MT/s | 1 | 1.75% |
| SK hynix RAM HMT351S6CFR8C-PB 4GB SODIMM DDR3 1600MT/s | 1 | 1.75% |
| SK hynix RAM HMCG66MEBSA092N 8GB SODIMM 4800MT/s | 1 | 1.75% |
| SK hynix RAM HMAA1GS6CJR6N-XN 8GB Row Of Chips DDR4 3200MT/s | 1 | 1.75% |
| SK hynix RAM HMA82GS6CJR8N-VK 16GB SODIMM DDR4 2667MT/s | 1 | 1.75% |
| SK hynix RAM HMA81GS6CJR8N-VK 8GB SODIMM DDR4 2667MT/s | 1 | 1.75% |
| SK hynix RAM HMA81GS6AFR8N-UH 8GB SODIMM DDR4 2667MT/s | 1 | 1.75% |
| SK hynix RAM HMA41GS6AFR8N-TF 8192MB SODIMM DDR4 2667MT/s | 1 | 1.75% |
| SK hynix RAM H9HCNNNBKMMLXR-NEE 1GB LPDDR4 3733MT/s | 1 | 1.75% |
| SK hynix RAM H9HCNNN8KUMLHR-NME 1GB LPDDR4 2400MT/s | 1 | 1.75% |
| SK hynix RAM H9CCNNNBJTALAR-NUD 4GB Row Of Chips LPDDR3 1867MT/s | 1 | 1.75% |
| Samsung RAM M471B1G73EB0-YK0 8GB SODIMM DDR3 1600MT/s | 1 | 1.75% |
| Samsung RAM M471B1G73DB0-YK0 8GB SODIMM DDR3 1600MT/s | 1 | 1.75% |
| Samsung RAM M471B1G73BH0-YK0 8GB SODIMM DDR3 1600MT/s | 1 | 1.75% |
| Samsung RAM M471A5244CB0-CWE 4GB SODIMM DDR4 3200MT/s | 1 | 1.75% |
| Samsung RAM M471A5244CB0-CTD 4GB SODIMM DDR4 3266MT/s | 1 | 1.75% |
| Samsung RAM M471A1K43EB1-CWE 8GB SODIMM DDR4 3200MT/s | 1 | 1.75% |
| Samsung RAM M471A1K43DB1-CWE 8GB SODIMM DDR4 3200MT/s | 1 | 1.75% |
| Samsung RAM M471A1K43BB1-CRC 8GB SODIMM DDR4 2667MT/s | 1 | 1.75% |
| Samsung RAM M471A1K43BB0-CPB 8GB SODIMM DDR4 2133MT/s | 1 | 1.75% |
| Samsung RAM M471A1G44AB0-CTD 8GB Row Of Chips DDR4 2667MT/s | 1 | 1.75% |
| Samsung RAM K4EBE304EC-EGCG 8GB Row Of Chips LPDDR3 2133MT/s | 1 | 1.75% |
| Samsung RAM K4AAG165WA-BCWE 8GB SODIMM DDR4 3200MT/s | 1 | 1.75% |
| Micron RAM MTC8C1084S1SC48BA1 16GB SODIMM DDR5 4800MT/s | 1 | 1.75% |
| Micron RAM Module 4GB SODIMM DDR3 1600MT/s | 1 | 1.75% |
| Micron RAM Module 16GB SODIMM DDR4 3200MT/s | 1 | 1.75% |
Memory Kind
Memory module kinds


| Kind | Computers | Percent |
|---|---|---|
| DDR4 | 23 | 45.1% |
| DDR3 | 15 | 29.41% |
| LPDDR4 | 5 | 9.8% |
| DDR2 | 3 | 5.88% |
| LPDDR3 | 2 | 3.92% |
| DDR5 | 2 | 3.92% |
| Unknown | 1 | 1.96% |
Memory Form Factor
Physical design of the memory module


| Name | Computers | Percent |
|---|---|---|
| SODIMM | 38 | 76% |
| DIMM | 6 | 12% |
| Row Of Chips | 4 | 8% |
| Unknown | 2 | 4% |
Memory Size
Memory module size


| Size | Computers | Percent |
|---|---|---|
| 8192 | 23 | 43.4% |
| 4096 | 18 | 33.96% |
| 2048 | 6 | 11.32% |
| 16384 | 4 | 7.55% |
| 1024 | 2 | 3.77% |
Memory Speed
Memory module speed


| Speed | Computers | Percent |
|---|---|---|
| 1600 | 10 | 19.23% |
| 3200 | 9 | 17.31% |
| 2667 | 9 | 17.31% |
| 2400 | 6 | 11.54% |
| 1333 | 4 | 7.69% |
| 2133 | 3 | 5.77% |
| 4800 | 2 | 3.85% |
| 1066 | 2 | 3.85% |
| 800 | 2 | 3.85% |
| 3733 | 1 | 1.92% |
| 3266 | 1 | 1.92% |
| 1867 | 1 | 1.92% |
| 1866 | 1 | 1.92% |
| 1334 | 1 | 1.92% |
Printers & scanners
Printer Vendor
Printer device vendors
Zero info for selected period =(
Printer Model
Printer device models
Zero info for selected period =(
Scanner Vendor
Scanner device vendors
Zero info for selected period =(
Scanner Model
Scanner device models
Zero info for selected period =(
Camera
Camera Vendor
Camera device vendors


| Vendor | Computers | Percent |
|---|---|---|
| Chicony Electronics | 16 | 31.37% |
| Apple | 6 | 11.76% |
| IMC Networks | 5 | 9.8% |
| Quanta | 4 | 7.84% |
| Acer | 3 | 5.88% |
| Syntek | 2 | 3.92% |
| Sonix Technology | 2 | 3.92% |
| Realtek Semiconductor | 2 | 3.92% |
| Microdia | 2 | 3.92% |
| Alcor Micro | 2 | 3.92% |
| SunplusIT | 1 | 1.96% |
| Sunplus Innovation Technology | 1 | 1.96% |
| Microsoft | 1 | 1.96% |
| Lite-On Technology | 1 | 1.96% |
| lihappe8 | 1 | 1.96% |
| icSpring | 1 | 1.96% |
| Holitech | 1 | 1.96% |
Camera Model
Camera device models


| Model | Computers | Percent |
|---|---|---|
| Chicony HP TrueVision HD Camera | 4 | 7.69% |
| Apple FaceTime HD Camera (Built-in) | 4 | 7.69% |
| Chicony HD WebCam | 3 | 5.77% |
| Sonix USB2.0 HD UVC WebCam | 2 | 3.85% |
| IMC Networks HD Camera | 2 | 3.85% |
| Chicony Integrated Camera | 2 | 3.85% |
| Syntek Integrated Camera | 1 | 1.92% |
| Syntek EasyCamera | 1 | 1.92% |
| SunplusIT USB camera | 1 | 1.92% |
| Sunplus Lenovo EasyCamera | 1 | 1.92% |
| Realtek Integrated_Webcam_HD | 1 | 1.92% |
| Realtek HP Wide Vision FHD Camera | 1 | 1.92% |
| Quanta USB2.0 HD UVC WebCam | 1 | 1.92% |
| Quanta HP Wide Vision HD Camera | 1 | 1.92% |
| Quanta HP HD Camera | 1 | 1.92% |
| Quanta HD User Facing | 1 | 1.92% |
| Microsoft LifeCam Rear | 1 | 1.92% |
| Microsoft LifeCam Front | 1 | 1.92% |
| Microdia Integrated_Webcam_HD | 1 | 1.92% |
| Microdia Integrated_Webcam_FHD | 1 | 1.92% |
| Lite-On HP Wide Vision HD Camera | 1 | 1.92% |
| lihappe8 USB 2.0 Camera | 1 | 1.92% |
| IMC Networks USB2.0 HD UVC WebCam | 1 | 1.92% |
| IMC Networks Lenovo EasyCamera | 1 | 1.92% |
| IMC Networks EasyCamera | 1 | 1.92% |
| icSpring camera | 1 | 1.92% |
| Holitech USB2.0 HD UVC WebCam | 1 | 1.92% |
| Chicony VGA Webcam | 1 | 1.92% |
| Chicony USB2.0 VGA UVC WebCam | 1 | 1.92% |
| Chicony USB2.0 Camera | 1 | 1.92% |
| Chicony Lenovo EasyCamera | 1 | 1.92% |
| Chicony Integrated Camera (1280x720@30) | 1 | 1.92% |
| Chicony HP TrueVision HD | 1 | 1.92% |
| Chicony HP HD Webcam [Fixed] | 1 | 1.92% |
| Apple iPhone 5/5C/5S/6/SE | 1 | 1.92% |
| Apple FaceTime HD Camera | 1 | 1.92% |
| Alcor Micro USB 2.0 WebCamera | 1 | 1.92% |
| Alcor Micro HD Webcam | 1 | 1.92% |
| Acer ThinkPad P50 Integrated Camera | 1 | 1.92% |
| Acer Lenovo Integrated Webcam | 1 | 1.92% |
Security
Fingerprint Vendor
Fingerprint sensor vendors


| Vendor | Computers | Percent |
|---|---|---|
| Synaptics | 4 | 50% |
| Validity Sensors | 3 | 37.5% |
| Shenzhen Goodix Technology | 1 | 12.5% |
Fingerprint Model
Fingerprint sensor models


| Model | Computers | Percent |
|---|---|---|
| Unknown | 2 | 25% |
| Validity Sensors VFS491 | 1 | 12.5% |
| Validity Sensors Synaptics WBDI | 1 | 12.5% |
| Validity Sensors Fingerprint scanner | 1 | 12.5% |
| Synaptics FS7604 Touch Fingerprint Sensor with PurePrint | 1 | 12.5% |
| Synaptics Metallica MOH Touch Fingerprint Reader | 1 | 12.5% |
| Shenzhen Goodix Fingerprint Device | 1 | 12.5% |
Chipcard Vendor
Chipcard module vendors


| Vendor | Computers | Percent |
|---|---|---|
| Broadcom | 2 | 100% |
Chipcard Model
Chipcard module models


| Model | Computers | Percent |
|---|---|---|
| Broadcom 5880 | 2 | 100% |
Unsupported
Unsupported Devices
Total unsupported devices on board


| Total | Computers | Percent |
|---|---|---|
| 0 | 41 | 56.94% |
| 1 | 27 | 37.5% |
| 2 | 4 | 5.56% |
Unsupported Device Types
Types of unsupported devices


| Type | Computers | Percent |
|---|---|---|
| Fingerprint reader | 8 | 23.53% |
| Multimedia controller | 7 | 20.59% |
| Graphics card | 7 | 20.59% |
| Net/wireless | 3 | 8.82% |
| Chipcard | 2 | 5.88% |
| Card reader | 2 | 5.88% |
| Camera | 2 | 5.88% |
| Unclassified device | 1 | 2.94% |
| Network | 1 | 2.94% |
| Bluetooth | 1 | 2.94% |