Kali - Hardware Trends (Desktops)
A project to identify most popular hardware characteristics and track their change over time based on data collected by Linux users at https://Linux-Hardware.org.
Anyone can contribute to this report by the hw-probe tool:
sudo -E hw-probe -all -uploadThis report is for one last month. Overall report since the beginning of time: TestCoverage
Period: Jul, 2022.
Contents
System
OS
Installed operating systems


| Name | Desktops | Percent |
|---|---|---|
| Kali 2022.2 | 4 | 57.14% |
| Kali 2022.3 | 2 | 28.57% |
| Kali 2022.1 | 1 | 14.29% |
OS Family
OS without a version


| Name | Desktops | Percent |
|---|---|---|
| Kali | 7 | 100% |
Kernel
Version of the Linux kernel


| Version | Desktops | Percent |
|---|---|---|
| 5.18.0-kali5-amd64 | 3 | 42.86% |
| 5.18.0-kali2-amd64 | 2 | 28.57% |
| 5.15.0-kali3-amd64 | 1 | 14.29% |
| 5.15.0-kali2-amd64 | 1 | 14.29% |
Kernel Family
Linux kernel without a distro release


| Version | Desktops | Percent |
|---|---|---|
| 5.18.0 | 5 | 71.43% |
| 5.15.0 | 2 | 28.57% |
Kernel Major Ver.
Linux kernel major version


| Version | Desktops | Percent |
|---|---|---|
| 5.18 | 5 | 71.43% |
| 5.15 | 2 | 28.57% |
Arch
OS architecture (x86_64, i586, etc.)


| Name | Desktops | Percent |
|---|---|---|
| x86_64 | 7 | 100% |
DE
Desktop Environment


| Name | Desktops | Percent |
|---|---|---|
| XFCE | 5 | 71.43% |
| KDE5 | 2 | 28.57% |
Display Server
X11 or Wayland


| Name | Desktops | Percent |
|---|---|---|
| X11 | 7 | 100% |
Display Manager
SDDM, LightDM, etc.


| Name | Desktops | Percent |
|---|---|---|
| LightDM | 3 | 42.86% |
| SDDM | 2 | 28.57% |
| Unknown | 2 | 28.57% |
OS Lang
Language


| Lang | Desktops | Percent |
|---|---|---|
| en_GB | 3 | 42.86% |
| en_US | 2 | 28.57% |
| ru_RU | 1 | 14.29% |
| en_AU | 1 | 14.29% |
Boot Mode
EFI or BIOS


| Mode | Desktops | Percent |
|---|---|---|
| EFI | 4 | 57.14% |
| BIOS | 3 | 42.86% |
Filesystem
Type of filesystem


| Type | Desktops | Percent |
|---|---|---|
| Ext4 | 7 | 100% |
Part. scheme
Scheme of partitioning


| Type | Desktops | Percent |
|---|---|---|
| GPT | 4 | 57.14% |
| Unknown | 2 | 28.57% |
| MBR | 1 | 14.29% |
Dual Boot with Linux/BSD
Hosting more than one Linux/BSD


| Dual boot | Desktops | Percent |
|---|---|---|
| No | 6 | 85.71% |
| Yes | 1 | 14.29% |
Dual Boot (Win)
Hosting Linux and Windows


| Dual boot | Desktops | Percent |
|---|---|---|
| No | 4 | 57.14% |
| Yes | 3 | 42.86% |
Board
Vendor
Motherboard manufacturer


| Name | Desktops | Percent |
|---|---|---|
| ASUSTek Computer | 4 | 57.14% |
| MSI | 1 | 14.29% |
| Gigabyte Technology | 1 | 14.29% |
| Dell | 1 | 14.29% |
Model
Motherboard model


| Name | Desktops | Percent |
|---|---|---|
| MSI MS-7A34 | 1 | 14.29% |
| Gigabyte AB350M-DS3H | 1 | 14.29% |
| Dell OptiPlex 3010 | 1 | 14.29% |
| ASUS ROG STRIX B550-F GAMING | 1 | 14.29% |
| ASUS ROG STRIX B365-G GAMING | 1 | 14.29% |
| ASUS H61-PLUS | 1 | 14.29% |
| ASUS 970 PRO GAMING/AURA | 1 | 14.29% |
Model Family
Motherboard model prefix


| Name | Desktops | Percent |
|---|---|---|
| ASUS ROG | 2 | 28.57% |
| MSI MS-7A34 | 1 | 14.29% |
| Gigabyte AB350M-DS3H | 1 | 14.29% |
| Dell OptiPlex | 1 | 14.29% |
| ASUS H61-PLUS | 1 | 14.29% |
| ASUS 970 | 1 | 14.29% |
MFG Year
Motherboard manufacture year


| Year | Desktops | Percent |
|---|---|---|
| 2020 | 1 | 14.29% |
| 2019 | 1 | 14.29% |
| 2018 | 1 | 14.29% |
| 2017 | 1 | 14.29% |
| 2016 | 1 | 14.29% |
| 2013 | 1 | 14.29% |
| 2012 | 1 | 14.29% |
Form Factor
Physical design of the computer


| Name | Desktops | Percent |
|---|---|---|
| Desktop | 7 | 100% |
Secure Boot
Enabled or disabled


| State | Desktops | Percent |
|---|---|---|
| Disabled | 7 | 100% |
Coreboot
Have coreboot on board


| Used | Desktops | Percent |
|---|---|---|
| No | 7 | 100% |
RAM Size
Total RAM memory


| Size in GB | Desktops | Percent |
|---|---|---|
| 32.01-64.0 | 2 | 28.57% |
| 24.01-32.0 | 2 | 28.57% |
| 4.01-8.0 | 1 | 14.29% |
| 3.01-4.0 | 1 | 14.29% |
| 8.01-16.0 | 1 | 14.29% |
RAM Used
Used RAM memory


| Used GB | Desktops | Percent |
|---|---|---|
| 3.01-4.0 | 2 | 28.57% |
| 2.01-3.0 | 2 | 28.57% |
| 1.01-2.0 | 2 | 28.57% |
| 4.01-8.0 | 1 | 14.29% |
Total Drives
Number of drives on board


| Drives | Desktops | Percent |
|---|---|---|
| 1 | 3 | 42.86% |
| 2 | 2 | 28.57% |
| 6 | 1 | 14.29% |
| 3 | 1 | 14.29% |
Has CD-ROM
Has CD-ROM on board


| Presented | Desktops | Percent |
|---|---|---|
| No | 5 | 71.43% |
| Yes | 2 | 28.57% |
Has Ethernet
Has Ethernet on board


| Presented | Desktops | Percent |
|---|---|---|
| Yes | 7 | 100% |
Has WiFi
Has WiFi module


| Presented | Desktops | Percent |
|---|---|---|
| Yes | 7 | 100% |
Has Bluetooth
Has Bluetooth module


| Presented | Desktops | Percent |
|---|---|---|
| No | 5 | 71.43% |
| Yes | 2 | 28.57% |
Location
Country
Geographic location (country)


| Country | Desktops | Percent |
|---|---|---|
| UK | 2 | 28.57% |
| USA | 1 | 14.29% |
| Spain | 1 | 14.29% |
| Russia | 1 | 14.29% |
| France | 1 | 14.29% |
| Australia | 1 | 14.29% |
City
Geographic location (city)


| City | Desktops | Percent |
|---|---|---|
| Yekaterinburg | 1 | 14.29% |
| Toowoomba | 1 | 14.29% |
| Salamanca | 1 | 14.29% |
| Harrisonburg | 1 | 14.29% |
| Gennevilliers | 1 | 14.29% |
| City of London | 1 | 14.29% |
| Bristol | 1 | 14.29% |
Drives
Drive Vendor
Hard drive vendors


| Vendor | Desktops | Drives | Percent |
|---|---|---|---|
| Seagate | 3 | 3 | 21.43% |
| WDC | 2 | 3 | 14.29% |
| Toshiba | 2 | 3 | 14.29% |
| XrayDisk | 1 | 1 | 7.14% |
| SPCC | 1 | 1 | 7.14% |
| Samsung Electronics | 1 | 1 | 7.14% |
| Phison | 1 | 1 | 7.14% |
| Maxtor | 1 | 1 | 7.14% |
| Kingston | 1 | 1 | 7.14% |
| Hitachi | 1 | 1 | 7.14% |
Drive Model
Hard drive models


| Model | Desktops | Percent |
|---|---|---|
| XrayDisk SSD 512GB | 1 | 6.25% |
| WDC WDS100T2B0A-00SM50 1TB SSD | 1 | 6.25% |
| WDC WD40EFAX-68JH4N0 4TB | 1 | 6.25% |
| WDC WD3200AAKS-00L9A0 320GB | 1 | 6.25% |
| Toshiba MQ01ABF050 500GB | 1 | 6.25% |
| Toshiba HDWR160 6TB | 1 | 6.25% |
| Toshiba HDWE150 5TB | 1 | 6.25% |
| SPCC Solid State Disk 120GB | 1 | 6.25% |
| Seagate ST9200827AS 200GB | 1 | 6.25% |
| Seagate ST3500413AS 500GB | 1 | 6.25% |
| Seagate ST1000DM003-1SB102 1TB | 1 | 6.25% |
| Samsung SSD 840 EVO 120GB | 1 | 6.25% |
| Phison MSI M390 1TB | 1 | 6.25% |
| Maxtor STM3250310AS 250GB | 1 | 6.25% |
| Kingston SV300S37A120G 120GB SSD | 1 | 6.25% |
| Hitachi HTS547575A9E384 752GB | 1 | 6.25% |
HDD Vendor
Hard disk drive vendors


| Vendor | Desktops | Drives | Percent |
|---|---|---|---|
| Seagate | 3 | 3 | 33.33% |
| WDC | 2 | 2 | 22.22% |
| Toshiba | 2 | 3 | 22.22% |
| Maxtor | 1 | 1 | 11.11% |
| Hitachi | 1 | 1 | 11.11% |
SSD Vendor
Solid state drive vendors


| Vendor | Desktops | Drives | Percent |
|---|---|---|---|
| XrayDisk | 1 | 1 | 20% |
| WDC | 1 | 1 | 20% |
| SPCC | 1 | 1 | 20% |
| Samsung Electronics | 1 | 1 | 20% |
| Kingston | 1 | 1 | 20% |
Drive Kind
HDD or SSD


| Kind | Desktops | Drives | Percent |
|---|---|---|---|
| HDD | 7 | 10 | 70% |
| SSD | 2 | 5 | 20% |
| NVMe | 1 | 1 | 10% |
Drive Connector
SATA, SAS, NVMe, etc.


| Type | Desktops | Drives | Percent |
|---|---|---|---|
| SATA | 7 | 15 | 87.5% |
| NVMe | 1 | 1 | 12.5% |
Drive Size
Size of hard drive


| Size in TB | Desktops | Drives | Percent |
|---|---|---|---|
| 0.01-0.5 | 5 | 8 | 45.45% |
| 0.51-1.0 | 4 | 4 | 36.36% |
| 3.01-4.0 | 1 | 1 | 9.09% |
| 4.01-10.0 | 1 | 2 | 9.09% |
Space Total
Amount of disk space available on the file system


| Size in GB | Desktops | Percent |
|---|---|---|
| 501-1000 | 3 | 42.86% |
| 101-250 | 2 | 28.57% |
| More than 3000 | 1 | 14.29% |
| 251-500 | 1 | 14.29% |
Space Used
Amount of used disk space


| Used GB | Desktops | Percent |
|---|---|---|
| 251-500 | 2 | 28.57% |
| 1-20 | 2 | 28.57% |
| More than 3000 | 1 | 14.29% |
| 101-250 | 1 | 14.29% |
| 51-100 | 1 | 14.29% |
Malfunc. Drives
Drive models with a malfunction


| Model | Desktops | Drives | Percent |
|---|---|---|---|
| SPCC Solid State Disk 120GB | 1 | 1 | 50% |
| Seagate ST9200827AS 200GB | 1 | 1 | 50% |
Malfunc. Drive Vendor
Vendors of faulty drives


| Vendor | Desktops | Drives | Percent |
|---|---|---|---|
| SPCC | 1 | 1 | 50% |
| Seagate | 1 | 1 | 50% |
Malfunc. HDD Vendor
Vendors of faulty HDD drives


| Vendor | Desktops | Drives | Percent |
|---|---|---|---|
| Seagate | 1 | 1 | 100% |
Malfunc. Drive Kind
Kinds of faulty drives


| Kind | Desktops | Drives | Percent |
|---|---|---|---|
| SSD | 1 | 1 | 50% |
| HDD | 1 | 1 | 50% |
Failed Drives
Failed drive models
Zero info for selected period =(
Failed Drive Vendor
Failed drive vendors
Zero info for selected period =(
Drive Status
Number of failed and malfunc. drives


| Status | Desktops | Drives | Percent |
|---|---|---|---|
| Works | 4 | 11 | 50% |
| Detected | 2 | 3 | 25% |
| Malfunc | 2 | 2 | 25% |
Storage controller
Storage Vendor
Storage controller vendors


| Vendor | Desktops | Percent |
|---|---|---|
| AMD | 4 | 50% |
| Intel | 3 | 37.5% |
| Phison Electronics | 1 | 12.5% |
Storage Model
Storage controller models


| Model | Desktops | Percent |
|---|---|---|
| Intel 6 Series/C200 Series Chipset Family 6 port Desktop SATA AHCI Controller | 2 | 20% |
| AMD FCH SATA Controller [AHCI mode] | 2 | 20% |
| Phison Electronics Non-Volatile memory controller | 1 | 10% |
| Intel 200 Series PCH SATA controller [AHCI mode] | 1 | 10% |
| AMD X370 Series Chipset SATA Controller | 1 | 10% |
| AMD SB7x0/SB8x0/SB9x0 SATA Controller [AHCI mode] | 1 | 10% |
| AMD 500 Series Chipset SATA Controller | 1 | 10% |
| AMD 300 Series Chipset SATA Controller | 1 | 10% |
Storage Kind
Kind of storage controller (IDE, SATA, NVMe, SAS, ...)


| Kind | Desktops | Percent |
|---|---|---|
| SATA | 7 | 87.5% |
| NVMe | 1 | 12.5% |
Processor
CPU Vendor
Processor vendors


| Vendor | Desktops | Percent |
|---|---|---|
| AMD | 4 | 57.14% |
| Intel | 3 | 42.86% |
CPU Model
Processor models


| Model | Desktops | Percent |
|---|---|---|
| Intel Core i5-2400S CPU @ 2.50GHz | 1 | 14.29% |
| Intel Core i3-9100 CPU @ 3.60GHz | 1 | 14.29% |
| Intel Core i3-3240 CPU @ 3.40GHz | 1 | 14.29% |
| AMD Ryzen 5 5600G with Radeon Graphics | 1 | 14.29% |
| AMD Ryzen 5 1600 Six-Core Processor | 1 | 14.29% |
| AMD Ryzen 3 1200 Quad-Core Processor | 1 | 14.29% |
| AMD FX-6300 Six-Core Processor | 1 | 14.29% |
CPU Model Family
Processor model prefix


| Model | Desktops | Percent |
|---|---|---|
| Intel Core i3 | 2 | 28.57% |
| AMD Ryzen 5 | 2 | 28.57% |
| Intel Core i5 | 1 | 14.29% |
| AMD Ryzen 3 | 1 | 14.29% |
| AMD FX | 1 | 14.29% |
CPU Cores
Number of processor cores


| Number | Desktops | Percent |
|---|---|---|
| 4 | 3 | 42.86% |
| 6 | 2 | 28.57% |
| 3 | 1 | 14.29% |
| 2 | 1 | 14.29% |
CPU Sockets
Number of sockets


| Number | Desktops | Percent |
|---|---|---|
| 1 | 7 | 100% |
CPU Threads
Threads per core (Hyper-Threading)


| Number | Desktops | Percent |
|---|---|---|
| 2 | 4 | 57.14% |
| 1 | 3 | 42.86% |
CPU Op-Modes
CPU Operation Modes (32-bit, 64-bit)


| Op mode | Desktops | Percent |
|---|---|---|
| 32-bit, 64-bit | 7 | 100% |
CPU Microcode
Microcode number


| Number | Desktops | Percent |
|---|---|---|
| 0x08001129 | 2 | 28.57% |
| 0x906eb | 1 | 14.29% |
| 0x306a9 | 1 | 14.29% |
| 0x0a50000d | 1 | 14.29% |
| 0x06000852 | 1 | 14.29% |
| Unknown | 1 | 14.29% |
CPU Microarch
Microarchitecture


| Name | Desktops | Percent |
|---|---|---|
| Zen | 2 | 28.57% |
| Zen 3 | 1 | 14.29% |
| SandyBridge | 1 | 14.29% |
| Piledriver | 1 | 14.29% |
| KabyLake | 1 | 14.29% |
| IvyBridge | 1 | 14.29% |
Graphics
GPU Vendor
Vendors of graphics cards


| Vendor | Desktops | Percent |
|---|---|---|
| Nvidia | 4 | 50% |
| Intel | 2 | 25% |
| AMD | 2 | 25% |
GPU Model
Graphics card models


| Model | Desktops | Percent |
|---|---|---|
| Nvidia TU116 [GeForce GTX 1650 SUPER] | 1 | 12.5% |
| Nvidia GP108 [GeForce GT 1030] | 1 | 12.5% |
| Nvidia GP107 [GeForce GTX 1050] | 1 | 12.5% |
| Nvidia GF108 [GeForce GT 630] | 1 | 12.5% |
| Intel CoffeeLake-S GT2 [UHD Graphics 630] | 1 | 12.5% |
| Intel 2nd Generation Core Processor Family Integrated Graphics Controller | 1 | 12.5% |
| AMD Cezanne | 1 | 12.5% |
| AMD Baffin [Radeon RX 550 640SP / RX 560/560X] | 1 | 12.5% |
GPU Combo
Combinations of graphics cards


| Name | Desktops | Percent |
|---|---|---|
| 1 x Nvidia | 4 | 57.14% |
| 1 x AMD | 2 | 28.57% |
| 1 x Intel | 1 | 14.29% |
GPU Driver
Free vs proprietary


| Driver | Desktops | Percent |
|---|---|---|
| Free | 5 | 71.43% |
| Proprietary | 2 | 28.57% |
GPU Memory
Total video memory


| Size in GB | Desktops | Percent |
|---|---|---|
| 1.01-2.0 | 3 | 42.86% |
| 3.01-4.0 | 2 | 28.57% |
| 0.01-0.5 | 1 | 14.29% |
| Unknown | 1 | 14.29% |
Monitor
Monitor Vendor
Monitor vendors


| Vendor | Desktops | Percent |
|---|---|---|
| Samsung Electronics | 3 | 50% |
| Panasonic | 1 | 16.67% |
| Hewlett-Packard | 1 | 16.67% |
| HannStar | 1 | 16.67% |
Monitor Model
Monitor models


| Model | Desktops | Percent |
|---|---|---|
| Samsung Electronics U28E590 SAM0C4E 3840x2160 610x350mm 27.7-inch | 1 | 14.29% |
| Samsung Electronics SyncMaster SAM0273 1440x900 410x257mm 19.1-inch | 1 | 14.29% |
| Samsung Electronics LCD Monitor SyncMaster 1440x900 | 1 | 14.29% |
| Samsung Electronics LCD Monitor SAM039B 1280x720 | 1 | 14.29% |
| Panasonic TV MEIA0CC 1920x1080 698x392mm 31.5-inch | 1 | 14.29% |
| Hewlett-Packard 21kd HWP3329 1920x1080 458x258mm 20.7-inch | 1 | 14.29% |
| HannStar LM02 HSP0013 1440x900 408x255mm 18.9-inch | 1 | 14.29% |
Monitor Resolution
Monitor screen resolution


| Resolution | Desktops | Percent |
|---|---|---|
| 1920x1080 (FHD) | 2 | 33.33% |
| 1440x900 (WXGA+) | 2 | 33.33% |
| 3840x2160 (4K) | 1 | 16.67% |
| 1280x720 (HD) | 1 | 16.67% |
Monitor Diagonal
Diagonal size in inches


| Inches | Desktops | Percent |
|---|---|---|
| Unknown | 2 | 28.57% |
| 31 | 1 | 14.29% |
| 27 | 1 | 14.29% |
| 20 | 1 | 14.29% |
| 19 | 1 | 14.29% |
| 18 | 1 | 14.29% |
Monitor Width
Physical width


| Width in mm | Desktops | Percent |
|---|---|---|
| 401-500 | 3 | 42.86% |
| 601-700 | 2 | 28.57% |
| Unknown | 2 | 28.57% |
Aspect Ratio
Proportional relationship between the width and the height


| Ratio | Desktops | Percent |
|---|---|---|
| 16/9 | 4 | 57.14% |
| 16/10 | 2 | 28.57% |
| Unknown | 1 | 14.29% |
Monitor Area
Area in inch²


| Area in inch² | Desktops | Percent |
|---|---|---|
| 151-200 | 3 | 42.86% |
| Unknown | 2 | 28.57% |
| 351-500 | 1 | 14.29% |
| 301-350 | 1 | 14.29% |
Pixel Density
Pixels per inch


| Density | Desktops | Percent |
|---|---|---|
| 51-100 | 3 | 42.86% |
| Unknown | 2 | 28.57% |
| 121-160 | 1 | 14.29% |
| 101-120 | 1 | 14.29% |
Multiple Monitors
Total monitors connected


| Total | Desktops | Percent |
|---|---|---|
| 1 | 6 | 85.71% |
| 2 | 1 | 14.29% |
Network
Net Controller Vendor
Controller vendors


| Vendor | Desktops | Percent |
|---|---|---|
| Realtek Semiconductor | 5 | 31.25% |
| Intel | 5 | 31.25% |
| Qualcomm Atheros Communications | 2 | 12.5% |
| Ralink Technology | 1 | 6.25% |
| Qualcomm Atheros | 1 | 6.25% |
| D-Link | 1 | 6.25% |
| ASUSTek Computer | 1 | 6.25% |
Net Controller Model
Controller models


| Model | Desktops | Percent |
|---|---|---|
| Realtek RTL8111/8168/8411 PCI Express Gigabit Ethernet Controller | 5 | 26.32% |
| Realtek RTL8812AU 802.11a/b/g/n/ac 2T2R DB WLAN Adapter | 2 | 10.53% |
| Qualcomm Atheros AR9271 802.11n | 2 | 10.53% |
| Realtek Realtek 8812AU/8821AU 802.11ac WLAN Adapter [USB Wireless Dual-Band Adapter 2.4/5Ghz] | 1 | 5.26% |
| Ralink RT2870/RT3070 Wireless Adapter | 1 | 5.26% |
| Qualcomm Atheros AR9227 Wireless Network Adapter | 1 | 5.26% |
| Intel Wi-Fi 6 AX210/AX211/AX411 160MHz | 1 | 5.26% |
| Intel Ultimate N WiFi Link 5300 | 1 | 5.26% |
| Intel I211 Gigabit Network Connection | 1 | 5.26% |
| Intel Ethernet Controller I225-V | 1 | 5.26% |
| Intel Ethernet Connection (2) I219-V | 1 | 5.26% |
| D-Link DWA-123 Wireless N 150 Adapter (rev.D1) | 1 | 5.26% |
| ASUS 802.11ac NIC | 1 | 5.26% |
Wireless Vendor
Wireless vendors


| Vendor | Desktops | Percent |
|---|---|---|
| Realtek Semiconductor | 3 | 27.27% |
| Qualcomm Atheros Communications | 2 | 18.18% |
| Intel | 2 | 18.18% |
| Ralink Technology | 1 | 9.09% |
| Qualcomm Atheros | 1 | 9.09% |
| D-Link | 1 | 9.09% |
| ASUSTek Computer | 1 | 9.09% |
Wireless Model
Wireless models


| Model | Desktops | Percent |
|---|---|---|
| Realtek RTL8812AU 802.11a/b/g/n/ac 2T2R DB WLAN Adapter | 2 | 18.18% |
| Qualcomm Atheros AR9271 802.11n | 2 | 18.18% |
| Realtek Realtek 8812AU/8821AU 802.11ac WLAN Adapter [USB Wireless Dual-Band Adapter 2.4/5Ghz] | 1 | 9.09% |
| Ralink RT2870/RT3070 Wireless Adapter | 1 | 9.09% |
| Qualcomm Atheros AR9227 Wireless Network Adapter | 1 | 9.09% |
| Intel Wi-Fi 6 AX210/AX211/AX411 160MHz | 1 | 9.09% |
| Intel Ultimate N WiFi Link 5300 | 1 | 9.09% |
| D-Link DWA-123 Wireless N 150 Adapter (rev.D1) | 1 | 9.09% |
| ASUS 802.11ac NIC | 1 | 9.09% |
Ethernet Vendor
Ethernet vendors


| Vendor | Desktops | Percent |
|---|---|---|
| Realtek Semiconductor | 5 | 62.5% |
| Intel | 3 | 37.5% |
Ethernet Model
Ethernet models


| Model | Desktops | Percent |
|---|---|---|
| Realtek RTL8111/8168/8411 PCI Express Gigabit Ethernet Controller | 5 | 62.5% |
| Intel I211 Gigabit Network Connection | 1 | 12.5% |
| Intel Ethernet Controller I225-V | 1 | 12.5% |
| Intel Ethernet Connection (2) I219-V | 1 | 12.5% |
Net Controller Kind
Ethernet, WiFi or modem


| Kind | Desktops | Percent |
|---|---|---|
| WiFi | 7 | 50% |
| Ethernet | 7 | 50% |
Used Controller
Currently used network controller


| Kind | Desktops | Percent |
|---|---|---|
| Ethernet | 6 | 66.67% |
| WiFi | 3 | 33.33% |
NICs
Total network controllers on board


| Total | Desktops | Percent |
|---|---|---|
| 2 | 4 | 57.14% |
| 1 | 3 | 42.86% |
IPv6
IPv6 vs IPv4


| Used | Desktops | Percent |
|---|---|---|
| No | 6 | 85.71% |
| Yes | 1 | 14.29% |
Bluetooth
Bluetooth Vendor
Controller vendors


| Vendor | Desktops | Percent |
|---|---|---|
| Realtek Semiconductor | 1 | 50% |
| Broadcom | 1 | 50% |
Bluetooth Model
Controller models


| Model | Desktops | Percent |
|---|---|---|
| Realtek Bluetooth Radio | 1 | 50% |
| Broadcom BCM2045 Bluetooth | 1 | 50% |
Sound
Sound Vendor
Sound card vendors


| Vendor | Desktops | Percent |
|---|---|---|
| Nvidia | 4 | 36.36% |
| AMD | 4 | 36.36% |
| Intel | 3 | 27.27% |
Sound Model
Sound card models


| Model | Desktops | Percent |
|---|---|---|
| Intel 6 Series/C200 Series Chipset Family High Definition Audio Controller | 2 | 15.38% |
| AMD Family 17h (Models 00h-0fh) HD Audio Controller | 2 | 15.38% |
| Nvidia TU116 High Definition Audio Controller | 1 | 7.69% |
| Nvidia GP108 High Definition Audio Controller | 1 | 7.69% |
| Nvidia GP107GL High Definition Audio Controller | 1 | 7.69% |
| Nvidia GF108 High Definition Audio Controller | 1 | 7.69% |
| Intel 200 Series PCH HD Audio | 1 | 7.69% |
| AMD SBx00 Azalia (Intel HDA) | 1 | 7.69% |
| AMD Renoir Radeon High Definition Audio Controller | 1 | 7.69% |
| AMD Family 17h/19h HD Audio Controller | 1 | 7.69% |
| AMD Baffin HDMI/DP Audio [Radeon RX 550 640SP / RX 560/560X] | 1 | 7.69% |
Memory
Memory Vendor
Memory module vendors


| Vendor | Desktops | Percent |
|---|---|---|
| Corsair | 4 | 57.14% |
| Kingston | 1 | 14.29% |
| Crucial | 1 | 14.29% |
| Atermiter | 1 | 14.29% |
Memory Model
Memory module models


| Model | Desktops | Percent |
|---|---|---|
| Corsair RAM CMK16GX4M2B3200C16 8GB DIMM DDR4 3600MT/s | 2 | 25% |
| Kingston RAM KHX2133C14D4/4G 4GB DIMM DDR4 2933MT/s | 1 | 12.5% |
| Crucial RAM BLS8G4D240FSC.16FBD 8GB DIMM DDR4 2667MT/s | 1 | 12.5% |
| Corsair RAM CMX4GX3M1A1600C11 4GB DIMM DDR3 1600MT/s | 1 | 12.5% |
| Corsair RAM CMW16GX4M2C3200C16 8GB DIMM DDR4 3266MT/s | 1 | 12.5% |
| Corsair RAM CMK32GX4M2B3000C15 16GB DIMM DDR4 3000MT/s | 1 | 12.5% |
| Atermiter RAM Module 8GB DIMM DDR4 2133MT/s | 1 | 12.5% |
Memory Kind
Memory module kinds


| Kind | Desktops | Percent |
|---|---|---|
| DDR4 | 4 | 80% |
| DDR3 | 1 | 20% |
Memory Form Factor
Physical design of the memory module


| Name | Desktops | Percent |
|---|---|---|
| DIMM | 5 | 100% |
Memory Size
Memory module size


| Size | Desktops | Percent |
|---|---|---|
| 8192 | 3 | 50% |
| 4096 | 2 | 33.33% |
| 16384 | 1 | 16.67% |
Memory Speed
Memory module speed


| Speed | Desktops | Percent |
|---|---|---|
| 3600 | 2 | 25% |
| 3266 | 1 | 12.5% |
| 3000 | 1 | 12.5% |
| 2933 | 1 | 12.5% |
| 2667 | 1 | 12.5% |
| 2133 | 1 | 12.5% |
| 1600 | 1 | 12.5% |
Printers & scanners
Printer Vendor
Printer device vendors
Zero info for selected period =(
Printer Model
Printer device models
Zero info for selected period =(
Scanner Vendor
Scanner device vendors
Zero info for selected period =(
Scanner Model
Scanner device models
Zero info for selected period =(
Camera
Camera Vendor
Camera device vendors


| Vendor | Desktops | Percent |
|---|---|---|
| Sunplus Innovation Technology | 1 | 50% |
| Chicony Electronics | 1 | 50% |
Camera Model
Camera device models


| Model | Desktops | Percent |
|---|---|---|
| Sunplus Full HD webcam | 1 | 50% |
| Chicony Front Camera | 1 | 50% |
Security
Fingerprint Vendor
Fingerprint sensor vendors
Zero info for selected period =(
Fingerprint Model
Fingerprint sensor models
Zero info for selected period =(
Chipcard Vendor
Chipcard module vendors

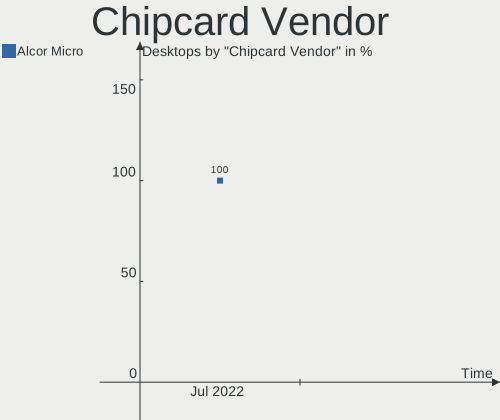
| Vendor | Desktops | Percent |
|---|---|---|
| Alcor Micro | 1 | 100% |
Chipcard Model
Chipcard module models


| Model | Desktops | Percent |
|---|---|---|
| Alcor Micro AU9540 Smartcard Reader | 1 | 100% |
Unsupported
Unsupported Devices
Total unsupported devices on board


| Total | Desktops | Percent |
|---|---|---|
| 0 | 4 | 57.14% |
| 1 | 2 | 28.57% |
| 2 | 1 | 14.29% |
Unsupported Device Types
Types of unsupported devices


| Type | Desktops | Percent |
|---|---|---|
| Net/wireless | 3 | 75% |
| Chipcard | 1 | 25% |