Kubuntu - Hardware Trends (Desktops)
A project to identify most popular hardware characteristics and track their change over time based on data collected by Linux users at https://Linux-Hardware.org.
Anyone can contribute to this report by the hw-probe tool:
sudo -E hw-probe -all -uploadThis report is for one last month. Overall report since the beginning of time: TestCoverage
Period: Jun, 2022.
Contents
System
OS
Installed operating systems


| Name | Desktops | Percent |
|---|---|---|
| Kubuntu 22.04 | 21 | 60% |
| Kubuntu 20.04 | 6 | 17.14% |
| Kubuntu 21.10 | 4 | 11.43% |
| Kubuntu 22.10 | 1 | 2.86% |
| Kubuntu 21.04 | 1 | 2.86% |
| Kubuntu 18.04 | 1 | 2.86% |
| Kubuntu 11 | 1 | 2.86% |
OS Family
OS without a version


| Name | Desktops | Percent |
|---|---|---|
| Kubuntu | 35 | 100% |
Kernel
Version of the Linux kernel


| Version | Desktops | Percent |
|---|---|---|
| 5.15.0-40-generic | 6 | 17.14% |
| 5.15.0-37-generic | 4 | 11.43% |
| 5.13.0-51-generic | 4 | 11.43% |
| 5.15.0-33-generic | 2 | 5.71% |
| 5.13.0-48-generic | 2 | 5.71% |
| 5.4.0-120-lowlatency | 1 | 2.86% |
| 5.4.0-120-generic | 1 | 2.86% |
| 5.4.0-117-generic | 1 | 2.86% |
| 5.18.4-xanmod1-x64v2 | 1 | 2.86% |
| 5.18.4-xanmod1 | 1 | 2.86% |
| 5.18.4-vitodoc | 1 | 2.86% |
| 5.17.14-xanmod1 | 1 | 2.86% |
| 5.17.0-12.1-liquorix-amd64 | 1 | 2.86% |
| 5.15.0-39-generic | 1 | 2.86% |
| 5.15.0-37-lowlatency | 1 | 2.86% |
| 5.15.0-35-lowlatency | 1 | 2.86% |
| 5.15.0-35-generic | 1 | 2.86% |
| 5.15.0-25-generic | 1 | 2.86% |
| 5.13.0-52-generic | 1 | 2.86% |
| 5.13.0-48-lowlatency | 1 | 2.86% |
| 5.13.0-46-generic | 1 | 2.86% |
| 5.11.0-49-generic | 1 | 2.86% |
Kernel Family
Linux kernel without a distro release


| Version | Desktops | Percent |
|---|---|---|
| 5.15.0 | 17 | 48.57% |
| 5.13.0 | 9 | 25.71% |
| 5.4.0 | 3 | 8.57% |
| 5.18.4 | 3 | 8.57% |
| 5.17.14 | 1 | 2.86% |
| 5.17.0 | 1 | 2.86% |
| 5.11.0 | 1 | 2.86% |
Kernel Major Ver.
Linux kernel major version


| Version | Desktops | Percent |
|---|---|---|
| 5.15 | 17 | 48.57% |
| 5.13 | 9 | 25.71% |
| 5.4 | 3 | 8.57% |
| 5.18 | 3 | 8.57% |
| 5.17 | 2 | 5.71% |
| 5.11 | 1 | 2.86% |
Arch
OS architecture (x86_64, i586, etc.)


| Name | Desktops | Percent |
|---|---|---|
| x86_64 | 35 | 100% |
DE
Desktop Environment


| Name | Desktops | Percent |
|---|---|---|
| KDE5 | 35 | 100% |
Display Server
X11 or Wayland


| Name | Desktops | Percent |
|---|---|---|
| X11 | 33 | 94.29% |
| Wayland | 2 | 5.71% |
Display Manager
SDDM, LightDM, etc.


| Name | Desktops | Percent |
|---|---|---|
| SDDM | 23 | 65.71% |
| Unknown | 6 | 17.14% |
| GDM3 | 3 | 8.57% |
| LightDM | 2 | 5.71% |
| GDM | 1 | 2.86% |
OS Lang
Language


| Lang | Desktops | Percent |
|---|---|---|
| en_US | 14 | 40% |
| en_GB | 5 | 14.29% |
| it_IT | 3 | 8.57% |
| ru_RU | 2 | 5.71% |
| es_AR | 2 | 5.71% |
| de_DE | 2 | 5.71% |
| zh_TW | 1 | 2.86% |
| pt_BR | 1 | 2.86% |
| pl_PL | 1 | 2.86% |
| en_ZA | 1 | 2.86% |
| en_NZ | 1 | 2.86% |
| en_IN | 1 | 2.86% |
| de_CH | 1 | 2.86% |
Boot Mode
EFI or BIOS


| Mode | Desktops | Percent |
|---|---|---|
| EFI | 19 | 54.29% |
| BIOS | 16 | 45.71% |
Filesystem
Type of filesystem


| Type | Desktops | Percent |
|---|---|---|
| Ext4 | 29 | 82.86% |
| Btrfs | 4 | 11.43% |
| Xfs | 1 | 2.86% |
| Overlay | 1 | 2.86% |
Part. scheme
Scheme of partitioning


| Type | Desktops | Percent |
|---|---|---|
| GPT | 18 | 51.43% |
| Unknown | 17 | 48.57% |
Dual Boot with Linux/BSD
Hosting more than one Linux/BSD


| Dual boot | Desktops | Percent |
|---|---|---|
| No | 30 | 85.71% |
| Yes | 5 | 14.29% |
Dual Boot (Win)
Hosting Linux and Windows


| Dual boot | Desktops | Percent |
|---|---|---|
| No | 20 | 57.14% |
| Yes | 15 | 42.86% |
Board
Vendor
Motherboard manufacturer


| Name | Desktops | Percent |
|---|---|---|
| ASUSTek Computer | 10 | 28.57% |
| Gigabyte Technology | 6 | 17.14% |
| MSI | 4 | 11.43% |
| ASRock | 4 | 11.43% |
| Dell | 3 | 8.57% |
| Hewlett-Packard | 2 | 5.71% |
| Apple | 2 | 5.71% |
| Intel | 1 | 2.86% |
| Huanan | 1 | 2.86% |
| AZW | 1 | 2.86% |
| ABIT | 1 | 2.86% |
Model
Motherboard model


| Name | Desktops | Percent |
|---|---|---|
| MSI MS-7D54 | 1 | 2.86% |
| MSI MS-7C37 | 1 | 2.86% |
| MSI MS-7B79 | 1 | 2.86% |
| MSI MS-7A78 | 1 | 2.86% |
| Intel X99 | 1 | 2.86% |
| Huanan X99-F8 GAMING V5.0 | 1 | 2.86% |
| HP xw8600 Workstation | 1 | 2.86% |
| HP Compaq dc5700 Small Form Factor | 1 | 2.86% |
| Gigabyte Z490 AORUS ELITE AC | 1 | 2.86% |
| Gigabyte Z270-HD3P | 1 | 2.86% |
| Gigabyte X570 AORUS PRO | 1 | 2.86% |
| Gigabyte GA-78LMT-USB3 6.0 | 1 | 2.86% |
| Gigabyte B450M DS3H | 1 | 2.86% |
| Gigabyte A320M-S2H V2 | 1 | 2.86% |
| Dell XPS 8300 | 1 | 2.86% |
| Dell OptiPlex 9020 | 1 | 2.86% |
| Dell OptiPlex 7070 | 1 | 2.86% |
| AZW Gemini J45 | 1 | 2.86% |
| ASUS WS X299 PRO | 1 | 2.86% |
| ASUS TUF Gaming X570-PLUS | 1 | 2.86% |
| ASUS TUF Gaming B560M-PLUS WIFI | 1 | 2.86% |
| ASUS ROG ZENITH EXTREME | 1 | 2.86% |
| ASUS ROG STRIX X570-E GAMING | 1 | 2.86% |
| ASUS ROG Maximus Z690 HERO | 1 | 2.86% |
| ASUS P5QC | 1 | 2.86% |
| ASUS M5A78L-M LE/USB3 | 1 | 2.86% |
| ASUS CROSSHAIR VI HERO | 1 | 2.86% |
| ASUS All Series | 1 | 2.86% |
| ASRock X570M Pro4 | 1 | 2.86% |
| ASRock T6010 | 1 | 2.86% |
| ASRock A320M Pro4 | 1 | 2.86% |
| ASRock 960GM-VGS3 FX | 1 | 2.86% |
| Apple MacPro6,1 | 1 | 2.86% |
| Apple MacPro5,1 | 1 | 2.86% |
| ABIT IP35 Pro | 1 | 2.86% |
Model Family
Motherboard model prefix


| Name | Desktops | Percent |
|---|---|---|
| ASUS ROG | 3 | 8.57% |
| Dell OptiPlex | 2 | 5.71% |
| ASUS TUF | 2 | 5.71% |
| MSI MS-7D54 | 1 | 2.86% |
| MSI MS-7C37 | 1 | 2.86% |
| MSI MS-7B79 | 1 | 2.86% |
| MSI MS-7A78 | 1 | 2.86% |
| Intel X99 | 1 | 2.86% |
| Huanan X99-F8 | 1 | 2.86% |
| HP xw8600 | 1 | 2.86% |
| HP Compaq | 1 | 2.86% |
| Gigabyte Z490 | 1 | 2.86% |
| Gigabyte Z270-HD3P | 1 | 2.86% |
| Gigabyte X570 | 1 | 2.86% |
| Gigabyte GA-78LMT-USB3 | 1 | 2.86% |
| Gigabyte B450M | 1 | 2.86% |
| Gigabyte A320M-S2H | 1 | 2.86% |
| Dell XPS | 1 | 2.86% |
| AZW Gemini | 1 | 2.86% |
| ASUS WS | 1 | 2.86% |
| ASUS P5QC | 1 | 2.86% |
| ASUS M5A78L-M | 1 | 2.86% |
| ASUS CROSSHAIR | 1 | 2.86% |
| ASUS All | 1 | 2.86% |
| ASRock X570M | 1 | 2.86% |
| ASRock T6010 | 1 | 2.86% |
| ASRock A320M | 1 | 2.86% |
| ASRock 960GM-VGS3 | 1 | 2.86% |
| Apple MacPro6 | 1 | 2.86% |
| Apple MacPro5 | 1 | 2.86% |
| ABIT IP35 | 1 | 2.86% |
MFG Year
Motherboard manufacture year


| Year | Desktops | Percent |
|---|---|---|
| 2019 | 11 | 31.43% |
| 2018 | 6 | 17.14% |
| 2021 | 3 | 8.57% |
| 2015 | 3 | 8.57% |
| 2008 | 3 | 8.57% |
| 2017 | 2 | 5.71% |
| 2020 | 1 | 2.86% |
| 2016 | 1 | 2.86% |
| 2014 | 1 | 2.86% |
| 2012 | 1 | 2.86% |
| 2011 | 1 | 2.86% |
| 2010 | 1 | 2.86% |
| 2006 | 1 | 2.86% |
Form Factor
Physical design of the computer


| Name | Desktops | Percent |
|---|---|---|
| Desktop | 35 | 100% |
Secure Boot
Enabled or disabled


| State | Desktops | Percent |
|---|---|---|
| Disabled | 35 | 100% |
Coreboot
Have coreboot on board


| Used | Desktops | Percent |
|---|---|---|
| No | 35 | 100% |
RAM Size
Total RAM memory


| Size in GB | Desktops | Percent |
|---|---|---|
| 16.01-24.0 | 13 | 37.14% |
| 32.01-64.0 | 10 | 28.57% |
| 64.01-256.0 | 4 | 11.43% |
| 8.01-16.0 | 4 | 11.43% |
| 4.01-8.0 | 2 | 5.71% |
| 3.01-4.0 | 1 | 2.86% |
| 24.01-32.0 | 1 | 2.86% |
RAM Used
Used RAM memory


| Used GB | Desktops | Percent |
|---|---|---|
| 1.01-2.0 | 10 | 28.57% |
| 2.01-3.0 | 9 | 25.71% |
| 4.01-8.0 | 7 | 20% |
| 3.01-4.0 | 4 | 11.43% |
| 8.01-16.0 | 3 | 8.57% |
| 16.01-24.0 | 1 | 2.86% |
| 0.51-1.0 | 1 | 2.86% |
Total Drives
Number of drives on board


| Drives | Desktops | Percent |
|---|---|---|
| 1 | 10 | 28.57% |
| 2 | 9 | 25.71% |
| 3 | 7 | 20% |
| 4 | 4 | 11.43% |
| 6 | 2 | 5.71% |
| 11 | 1 | 2.86% |
| 10 | 1 | 2.86% |
| 5 | 1 | 2.86% |
Has CD-ROM
Has CD-ROM on board


| Presented | Desktops | Percent |
|---|---|---|
| No | 23 | 65.71% |
| Yes | 12 | 34.29% |
Has Ethernet
Has Ethernet on board


| Presented | Desktops | Percent |
|---|---|---|
| Yes | 34 | 97.14% |
| No | 1 | 2.86% |
Has WiFi
Has WiFi module


| Presented | Desktops | Percent |
|---|---|---|
| Yes | 22 | 62.86% |
| No | 13 | 37.14% |
Has Bluetooth
Has Bluetooth module


| Presented | Desktops | Percent |
|---|---|---|
| No | 21 | 60% |
| Yes | 14 | 40% |
Location
Country
Geographic location (country)


| Country | Desktops | Percent |
|---|---|---|
| USA | 8 | 22.86% |
| UK | 4 | 11.43% |
| Russia | 3 | 8.57% |
| Italy | 3 | 8.57% |
| Germany | 3 | 8.57% |
| Switzerland | 2 | 5.71% |
| Poland | 2 | 5.71% |
| Brazil | 2 | 5.71% |
| Argentina | 2 | 5.71% |
| Taiwan | 1 | 2.86% |
| South Africa | 1 | 2.86% |
| Slovenia | 1 | 2.86% |
| New Zealand | 1 | 2.86% |
| Malta | 1 | 2.86% |
| India | 1 | 2.86% |
City
Geographic location (city)


| City | Desktops | Percent |
|---|---|---|
| Moscow | 2 | 5.71% |
| Wilmington | 1 | 2.86% |
| Waukee | 1 | 2.86% |
| Washington | 1 | 2.86% |
| Vrhnika | 1 | 2.86% |
| Ustron | 1 | 2.86% |
| Union City | 1 | 2.86% |
| Therwil | 1 | 2.86% |
| Tainan City | 1 | 2.86% |
| Sunbury-on-Thames | 1 | 2.86% |
| Steinhausen | 1 | 2.86% |
| Sliema | 1 | 2.86% |
| Sedziszow Malopolski | 1 | 2.86% |
| Rozzano | 1 | 2.86% |
| Redditch | 1 | 2.86% |
| Pretoria | 1 | 2.86% |
| Potenza | 1 | 2.86% |
| Mira | 1 | 2.86% |
| Krasnodar | 1 | 2.86% |
| Kolkata | 1 | 2.86% |
| Jellico | 1 | 2.86% |
| Itaborai | 1 | 2.86% |
| Hamburg | 1 | 2.86% |
| Goiânia | 1 | 2.86% |
| General Pacheco | 1 | 2.86% |
| Folsom | 1 | 2.86% |
| El Paso | 1 | 2.86% |
| Derby | 1 | 2.86% |
| Coeur d'Alene | 1 | 2.86% |
| Cloppenburg | 1 | 2.86% |
| Bradford | 1 | 2.86% |
| Berlin | 1 | 2.86% |
| Berisso | 1 | 2.86% |
| Auckland | 1 | 2.86% |
Drives
Drive Vendor
Hard drive vendors


| Vendor | Desktops | Drives | Percent |
|---|---|---|---|
| WDC | 17 | 32 | 23.29% |
| Samsung Electronics | 14 | 20 | 19.18% |
| Seagate | 10 | 20 | 13.7% |
| Kingston | 6 | 7 | 8.22% |
| Toshiba | 4 | 4 | 5.48% |
| Unknown | 3 | 3 | 4.11% |
| SanDisk | 3 | 6 | 4.11% |
| Crucial | 3 | 3 | 4.11% |
| JMicron Technology | 2 | 2 | 2.74% |
| Hitachi | 2 | 2 | 2.74% |
| XPG | 1 | 1 | 1.37% |
| Transcend | 1 | 1 | 1.37% |
| Silicon Motion | 1 | 1 | 1.37% |
| Phison | 1 | 1 | 1.37% |
| KingSpec | 1 | 1 | 1.37% |
| Hewlett-Packard | 1 | 1 | 1.37% |
| China | 1 | 1 | 1.37% |
| Apple | 1 | 1 | 1.37% |
| A-DATA Technology | 1 | 1 | 1.37% |
Drive Model
Hard drive models


| Model | Desktops | Percent |
|---|---|---|
| WDC WD10EZEX-22MFCA0 1TB | 2 | 2.22% |
| Seagate ST500LM012 HN-M500MBB 500GB | 2 | 2.22% |
| Samsung SSD 970 EVO 1TB | 2 | 2.22% |
| XPG NVMe SSD Drive 1024GB | 1 | 1.11% |
| WDC WDS500G2B0C-00PXH0 500GB | 1 | 1.11% |
| WDC WDS500G1X0E-00AFY0 500GB | 1 | 1.11% |
| WDC WDS240G2G0A-00JH30 240GB SSD | 1 | 1.11% |
| WDC WDS120G2G0A-00JH30 120GB SSD | 1 | 1.11% |
| WDC WDS100T2B0C-00PXH0 1TB | 1 | 1.11% |
| WDC WDS100T2B0B-00YS70 1TB SSD | 1 | 1.11% |
| WDC WD5000BEVT-00A0RT0 500GB | 1 | 1.11% |
| WDC WD5000AZLX-08K2TA0 500GB | 1 | 1.11% |
| WDC WD5000AAKX-753CA1 500GB | 1 | 1.11% |
| WDC WD40EZRZ-00GXCB0 4TB | 1 | 1.11% |
| WDC WD40EZRX-22SPEB0 4TB | 1 | 1.11% |
| WDC WD40EFRX-68N32N0 4TB | 1 | 1.11% |
| WDC WD3200AAKX-22ERMA0 320GB | 1 | 1.11% |
| WDC WD3200AAKX-00ERMA0 320GB | 1 | 1.11% |
| WDC WD30EZRZ-00Z5HB0 3TB | 1 | 1.11% |
| WDC WD30EZRX-00MMMB0 3TB | 1 | 1.11% |
| WDC WD20EARX-32PASB0 2TB | 1 | 1.11% |
| WDC WD1600BEVT-22ZCT0 160GB | 1 | 1.11% |
| WDC WD10EURX-63UY4Y0 1TB | 1 | 1.11% |
| WDC WD10EURX-63C57Y0 1TB | 1 | 1.11% |
| WDC WD1002FAEX-00Z3A0 1TB | 1 | 1.11% |
| Unknown Sabrent Disk Dev 240GB | 1 | 1.11% |
| Unknown MMC Card 196GB | 1 | 1.11% |
| Unknown 256GB PCS 2.5" S | 1 | 1.11% |
| Transcend TS256GSSD370S 256GB | 1 | 1.11% |
| Toshiba MK5076GSX 500GB | 1 | 1.11% |
| Toshiba KBG30ZMS128G 128GB NVMe SSD | 1 | 1.11% |
| Toshiba HDWD130 3TB | 1 | 1.11% |
| Toshiba A100 240GB SSD | 1 | 1.11% |
| Silicon Motion NVMe SSD Drive 512GB | 1 | 1.11% |
| Seagate ST8000DM004-2CX188 8TB | 1 | 1.11% |
| Seagate ST6000DM003-2CY186 6TB | 1 | 1.11% |
| Seagate ST500LT012-1DG142 500GB | 1 | 1.11% |
| Seagate ST5000DM000 4GB | 1 | 1.11% |
| Seagate ST4000DM004-2CV104 4TB | 1 | 1.11% |
| Seagate ST4000DM000 4GB | 1 | 1.11% |
| Seagate ST3500312CS 500GB | 1 | 1.11% |
| Seagate ST33000650SS 3TB | 1 | 1.11% |
| Seagate ST2000DX001-1NS164 2TB | 1 | 1.11% |
| Seagate ST2000DM008-2FR102 2TB | 1 | 1.11% |
| Seagate ST2000DM006-2DM164 2TB | 1 | 1.11% |
| Seagate ST2000DM001-1E61 2TB | 1 | 1.11% |
| Seagate ST1000DM003-1CH162 1TB | 1 | 1.11% |
| Seagate BUP Ultra 1TB | 1 | 1.11% |
| Seagate Backup+ Hub BK 8TB | 1 | 1.11% |
| SanDisk Ultra II 960GB SSD | 1 | 1.11% |
| SanDisk SSD PLUS 120GB | 1 | 1.11% |
| SanDisk NVMe SSD Drive 1TB | 1 | 1.11% |
| Samsung SSD 970 EVO Plus 500GB | 1 | 1.11% |
| Samsung SSD 970 EVO 250GB | 1 | 1.11% |
| Samsung SSD 870 QVO 1TB | 1 | 1.11% |
| Samsung SSD 860 QVO 1TB | 1 | 1.11% |
| Samsung SSD 860 EVO 500GB | 1 | 1.11% |
| Samsung SSD 860 EVO 4TB | 1 | 1.11% |
| Samsung SSD 860 EVO 2TB | 1 | 1.11% |
| Samsung SSD 860 EVO 250GB | 1 | 1.11% |
HDD Vendor
Hard disk drive vendors


| Vendor | Desktops | Drives | Percent |
|---|---|---|---|
| WDC | 14 | 26 | 42.42% |
| Seagate | 10 | 20 | 30.3% |
| Samsung Electronics | 3 | 3 | 9.09% |
| Toshiba | 2 | 2 | 6.06% |
| Hitachi | 2 | 2 | 6.06% |
| Unknown | 1 | 1 | 3.03% |
| JMicron Technology | 1 | 1 | 3.03% |
SSD Vendor
Solid state drive vendors


| Vendor | Desktops | Drives | Percent |
|---|---|---|---|
| Samsung Electronics | 7 | 10 | 25% |
| Kingston | 4 | 4 | 14.29% |
| WDC | 3 | 3 | 10.71% |
| Crucial | 3 | 3 | 10.71% |
| SanDisk | 2 | 5 | 7.14% |
| Unknown | 1 | 1 | 3.57% |
| Transcend | 1 | 1 | 3.57% |
| Toshiba | 1 | 1 | 3.57% |
| KingSpec | 1 | 1 | 3.57% |
| JMicron Technology | 1 | 1 | 3.57% |
| Hewlett-Packard | 1 | 1 | 3.57% |
| China | 1 | 1 | 3.57% |
| Apple | 1 | 1 | 3.57% |
| A-DATA Technology | 1 | 1 | 3.57% |
Drive Kind
HDD or SSD


| Kind | Desktops | Drives | Percent |
|---|---|---|---|
| SSD | 24 | 34 | 39.34% |
| HDD | 23 | 55 | 37.7% |
| NVMe | 13 | 18 | 21.31% |
| MMC | 1 | 1 | 1.64% |
Drive Connector
SATA, SAS, NVMe, etc.


| Type | Desktops | Drives | Percent |
|---|---|---|---|
| SATA | 32 | 81 | 60.38% |
| NVMe | 13 | 18 | 24.53% |
| SAS | 7 | 8 | 13.21% |
| MMC | 1 | 1 | 1.89% |
Drive Size
Size of hard drive


| Size in TB | Desktops | Drives | Percent |
|---|---|---|---|
| 0.01-0.5 | 26 | 40 | 47.27% |
| 0.51-1.0 | 10 | 17 | 18.18% |
| 1.01-2.0 | 8 | 10 | 14.55% |
| 3.01-4.0 | 5 | 13 | 9.09% |
| 2.01-3.0 | 4 | 4 | 7.27% |
| 4.01-10.0 | 2 | 5 | 3.64% |
Space Total
Amount of disk space available on the file system


| Size in GB | Desktops | Percent |
|---|---|---|
| More than 3000 | 10 | 28.57% |
| 501-1000 | 8 | 22.86% |
| 1001-2000 | 6 | 17.14% |
| 101-250 | 5 | 14.29% |
| 2001-3000 | 3 | 8.57% |
| 251-500 | 2 | 5.71% |
| 1-20 | 1 | 2.86% |
Space Used
Amount of used disk space


| Used GB | Desktops | Percent |
|---|---|---|
| 1-20 | 8 | 22.86% |
| 101-250 | 5 | 14.29% |
| 501-1000 | 5 | 14.29% |
| 1001-2000 | 4 | 11.43% |
| 251-500 | 3 | 8.57% |
| 21-50 | 3 | 8.57% |
| 51-100 | 3 | 8.57% |
| More than 3000 | 2 | 5.71% |
| 2001-3000 | 2 | 5.71% |
Malfunc. Drives
Drive models with a malfunction


| Model | Desktops | Drives | Percent |
|---|---|---|---|
| Seagate ST500LM012 HN-M500MBB 500GB | 1 | 1 | 20% |
| Seagate ST1000DM003-1CH162 1TB | 1 | 1 | 20% |
| Samsung Electronics SSD 970 EVO 1TB | 1 | 1 | 20% |
| Samsung Electronics HD103SI 1TB | 1 | 1 | 20% |
| Hitachi HDP725050GLA360 500GB | 1 | 1 | 20% |
Malfunc. Drive Vendor
Vendors of faulty drives


| Vendor | Desktops | Drives | Percent |
|---|---|---|---|
| Samsung Electronics | 2 | 2 | 50% |
| Seagate | 1 | 2 | 25% |
| Hitachi | 1 | 1 | 25% |
Malfunc. HDD Vendor
Vendors of faulty HDD drives


| Vendor | Desktops | Drives | Percent |
|---|---|---|---|
| Seagate | 1 | 2 | 33.33% |
| Samsung Electronics | 1 | 1 | 33.33% |
| Hitachi | 1 | 1 | 33.33% |
Malfunc. Drive Kind
Kinds of faulty drives

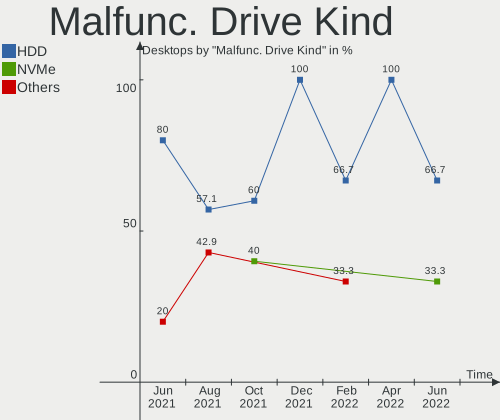
| Kind | Desktops | Drives | Percent |
|---|---|---|---|
| HDD | 2 | 4 | 66.67% |
| NVMe | 1 | 1 | 33.33% |
Failed Drives
Failed drive models
Zero info for selected period =(
Failed Drive Vendor
Failed drive vendors
Zero info for selected period =(
Drive Status
Number of failed and malfunc. drives


| Status | Desktops | Drives | Percent |
|---|---|---|---|
| Detected | 23 | 59 | 52.27% |
| Works | 18 | 44 | 40.91% |
| Malfunc | 3 | 5 | 6.82% |
Storage controller
Storage Vendor
Storage controller vendors


| Vendor | Desktops | Percent |
|---|---|---|
| Intel | 19 | 33.93% |
| AMD | 15 | 26.79% |
| Samsung Electronics | 5 | 8.93% |
| SanDisk | 3 | 5.36% |
| Kingston Technology Company | 3 | 5.36% |
| ASMedia Technology | 3 | 5.36% |
| Marvell Technology Group | 2 | 3.57% |
| Toshiba America Info Systems | 1 | 1.79% |
| Silicon Motion | 1 | 1.79% |
| Phison Electronics | 1 | 1.79% |
| JMicron Technology | 1 | 1.79% |
| Broadcom / LSI | 1 | 1.79% |
| ADATA Technology | 1 | 1.79% |
Storage Model
Storage controller models


| Model | Desktops | Percent |
|---|---|---|
| AMD FCH SATA Controller [AHCI mode] | 12 | 16.9% |
| Samsung NVMe SSD Controller SM981/PM981/PM983 | 4 | 5.63% |
| Intel C610/X99 series chipset 6-Port SATA Controller [AHCI mode] | 3 | 4.23% |
| Intel 200 Series PCH SATA controller [AHCI mode] | 3 | 4.23% |
| AMD SB7x0/SB8x0/SB9x0 IDE Controller | 3 | 4.23% |
| SanDisk WD Blue SN550 NVMe SSD | 2 | 2.82% |
| Kingston Company A2000 NVMe SSD | 2 | 2.82% |
| Intel SATA Controller [RAID mode] | 2 | 2.82% |
| Intel C610/X99 series chipset sSATA Controller [AHCI mode] | 2 | 2.82% |
| Intel 82801JI (ICH10 Family) SATA AHCI Controller | 2 | 2.82% |
| ASMedia ASM1062 Serial ATA Controller | 2 | 2.82% |
| AMD SB7x0/SB8x0/SB9x0 SATA Controller [IDE mode] | 2 | 2.82% |
| AMD 400 Series Chipset SATA Controller | 2 | 2.82% |
| Toshiba America Info Systems Toshiba America Info Non-Volatile memory controller | 1 | 1.41% |
| Silicon Motion SM2263EN/SM2263XT SSD Controller | 1 | 1.41% |
| SanDisk WD PC SN810 / Black SN850 NVMe SSD | 1 | 1.41% |
| Samsung Apple PCIe SSD | 1 | 1.41% |
| Phison E16 PCIe4 NVMe Controller | 1 | 1.41% |
| Marvell Group 88SE9230 PCIe 2.0 x2 4-port SATA 6 Gb/s RAID Controller | 1 | 1.41% |
| Marvell Group 88SE9172 SATA 6Gb/s Controller | 1 | 1.41% |
| Kingston Company Company Non-Volatile memory controller | 1 | 1.41% |
| JMicron JMB363 SATA/IDE Controller | 1 | 1.41% |
| Intel Volume Management Device NVMe RAID Controller | 1 | 1.41% |
| Intel Comet Lake SATA AHCI Controller | 1 | 1.41% |
| Intel Celeron N3350/Pentium N4200/Atom E3900 Series SATA AHCI Controller | 1 | 1.41% |
| Intel Alder Lake-S PCH SATA Controller [AHCI Mode] | 1 | 1.41% |
| Intel 82801IR/IO/IH (ICH9R/DO/DH) 4 port SATA Controller [IDE mode] | 1 | 1.41% |
| Intel 82801I (ICH9 Family) 2 port SATA Controller [IDE mode] | 1 | 1.41% |
| Intel 82801HR/HO/HH (ICH8R/DO/DH) 2 port SATA Controller [IDE mode] | 1 | 1.41% |
| Intel 82801H (ICH8 Family) 4 port SATA Controller [IDE mode] | 1 | 1.41% |
| Intel 8 Series/C220 Series Chipset Family 6-port SATA Controller 1 [AHCI mode] | 1 | 1.41% |
| Intel 631xESB/632xESB/3100 Chipset SATA IDE Controller | 1 | 1.41% |
| Intel 631xESB/632xESB IDE Controller | 1 | 1.41% |
| Intel 6 Series/C200 Series Chipset Family 6 port Desktop SATA AHCI Controller | 1 | 1.41% |
| Intel 500 Series Chipset Family SATA AHCI Controller | 1 | 1.41% |
| Broadcom / LSI SAS1068 PCI-X Fusion-MPT SAS | 1 | 1.41% |
| ASMedia ASM1166 Serial ATA Controller | 1 | 1.41% |
| AMD X399 Series Chipset SATA Controller | 1 | 1.41% |
| AMD X370 Series Chipset SATA Controller | 1 | 1.41% |
| AMD SB7x0/SB8x0/SB9x0 SATA Controller [AHCI mode] | 1 | 1.41% |
| AMD FCH SATA Controller D | 1 | 1.41% |
| AMD 300 Series Chipset SATA Controller | 1 | 1.41% |
| ADATA XPG SX8200 Pro PCIe Gen3x4 M.2 2280 Solid State Drive | 1 | 1.41% |
Storage Kind
Kind of storage controller (IDE, SATA, NVMe, SAS, ...)


| Kind | Desktops | Percent |
|---|---|---|
| SATA | 30 | 57.69% |
| NVMe | 12 | 23.08% |
| IDE | 6 | 11.54% |
| RAID | 3 | 5.77% |
| SCSI | 1 | 1.92% |
Processor
CPU Vendor
Processor vendors


| Vendor | Desktops | Percent |
|---|---|---|
| Intel | 20 | 57.14% |
| AMD | 15 | 42.86% |
CPU Model
Processor models


| Model | Desktops | Percent |
|---|---|---|
| AMD Ryzen 9 3900X 12-Core Processor | 3 | 8.57% |
| AMD Ryzen 9 5950X 16-Core Processor | 2 | 5.71% |
| Intel Xeon CPU X5690 @ 3.47GHz | 1 | 2.86% |
| Intel Xeon CPU X5450 @ 3.00GHz | 1 | 2.86% |
| Intel Xeon CPU E5-4627 v4 @ 2.60GHz | 1 | 2.86% |
| Intel Xeon CPU E5-2650 v3 @ 2.30GHz | 1 | 2.86% |
| Intel Xeon CPU E5-1620 v2 @ 3.70GHz | 1 | 2.86% |
| Intel Pentium D CPU 3.40GHz | 1 | 2.86% |
| Intel Pentium CPU J4205 @ 1.50GHz | 1 | 2.86% |
| Intel Core i9-9900 CPU @ 3.10GHz | 1 | 2.86% |
| Intel Core i9-10980XE CPU @ 3.00GHz | 1 | 2.86% |
| Intel Core i7-7700K CPU @ 4.20GHz | 1 | 2.86% |
| Intel Core i7-5820K CPU @ 3.30GHz | 1 | 2.86% |
| Intel Core i7-4770S CPU @ 3.10GHz | 1 | 2.86% |
| Intel Core i7-10700 CPU @ 2.90GHz | 1 | 2.86% |
| Intel Core i5-7500 CPU @ 3.40GHz | 1 | 2.86% |
| Intel Core i5-2320 CPU @ 3.00GHz | 1 | 2.86% |
| Intel Core i3-4130 CPU @ 3.40GHz | 1 | 2.86% |
| Intel Core 2 Quad CPU Q9550 @ 2.83GHz | 1 | 2.86% |
| Intel Core 2 Duo CPU E8400 @ 3.00GHz | 1 | 2.86% |
| Intel 12th Gen Core i7-12700K | 1 | 2.86% |
| Intel 11th Gen Core i5-11400 @ 2.60GHz | 1 | 2.86% |
| AMD Sempron 145 Processor | 1 | 2.86% |
| AMD Ryzen Threadripper 1950X 16-Core Processor | 1 | 2.86% |
| AMD Ryzen 7 2700 Eight-Core Processor | 1 | 2.86% |
| AMD Ryzen 7 1700X Eight-Core Processor | 1 | 2.86% |
| AMD Ryzen 5 5600X 6-Core Processor | 1 | 2.86% |
| AMD Ryzen 5 5500 | 1 | 2.86% |
| AMD Ryzen 5 3400G with Radeon Vega Graphics | 1 | 2.86% |
| AMD Ryzen 3 3200G with Radeon Vega Graphics | 1 | 2.86% |
| AMD FX-8350 Eight-Core Processor | 1 | 2.86% |
| AMD FX-8320 Eight-Core Processor | 1 | 2.86% |
CPU Model Family
Processor model prefix


| Model | Desktops | Percent |
|---|---|---|
| Intel Xeon | 5 | 14.29% |
| AMD Ryzen 9 | 5 | 14.29% |
| Intel Core i7 | 4 | 11.43% |
| AMD Ryzen 5 | 3 | 8.57% |
| Other | 2 | 5.71% |
| Intel Core i9 | 2 | 5.71% |
| Intel Core i5 | 2 | 5.71% |
| AMD Ryzen 7 | 2 | 5.71% |
| AMD FX | 2 | 5.71% |
| Intel Pentium D | 1 | 2.86% |
| Intel Pentium | 1 | 2.86% |
| Intel Core i3 | 1 | 2.86% |
| Intel Core 2 Quad | 1 | 2.86% |
| Intel Core 2 Duo | 1 | 2.86% |
| AMD Sempron | 1 | 2.86% |
| AMD Ryzen Threadripper | 1 | 2.86% |
| AMD Ryzen 3 | 1 | 2.86% |
CPU Cores
Number of processor cores


| Number | Desktops | Percent |
|---|---|---|
| 4 | 11 | 31.43% |
| 8 | 6 | 17.14% |
| 12 | 4 | 11.43% |
| 6 | 4 | 11.43% |
| 16 | 3 | 8.57% |
| 2 | 3 | 8.57% |
| 20 | 1 | 2.86% |
| 18 | 1 | 2.86% |
| 10 | 1 | 2.86% |
| 1 | 1 | 2.86% |
CPU Sockets
Number of sockets


| Number | Desktops | Percent |
|---|---|---|
| 1 | 32 | 91.43% |
| 2 | 3 | 8.57% |
CPU Threads
Threads per core (Hyper-Threading)


| Number | Desktops | Percent |
|---|---|---|
| 2 | 25 | 71.43% |
| 1 | 10 | 28.57% |
CPU Op-Modes
CPU Operation Modes (32-bit, 64-bit)


| Op mode | Desktops | Percent |
|---|---|---|
| 32-bit, 64-bit | 35 | 100% |
CPU Microcode
Microcode number


| Number | Desktops | Percent |
|---|---|---|
| Unknown | 12 | 34.29% |
| 0x906e9 | 2 | 5.71% |
| 0x0a201205 | 2 | 5.71% |
| 0x08701021 | 2 | 5.71% |
| 0x08001137 | 2 | 5.71% |
| 0xa0671 | 1 | 2.86% |
| 0xa0655 | 1 | 2.86% |
| 0x906ed | 1 | 2.86% |
| 0x90672 | 1 | 2.86% |
| 0x50657 | 1 | 2.86% |
| 0x406f1 | 1 | 2.86% |
| 0x306f2 | 1 | 2.86% |
| 0x306e4 | 1 | 2.86% |
| 0x1067a | 1 | 2.86% |
| 0x10676 | 1 | 2.86% |
| 0x0a50000c | 1 | 2.86% |
| 0x08701013 | 1 | 2.86% |
| 0x0800820d | 1 | 2.86% |
| 0x06000852 | 1 | 2.86% |
| 0x010000c8 | 1 | 2.86% |
CPU Microarch
Microarchitecture


| Name | Desktops | Percent |
|---|---|---|
| Zen 3 | 4 | 11.43% |
| Haswell | 4 | 11.43% |
| Zen+ | 3 | 8.57% |
| Zen 2 | 3 | 8.57% |
| Penryn | 3 | 8.57% |
| KabyLake | 3 | 8.57% |
| Zen | 2 | 5.71% |
| Piledriver | 2 | 5.71% |
| Westmere | 1 | 2.86% |
| Skylake | 1 | 2.86% |
| SandyBridge | 1 | 2.86% |
| NetBurst | 1 | 2.86% |
| K10 | 1 | 2.86% |
| IvyBridge | 1 | 2.86% |
| Icelake | 1 | 2.86% |
| Goldmont | 1 | 2.86% |
| CometLake | 1 | 2.86% |
| Broadwell | 1 | 2.86% |
| Alderlake Hybrid | 1 | 2.86% |
Graphics
GPU Vendor
Vendors of graphics cards


| Vendor | Desktops | Percent |
|---|---|---|
| Nvidia | 19 | 52.78% |
| AMD | 11 | 30.56% |
| Intel | 6 | 16.67% |
GPU Model
Graphics card models


| Model | Desktops | Percent |
|---|---|---|
| Nvidia TU104 [GeForce RTX 2080 SUPER] | 2 | 5.56% |
| AMD Tahiti XT [Radeon HD 7970/8970 OEM / R9 280X] | 2 | 5.56% |
| AMD Picasso/Raven 2 [Radeon Vega Series / Radeon Vega Mobile Series] | 2 | 5.56% |
| AMD Ellesmere [Radeon RX 470/480/570/570X/580/580X/590] | 2 | 5.56% |
| Nvidia TU117 [GeForce GTX 1650] | 1 | 2.78% |
| Nvidia TU116 [GeForce GTX 1660 SUPER] | 1 | 2.78% |
| Nvidia TU116 [GeForce GTX 1650 SUPER] | 1 | 2.78% |
| Nvidia TU106 [GeForce RTX 2060 SUPER] | 1 | 2.78% |
| Nvidia TU102 [GeForce RTX 2080 Ti Rev. A] | 1 | 2.78% |
| Nvidia GT218 [GeForce 210] | 1 | 2.78% |
| Nvidia GT200GL [Quadro FX 5800] | 1 | 2.78% |
| Nvidia GP108 [GeForce GT 1030] | 1 | 2.78% |
| Nvidia GP107 [GeForce GTX 1050 Ti] | 1 | 2.78% |
| Nvidia GP106GL [Quadro P2000] | 1 | 2.78% |
| Nvidia GP106 [GeForce GTX 1060 6GB] | 1 | 2.78% |
| Nvidia GP106 [GeForce GTX 1060 3GB] | 1 | 2.78% |
| Nvidia GP104 [GeForce GTX 1070] | 1 | 2.78% |
| Nvidia GK107 [GeForce GTX 650] | 1 | 2.78% |
| Nvidia GK106GL [Quadro K4000] | 1 | 2.78% |
| Nvidia GF108 [GeForce GT 730] | 1 | 2.78% |
| Nvidia G92 [GeForce 9800 GT] | 1 | 2.78% |
| Intel Xeon E3-1200 v3/4th Gen Core Processor Integrated Graphics Controller | 1 | 2.78% |
| Intel RocketLake-S GT1 [UHD Graphics 730] | 1 | 2.78% |
| Intel CoffeeLake-S GT2 [UHD Graphics 630] | 1 | 2.78% |
| Intel Celeron N3350/Pentium N4200/Atom E3900 Series Integrated Graphics Controller | 1 | 2.78% |
| Intel 82Q963/Q965 Integrated Graphics Controller | 1 | 2.78% |
| Intel 4th Generation Core Processor Family Integrated Graphics Controller | 1 | 2.78% |
| AMD RS780L [Radeon 3000] | 1 | 2.78% |
| AMD Navi 14 [Radeon RX 5500/5500M / Pro 5500M] | 1 | 2.78% |
| AMD Lexa PRO [Radeon 540/540X/550/550X / RX 540X/550/550X] | 1 | 2.78% |
| AMD Ellesmere [Radeon Pro WX 5100] | 1 | 2.78% |
| AMD Cedar [Radeon HD 5000/6000/7350/8350 Series] | 1 | 2.78% |
GPU Combo
Combinations of graphics cards


| Name | Desktops | Percent |
|---|---|---|
| 1 x Nvidia | 19 | 54.29% |
| 1 x AMD | 9 | 25.71% |
| 1 x Intel | 5 | 14.29% |
| 2 x AMD | 1 | 2.86% |
| Intel + AMD | 1 | 2.86% |
GPU Driver
Free vs proprietary


| Driver | Desktops | Percent |
|---|---|---|
| Free | 22 | 62.86% |
| Proprietary | 13 | 37.14% |
GPU Memory
Total video memory


| Size in GB | Desktops | Percent |
|---|---|---|
| Unknown | 13 | 37.14% |
| 7.01-8.0 | 5 | 14.29% |
| 3.01-4.0 | 5 | 14.29% |
| 0.51-1.0 | 4 | 11.43% |
| 5.01-6.0 | 3 | 8.57% |
| 2.01-3.0 | 2 | 5.71% |
| 4.01-5.0 | 1 | 2.86% |
| 1.01-2.0 | 1 | 2.86% |
| 8.01-16.0 | 1 | 2.86% |
Monitor
Monitor Vendor
Monitor vendors


| Vendor | Desktops | Percent |
|---|---|---|
| Samsung Electronics | 8 | 17.39% |
| Dell | 7 | 15.22% |
| AOC | 5 | 10.87% |
| Sony | 4 | 8.7% |
| Goldstar | 4 | 8.7% |
| Philips | 3 | 6.52% |
| Hewlett-Packard | 3 | 6.52% |
| BenQ | 3 | 6.52% |
| Tatung | 1 | 2.17% |
| STD | 1 | 2.17% |
| Skyworth | 1 | 2.17% |
| RTK | 1 | 2.17% |
| NEC Computers | 1 | 2.17% |
| Iiyama | 1 | 2.17% |
| ASUSTek Computer | 1 | 2.17% |
| Ancor Communications | 1 | 2.17% |
| Acer | 1 | 2.17% |
Monitor Model
Monitor models


| Model | Desktops | Percent |
|---|---|---|
| Dell P2719H DEL4184 1920x1080 598x336mm 27.0-inch | 2 | 4.08% |
| BenQ GL2450H BNQ78A7 1920x1080 531x298mm 24.0-inch | 2 | 4.08% |
| Tatung V22A100 TAT1600 1360x768 480x270mm 21.7-inch | 1 | 2.04% |
| STD LED STD0001 2560x1440 330x220mm 15.6-inch | 1 | 2.04% |
| Sony TV SNYEE01 1920x1080 | 1 | 2.04% |
| Sony TV SNYC901 1920x1080 | 1 | 2.04% |
| Sony TV SNY4602 1360x768 | 1 | 2.04% |
| Sony TV *02 SNY9403 1920x1080 1218x685mm 55.0-inch | 1 | 2.04% |
| Skyworth SII SPRT RPT SII9575 1920x1080 698x392mm 31.5-inch | 1 | 2.04% |
| Samsung Electronics U28D590 SAM0B81 3840x2160 608x345mm 27.5-inch | 1 | 2.04% |
| Samsung Electronics U28D590 SAM0B80 3840x2160 607x345mm 27.5-inch | 1 | 2.04% |
| Samsung Electronics SyncMaster SAM02D0 1280x1024 376x301mm 19.0-inch | 1 | 2.04% |
| Samsung Electronics SyncMaster SAM0225 1440x900 410x257mm 19.1-inch | 1 | 2.04% |
| Samsung Electronics SyncMaster SAM01DA 1280x1024 376x301mm 19.0-inch | 1 | 2.04% |
| Samsung Electronics SMS24A450 SAM083A 1920x1200 518x324mm 24.1-inch | 1 | 2.04% |
| Samsung Electronics SM2333TN SAM06FC 1920x1080 477x268mm 21.5-inch | 1 | 2.04% |
| Samsung Electronics S27B350 SAM08DC 1920x1080 598x336mm 27.0-inch | 1 | 2.04% |
| Samsung Electronics LCD Monitor SAM0A74 1280x720 949x543mm 43.0-inch | 1 | 2.04% |
| Samsung Electronics LCD Monitor LC27T55 1920x1080 | 1 | 2.04% |
| RTK LCD Monitor RTK1D1A 1920x1080 1020x570mm 46.0-inch | 1 | 2.04% |
| Philips PHL 246V5 PHLC0C5 1920x1080 531x299mm 24.0-inch | 1 | 2.04% |
| Philips PHL 242V8 PHLC219 1920x1080 527x296mm 23.8-inch | 1 | 2.04% |
| Philips FTV PHL01EA 1920x1080 1440x810mm 65.0-inch | 1 | 2.04% |
| NEC Computers EA275UHD NEC2BAF 3840x2160 597x336mm 27.0-inch | 1 | 2.04% |
| Iiyama PL2409HD IVM560C 1920x1080 521x293mm 23.5-inch | 1 | 2.04% |
| Hewlett-Packard Z27 HPN3536 3840x2160 597x336mm 27.0-inch | 1 | 2.04% |
| Hewlett-Packard LA2405 HWP284B 1920x1200 518x324mm 24.1-inch | 1 | 2.04% |
| Hewlett-Packard 22y HPN3503 1920x1080 477x268mm 21.5-inch | 1 | 2.04% |
| Goldstar ULTRAWIDE GSM5AE2 3440x1440 800x335mm 34.1-inch | 1 | 2.04% |
| Goldstar ULTRAWIDE GSM59F1 2560x1080 673x284mm 28.8-inch | 1 | 2.04% |
| Goldstar E2351 GSM5872 1920x1080 510x290mm 23.1-inch | 1 | 2.04% |
| Goldstar 32 FHD GSM7700 1920x1080 698x392mm 31.5-inch | 1 | 2.04% |
| Dell U3415W DELA0AA 3440x1440 800x330mm 34.1-inch | 1 | 2.04% |
| Dell U2412M DELA07B 1920x1200 518x324mm 24.1-inch | 1 | 2.04% |
| Dell P2714T DEL40A6 1920x1080 600x340mm 27.2-inch | 1 | 2.04% |
| Dell LCD Monitor P2314H 3840x1080 | 1 | 2.04% |
| Dell LCD Monitor P2314H | 1 | 2.04% |
| Dell D1918H DEL2005 1366x768 410x230mm 18.5-inch | 1 | 2.04% |
| BenQ XL2420TE BNQ7F26 1920x1080 531x298mm 24.0-inch | 1 | 2.04% |
| ASUSTek Computer VG24V AUS2420 1920x1080 521x293mm 23.5-inch | 1 | 2.04% |
| AOC 27V2G5 AOC2702 1920x1080 598x336mm 27.0-inch | 1 | 2.04% |
| AOC 2475W AOC2475 1920x1080 521x293mm 23.5-inch | 1 | 2.04% |
| AOC 2270W AOC2270 1920x1080 480x270mm 21.7-inch | 1 | 2.04% |
| AOC 2269W AOC2269 1920x1080 477x268mm 21.5-inch | 1 | 2.04% |
| AOC 2070W AOC2070 1600x900 434x236mm 19.4-inch | 1 | 2.04% |
| Ancor Communications LCD Monitor ASUS PB298 2560x1080 | 1 | 2.04% |
| Acer G226HQL ACR0346 1920x1080 477x268mm 21.5-inch | 1 | 2.04% |
Monitor Resolution
Monitor screen resolution


| Resolution | Desktops | Percent |
|---|---|---|
| 1920x1080 (FHD) | 22 | 50% |
| 3840x2160 (4K) | 5 | 11.36% |
| 3440x1440 | 2 | 4.55% |
| 2560x1080 | 2 | 4.55% |
| 1920x1200 (WUXGA) | 2 | 4.55% |
| 1360x768 | 2 | 4.55% |
| 1280x1024 (SXGA) | 2 | 4.55% |
| 3840x1080 | 1 | 2.27% |
| 2560x1440 (QHD) | 1 | 2.27% |
| 1600x900 (HD+) | 1 | 2.27% |
| 1440x900 (WXGA+) | 1 | 2.27% |
| 1366x768 (WXGA) | 1 | 2.27% |
| 1280x720 (HD) | 1 | 2.27% |
| Unknown | 1 | 2.27% |
Monitor Diagonal
Diagonal size in inches


| Inches | Desktops | Percent |
|---|---|---|
| 27 | 7 | 15.56% |
| 24 | 7 | 15.56% |
| 23 | 6 | 13.33% |
| 21 | 5 | 11.11% |
| 19 | 4 | 8.89% |
| 72 | 3 | 6.67% |
| 34 | 3 | 6.67% |
| Unknown | 3 | 6.67% |
| 65 | 1 | 2.22% |
| 57 | 1 | 2.22% |
| 55 | 1 | 2.22% |
| 46 | 1 | 2.22% |
| 43 | 1 | 2.22% |
| 31 | 1 | 2.22% |
| 18 | 1 | 2.22% |
Monitor Width
Physical width


| Width in mm | Desktops | Percent |
|---|---|---|
| 501-600 | 16 | 38.1% |
| 401-500 | 8 | 19.05% |
| 1001-1500 | 4 | 9.52% |
| 701-800 | 3 | 7.14% |
| 1501-2000 | 3 | 7.14% |
| Unknown | 3 | 7.14% |
| 601-700 | 2 | 4.76% |
| 351-400 | 2 | 4.76% |
| 901-1000 | 1 | 2.38% |
Aspect Ratio
Proportional relationship between the width and the height


| Ratio | Desktops | Percent |
|---|---|---|
| 16/9 | 24 | 68.57% |
| 21/9 | 3 | 8.57% |
| 16/10 | 3 | 8.57% |
| Unknown | 3 | 8.57% |
| 5/4 | 2 | 5.71% |
Monitor Area
Area in inch²


| Area in inch² | Desktops | Percent |
|---|---|---|
| 201-250 | 10 | 24.39% |
| 301-350 | 7 | 17.07% |
| 151-200 | 7 | 17.07% |
| More than 1000 | 5 | 12.2% |
| 351-500 | 4 | 9.76% |
| Unknown | 3 | 7.32% |
| 251-300 | 2 | 4.88% |
| 501-1000 | 2 | 4.88% |
| 141-150 | 1 | 2.44% |
Pixel Density
Pixels per inch


| Density | Desktops | Percent |
|---|---|---|
| 51-100 | 21 | 53.85% |
| 1-50 | 6 | 15.38% |
| 101-120 | 6 | 15.38% |
| Unknown | 3 | 7.69% |
| 161-240 | 2 | 5.13% |
| 121-160 | 1 | 2.56% |
Multiple Monitors
Total monitors connected


| Total | Desktops | Percent |
|---|---|---|
| 1 | 20 | 57.14% |
| 2 | 13 | 37.14% |
| 3 | 2 | 5.71% |
Network
Net Controller Vendor
Controller vendors


| Vendor | Desktops | Percent |
|---|---|---|
| Realtek Semiconductor | 21 | 33.33% |
| Intel | 17 | 26.98% |
| Qualcomm Atheros | 4 | 6.35% |
| Broadcom | 4 | 6.35% |
| Qualcomm Atheros Communications | 3 | 4.76% |
| Broadcom Limited | 2 | 3.17% |
| Aquantia | 2 | 3.17% |
| Wilocity | 1 | 1.59% |
| TP-Link | 1 | 1.59% |
| Ralink Technology | 1 | 1.59% |
| Micro Star International | 1 | 1.59% |
| MediaTek | 1 | 1.59% |
| Linksys | 1 | 1.59% |
| Edimax Technology | 1 | 1.59% |
| D-Link | 1 | 1.59% |
| ASUSTek Computer | 1 | 1.59% |
| ASIX Electronics | 1 | 1.59% |
Net Controller Model
Controller models


| Model | Desktops | Percent |
|---|---|---|
| Realtek RTL8111/8168/8411 PCI Express Gigabit Ethernet Controller | 12 | 17.39% |
| Intel I211 Gigabit Network Connection | 5 | 7.25% |
| Realtek RTL8125 2.5GbE Controller | 4 | 5.8% |
| Qualcomm Atheros AR9271 802.11n | 3 | 4.35% |
| Intel Wireless-AC 9260 | 2 | 2.9% |
| Aquantia AQC107 NBase-T/IEEE 802.3bz Ethernet Controller [AQtion] | 2 | 2.9% |
| Wilocity Wil6200 802.11ad Wireless Network Adapter | 1 | 1.45% |
| TP-Link Archer T9UH v1 [Realtek RTL8814AU] | 1 | 1.45% |
| Realtek RTL8812AU 802.11a/b/g/n/ac 2T2R DB WLAN Adapter | 1 | 1.45% |
| Realtek RTL8192EU 802.11b/g/n WLAN Adapter | 1 | 1.45% |
| Realtek RTL8169 PCI Gigabit Ethernet Controller | 1 | 1.45% |
| Realtek RTL8153 Gigabit Ethernet Adapter | 1 | 1.45% |
| Realtek RTL810xE PCI Express Fast Ethernet controller | 1 | 1.45% |
| Realtek RTL-8110SC/8169SC Gigabit Ethernet | 1 | 1.45% |
| Ralink RT2870/RT3070 Wireless Adapter | 1 | 1.45% |
| Qualcomm Atheros QCA6174 802.11ac Wireless Network Adapter | 1 | 1.45% |
| Qualcomm Atheros Killer E2500 Gigabit Ethernet Controller | 1 | 1.45% |
| Qualcomm Atheros AR9287 Wireless Network Adapter (PCI-Express) | 1 | 1.45% |
| Qualcomm Atheros AR8121/AR8113/AR8114 Gigabit or Fast Ethernet | 1 | 1.45% |
| Micro Star International MS-3871 802.11bgn Wireless Module [Ralink RT8070] | 1 | 1.45% |
| MediaTek TECNO SPARK 3 | 1 | 1.45% |
| Linksys WUSB6100M 802.11a/b/g/n/ac Wireless Adapter | 1 | 1.45% |
| Intel Wireless 3165 | 1 | 1.45% |
| Intel Wi-Fi 6 AX210/AX211/AX411 160MHz | 1 | 1.45% |
| Intel Wi-Fi 6 AX200 | 1 | 1.45% |
| Intel Tiger Lake PCH CNVi WiFi | 1 | 1.45% |
| Intel I210 Gigabit Network Connection | 1 | 1.45% |
| Intel Ethernet Controller I225-V | 1 | 1.45% |
| Intel Ethernet Connection I217-LM | 1 | 1.45% |
| Intel Ethernet Connection (7) I219-LM | 1 | 1.45% |
| Intel Ethernet Connection (2) I219-V | 1 | 1.45% |
| Intel Ethernet Connection (2) I218-V | 1 | 1.45% |
| Intel Comet Lake PCH CNVi WiFi | 1 | 1.45% |
| Intel 82574L Gigabit Network Connection | 1 | 1.45% |
| Intel 82571EB/82571GB Gigabit Ethernet Controller D0/D1 (copper applications) | 1 | 1.45% |
| Edimax EW-7811Un 802.11n Wireless Adapter [Realtek RTL8188CUS] | 1 | 1.45% |
| D-Link DWA-131 Wireless N Nano Adapter (Rev. E1) [Realtek RTL8192EU] | 1 | 1.45% |
| Broadcom NetXtreme BCM57762 Gigabit Ethernet PCIe | 1 | 1.45% |
| Broadcom NetXtreme BCM5755 Gigabit Ethernet PCI Express | 1 | 1.45% |
| Broadcom NetLink BCM57788 Gigabit Ethernet PCIe | 1 | 1.45% |
| Broadcom Limited NetXtreme BCM5755 Gigabit Ethernet PCI Express | 1 | 1.45% |
| Broadcom Limited BCM4360 802.11ac Wireless Network Adapter | 1 | 1.45% |
| Broadcom BCM4360 802.11ac Wireless Network Adapter | 1 | 1.45% |
| Broadcom BCM43224 802.11a/b/g/n | 1 | 1.45% |
| Broadcom BCM4313 802.11bgn Wireless Network Adapter | 1 | 1.45% |
| ASUS USB-N13 802.11n Network Adapter (rev. B1) [Realtek RTL8192CU] | 1 | 1.45% |
| ASIX AX88179 Gigabit Ethernet | 1 | 1.45% |
Wireless Vendor
Wireless vendors


| Vendor | Desktops | Percent |
|---|---|---|
| Intel | 6 | 24% |
| Qualcomm Atheros Communications | 3 | 12% |
| Broadcom | 3 | 12% |
| Realtek Semiconductor | 2 | 8% |
| Qualcomm Atheros | 2 | 8% |
| Wilocity | 1 | 4% |
| TP-Link | 1 | 4% |
| Ralink Technology | 1 | 4% |
| Micro Star International | 1 | 4% |
| Linksys | 1 | 4% |
| Edimax Technology | 1 | 4% |
| D-Link | 1 | 4% |
| Broadcom Limited | 1 | 4% |
| ASUSTek Computer | 1 | 4% |
Wireless Model
Wireless models


| Model | Desktops | Percent |
|---|---|---|
| Qualcomm Atheros AR9271 802.11n | 3 | 11.54% |
| Intel Wireless-AC 9260 | 2 | 7.69% |
| Wilocity Wil6200 802.11ad Wireless Network Adapter | 1 | 3.85% |
| TP-Link Archer T9UH v1 [Realtek RTL8814AU] | 1 | 3.85% |
| Realtek RTL8812AU 802.11a/b/g/n/ac 2T2R DB WLAN Adapter | 1 | 3.85% |
| Realtek RTL8192EU 802.11b/g/n WLAN Adapter | 1 | 3.85% |
| Ralink RT2870/RT3070 Wireless Adapter | 1 | 3.85% |
| Qualcomm Atheros QCA6174 802.11ac Wireless Network Adapter | 1 | 3.85% |
| Qualcomm Atheros AR9287 Wireless Network Adapter (PCI-Express) | 1 | 3.85% |
| Micro Star International MS-3871 802.11bgn Wireless Module [Ralink RT8070] | 1 | 3.85% |
| Linksys WUSB6100M 802.11a/b/g/n/ac Wireless Adapter | 1 | 3.85% |
| Intel Wireless 3165 | 1 | 3.85% |
| Intel Wi-Fi 6 AX210/AX211/AX411 160MHz | 1 | 3.85% |
| Intel Wi-Fi 6 AX200 | 1 | 3.85% |
| Intel Tiger Lake PCH CNVi WiFi | 1 | 3.85% |
| Intel Comet Lake PCH CNVi WiFi | 1 | 3.85% |
| Edimax EW-7811Un 802.11n Wireless Adapter [Realtek RTL8188CUS] | 1 | 3.85% |
| D-Link DWA-131 Wireless N Nano Adapter (Rev. E1) [Realtek RTL8192EU] | 1 | 3.85% |
| Broadcom Limited BCM4360 802.11ac Wireless Network Adapter | 1 | 3.85% |
| Broadcom BCM4360 802.11ac Wireless Network Adapter | 1 | 3.85% |
| Broadcom BCM43224 802.11a/b/g/n | 1 | 3.85% |
| Broadcom BCM4313 802.11bgn Wireless Network Adapter | 1 | 3.85% |
| ASUS USB-N13 802.11n Network Adapter (rev. B1) [Realtek RTL8192CU] | 1 | 3.85% |
Ethernet Vendor
Ethernet vendors


| Vendor | Desktops | Percent |
|---|---|---|
| Realtek Semiconductor | 19 | 46.34% |
| Intel | 12 | 29.27% |
| Broadcom | 3 | 7.32% |
| Qualcomm Atheros | 2 | 4.88% |
| Aquantia | 2 | 4.88% |
| MediaTek | 1 | 2.44% |
| Broadcom Limited | 1 | 2.44% |
| ASIX Electronics | 1 | 2.44% |
Ethernet Model
Ethernet models


| Model | Desktops | Percent |
|---|---|---|
| Realtek RTL8111/8168/8411 PCI Express Gigabit Ethernet Controller | 12 | 27.91% |
| Intel I211 Gigabit Network Connection | 5 | 11.63% |
| Realtek RTL8125 2.5GbE Controller | 4 | 9.3% |
| Aquantia AQC107 NBase-T/IEEE 802.3bz Ethernet Controller [AQtion] | 2 | 4.65% |
| Realtek RTL8169 PCI Gigabit Ethernet Controller | 1 | 2.33% |
| Realtek RTL8153 Gigabit Ethernet Adapter | 1 | 2.33% |
| Realtek RTL810xE PCI Express Fast Ethernet controller | 1 | 2.33% |
| Realtek RTL-8110SC/8169SC Gigabit Ethernet | 1 | 2.33% |
| Qualcomm Atheros Killer E2500 Gigabit Ethernet Controller | 1 | 2.33% |
| Qualcomm Atheros AR8121/AR8113/AR8114 Gigabit or Fast Ethernet | 1 | 2.33% |
| MediaTek TECNO SPARK 3 | 1 | 2.33% |
| Intel I210 Gigabit Network Connection | 1 | 2.33% |
| Intel Ethernet Controller I225-V | 1 | 2.33% |
| Intel Ethernet Connection I217-LM | 1 | 2.33% |
| Intel Ethernet Connection (7) I219-LM | 1 | 2.33% |
| Intel Ethernet Connection (2) I219-V | 1 | 2.33% |
| Intel Ethernet Connection (2) I218-V | 1 | 2.33% |
| Intel 82574L Gigabit Network Connection | 1 | 2.33% |
| Intel 82571EB/82571GB Gigabit Ethernet Controller D0/D1 (copper applications) | 1 | 2.33% |
| Broadcom NetXtreme BCM57762 Gigabit Ethernet PCIe | 1 | 2.33% |
| Broadcom NetXtreme BCM5755 Gigabit Ethernet PCI Express | 1 | 2.33% |
| Broadcom NetLink BCM57788 Gigabit Ethernet PCIe | 1 | 2.33% |
| Broadcom Limited NetXtreme BCM5755 Gigabit Ethernet PCI Express | 1 | 2.33% |
| ASIX AX88179 Gigabit Ethernet | 1 | 2.33% |
Net Controller Kind
Ethernet, WiFi or modem


| Kind | Desktops | Percent |
|---|---|---|
| Ethernet | 34 | 60.71% |
| WiFi | 22 | 39.29% |
Used Controller
Currently used network controller


| Kind | Desktops | Percent |
|---|---|---|
| Ethernet | 24 | 68.57% |
| WiFi | 11 | 31.43% |
NICs
Total network controllers on board


| Total | Desktops | Percent |
|---|---|---|
| 1 | 17 | 48.57% |
| 2 | 11 | 31.43% |
| 3 | 4 | 11.43% |
| 6 | 1 | 2.86% |
| 4 | 1 | 2.86% |
| 0 | 1 | 2.86% |
IPv6
IPv6 vs IPv4


| Used | Desktops | Percent |
|---|---|---|
| No | 29 | 82.86% |
| Yes | 6 | 17.14% |
Bluetooth
Bluetooth Vendor
Controller vendors


| Vendor | Desktops | Percent |
|---|---|---|
| Intel | 6 | 40% |
| Cambridge Silicon Radio | 5 | 33.33% |
| Apple | 2 | 13.33% |
| Micro Star International | 1 | 6.67% |
| ASUSTek Computer | 1 | 6.67% |
Bluetooth Model
Controller models


| Model | Desktops | Percent |
|---|---|---|
| Cambridge Silicon Radio Bluetooth Dongle (HCI mode) | 5 | 31.25% |
| Intel Wireless-AC 9260 Bluetooth Adapter | 2 | 12.5% |
| Micro Star International Bluetooth Device | 1 | 6.25% |
| Intel Bluetooth wireless interface | 1 | 6.25% |
| Intel Bluetooth Device | 1 | 6.25% |
| Intel Bluetooth 9460/9560 Jefferson Peak (JfP) | 1 | 6.25% |
| Intel AX210 Bluetooth | 1 | 6.25% |
| Intel AX200 Bluetooth | 1 | 6.25% |
| ASUS Bluetooth Device | 1 | 6.25% |
| Apple Built-in Bluetooth 2.0+EDR HCI | 1 | 6.25% |
| Apple Bluetooth USB Host Controller | 1 | 6.25% |
Sound
Sound Vendor
Sound card vendors


| Vendor | Desktops | Percent |
|---|---|---|
| Intel | 20 | 29.85% |
| AMD | 20 | 29.85% |
| Nvidia | 17 | 25.37% |
| TerraTec Electronic | 1 | 1.49% |
| Micro Star International | 1 | 1.49% |
| Logitech | 1 | 1.49% |
| Kingston Technology | 1 | 1.49% |
| JMTek | 1 | 1.49% |
| GN Netcom | 1 | 1.49% |
| Corsair | 1 | 1.49% |
| C-Media Electronics | 1 | 1.49% |
| Bose | 1 | 1.49% |
| ASUSTek Computer | 1 | 1.49% |
Sound Model
Sound card models


| Model | Desktops | Percent |
|---|---|---|
| AMD Starship/Matisse HD Audio Controller | 6 | 8.11% |
| Nvidia GP106 High Definition Audio Controller | 3 | 4.05% |
| Intel C610/X99 series chipset HD Audio Controller | 3 | 4.05% |
| Intel 200 Series PCH HD Audio | 3 | 4.05% |
| AMD SBx00 Azalia (Intel HDA) | 3 | 4.05% |
| AMD Family 17h/19h HD Audio Controller | 3 | 4.05% |
| AMD Ellesmere HDMI Audio [Radeon RX 470/480 / 570/580/590] | 3 | 4.05% |
| Nvidia TU116 High Definition Audio Controller | 2 | 2.7% |
| Nvidia TU104 HD Audio Controller | 2 | 2.7% |
| Intel Xeon E3-1200 v3/4th Gen Core Processor HD Audio Controller | 2 | 2.7% |
| Intel 82801JI (ICH10 Family) HD Audio Controller | 2 | 2.7% |
| Intel 8 Series/C220 Series Chipset High Definition Audio Controller | 2 | 2.7% |
| AMD Tahiti HDMI Audio [Radeon HD 7870 XT / 7950/7970] | 2 | 2.7% |
| AMD Raven/Raven2/Fenghuang HDMI/DP Audio Controller | 2 | 2.7% |
| AMD Family 17h (Models 00h-0fh) HD Audio Controller | 2 | 2.7% |
| TerraTec Electronic Aureon 5.1 MkII | 1 | 1.35% |
| Nvidia TU107 GeForce GTX 1650 High Definition Audio Controller | 1 | 1.35% |
| Nvidia TU106 High Definition Audio Controller | 1 | 1.35% |
| Nvidia TU102 High Definition Audio Controller | 1 | 1.35% |
| Nvidia High Definition Audio Controller | 1 | 1.35% |
| Nvidia GP108 High Definition Audio Controller | 1 | 1.35% |
| Nvidia GP107GL High Definition Audio Controller | 1 | 1.35% |
| Nvidia GP104 High Definition Audio Controller | 1 | 1.35% |
| Nvidia GK107 HDMI Audio Controller | 1 | 1.35% |
| Nvidia GK106 HDMI Audio Controller | 1 | 1.35% |
| Nvidia GF108 High Definition Audio Controller | 1 | 1.35% |
| Micro Star International USB Audio | 1 | 1.35% |
| Logitech G935 Gaming Headset | 1 | 1.35% |
| Kingston Technology HyperX 7.1 Audio | 1 | 1.35% |
| JMTek USB PnP Audio Device | 1 | 1.35% |
| Intel Tiger Lake-H HD Audio Controller | 1 | 1.35% |
| Intel Comet Lake PCH cAVS | 1 | 1.35% |
| Intel Celeron N3350/Pentium N4200/Atom E3900 Series Audio Cluster | 1 | 1.35% |
| Intel Cannon Lake PCH cAVS | 1 | 1.35% |
| Intel C600/X79 series chipset High Definition Audio Controller | 1 | 1.35% |
| Intel Alder Lake-S HD Audio Controller | 1 | 1.35% |
| Intel 82801I (ICH9 Family) HD Audio Controller | 1 | 1.35% |
| Intel 82801H (ICH8 Family) HD Audio Controller | 1 | 1.35% |
| Intel 631xESB/632xESB High Definition Audio Controller | 1 | 1.35% |
| Intel 6 Series/C200 Series Chipset Family High Definition Audio Controller | 1 | 1.35% |
| GN Netcom Jabra Evolve2 40 | 1 | 1.35% |
| Corsair HS45 Surround USB Sound Adapter | 1 | 1.35% |
| C-Media Electronics CMI8788 [Oxygen HD Audio] | 1 | 1.35% |
| Bose USB Audio | 1 | 1.35% |
| ASUSTek Computer USB Audio | 1 | 1.35% |
| AMD Renoir Radeon High Definition Audio Controller | 1 | 1.35% |
| AMD Navi 10 HDMI Audio | 1 | 1.35% |
| AMD Cedar HDMI Audio [Radeon HD 5400/6300/7300 Series] | 1 | 1.35% |
| AMD Baffin HDMI/DP Audio [Radeon RX 550 640SP / RX 560/560X] | 1 | 1.35% |
Memory
Memory Vendor
Memory module vendors


| Vendor | Desktops | Percent |
|---|---|---|
| Corsair | 6 | 28.57% |
| Kingston | 3 | 14.29% |
| G.Skill | 3 | 14.29% |
| Micron Technology | 2 | 9.52% |
| Unknown | 1 | 4.76% |
| Team | 1 | 4.76% |
| SK hynix | 1 | 4.76% |
| Samsung Electronics | 1 | 4.76% |
| Crucial | 1 | 4.76% |
| Atermiter | 1 | 4.76% |
| Unknown | 1 | 4.76% |
Memory Model
Memory module models


| Model | Desktops | Percent |
|---|---|---|
| Unknown RAM Module 8192MB DIMM 1333MT/s | 1 | 3.7% |
| Unknown RAM Module 4096MB DIMM 1333MT/s | 1 | 3.7% |
| Team RAM TEAMGROUP-UD4-3200 8GB DIMM DDR4 3733MT/s | 1 | 3.7% |
| SK hynix RAM HYMP151F72CP4N3-Y5 4096MB FB-DIMM DDR2 667MT/s | 1 | 3.7% |
| SK hynix RAM HMP31GF7EMR4C-Y5D5 8192MB FB-DIMM DDR2 667MT/s | 1 | 3.7% |
| SK hynix RAM HMP31GF7AFR4C-Y5D5 8192MB FB-DIMM DDR2 667MT/s | 1 | 3.7% |
| Samsung RAM Module 8192MB DIMM DDR3 1333MT/s | 1 | 3.7% |
| Samsung RAM Module 16384MB DIMM DDR3 1333MT/s | 1 | 3.7% |
| Micron RAM Module 4GB DIMM DDR3 1866MT/s | 1 | 3.7% |
| Micron RAM 8ATF1G64AZ-2G6E1 8GB DIMM DDR4 2667MT/s | 1 | 3.7% |
| Kingston RAM KHX2400C15/8G 8GB DIMM DDR4 2933MT/s | 1 | 3.7% |
| Kingston RAM 9965639-002.A02G 8GB DIMM DDR4 2133MT/s | 1 | 3.7% |
| Kingston RAM 9905702-120.A00G 8GB DIMM DDR4 2667MT/s | 1 | 3.7% |
| G.Skill RAM F4-3600C16-8GTZNC 8GB DIMM DDR4 3800MT/s | 1 | 3.7% |
| G.Skill RAM F4-3600C16-16GTZNC 16GB DIMM DDR4 3600MT/s | 1 | 3.7% |
| G.Skill RAM F4-3200C16-16GVK 16GB DIMM DDR4 3600MT/s | 1 | 3.7% |
| Crucial RAM BLS16G4D30AESB.M16FE 16GB DIMM DDR4 3200MT/s | 1 | 3.7% |
| Corsair RAM Module 16GB DIMM DDR4 2133MT/s | 1 | 3.7% |
| Corsair RAM CMW32GX4M2A2666C16 16GB DIMM DDR4 2667MT/s | 1 | 3.7% |
| Corsair RAM CMK32GX5M2B5600C36 16GB DIMM 5800MT/s | 1 | 3.7% |
| Corsair RAM CMK32GX4M4A2400C16 8GB DIMM DDR4 2400MT/s | 1 | 3.7% |
| Corsair RAM CMK16GX4M2B3200C16 8GB DIMM DDR4 3600MT/s | 1 | 3.7% |
| Corsair RAM CMK16GX4M2B3000C15 8192MB DIMM DDR4 3000MT/s | 1 | 3.7% |
| Corsair RAM CMK16GX4M2A2400C14 8GB DIMM DDR4 2800MT/s | 1 | 3.7% |
| Corsair RAM CMD16GX4M2B3200C14 8GB DIMM DDR4 3200MT/s | 1 | 3.7% |
| Atermiter RAM Module 16GB DIMM DDR4 2400MT/s | 1 | 3.7% |
| Unknown | 1 | 3.7% |
Memory Kind
Memory module kinds


| Kind | Desktops | Percent |
|---|---|---|
| DDR4 | 15 | 71.43% |
| DDR3 | 2 | 9.52% |
| DDR2 | 2 | 9.52% |
| Unknown | 2 | 9.52% |
Memory Form Factor
Physical design of the memory module


| Name | Desktops | Percent |
|---|---|---|
| DIMM | 20 | 95.24% |
| FB-DIMM | 1 | 4.76% |
Memory Size
Memory module size


| Size | Desktops | Percent |
|---|---|---|
| 8192 | 11 | 45.83% |
| 16384 | 8 | 33.33% |
| 4096 | 3 | 12.5% |
| 32768 | 1 | 4.17% |
| 2048 | 1 | 4.17% |
Memory Speed
Memory module speed


| Speed | Desktops | Percent |
|---|---|---|
| 3600 | 3 | 13.04% |
| 2667 | 3 | 13.04% |
| 3200 | 2 | 8.7% |
| 2400 | 2 | 8.7% |
| 2133 | 2 | 8.7% |
| 1333 | 2 | 8.7% |
| 5800 | 1 | 4.35% |
| 3800 | 1 | 4.35% |
| 3733 | 1 | 4.35% |
| 3466 | 1 | 4.35% |
| 2933 | 1 | 4.35% |
| 2800 | 1 | 4.35% |
| 1866 | 1 | 4.35% |
| 1066 | 1 | 4.35% |
| 667 | 1 | 4.35% |
Printers & scanners
Printer Vendor
Printer device vendors


| Vendor | Desktops | Percent |
|---|---|---|
| Hewlett-Packard | 1 | 50% |
| Brother Industries | 1 | 50% |
Printer Model
Printer device models


| Model | Desktops | Percent |
|---|---|---|
| HP LaserJet 1022 | 1 | 50% |
| Brother DCP-L2540DW | 1 | 50% |
Scanner Vendor
Scanner device vendors


| Vendor | Desktops | Percent |
|---|---|---|
| Seiko Epson | 1 | 50% |
| Canon | 1 | 50% |
Scanner Model
Scanner device models


| Model | Desktops | Percent |
|---|---|---|
| Seiko Epson GT-X820 [Perfection V600 Photo] | 1 | 50% |
| Canon CanoScan LiDE 210 | 1 | 50% |
Camera
Camera Vendor
Camera device vendors


| Vendor | Desktops | Percent |
|---|---|---|
| Logitech | 3 | 50% |
| Microsoft | 1 | 16.67% |
| Microdia | 1 | 16.67% |
| MacroSilicon | 1 | 16.67% |
Camera Model
Camera device models


| Model | Desktops | Percent |
|---|---|---|
| Logitech HD Pro Webcam C920 | 2 | 33.33% |
| Microsoft LifeCam Cinema | 1 | 16.67% |
| Microdia Integrated Camera | 1 | 16.67% |
| MacroSilicon MiraBox Capture | 1 | 16.67% |
| Logitech BRIO Ultra HD Webcam | 1 | 16.67% |
Security
Fingerprint Vendor
Fingerprint sensor vendors


| Vendor | Desktops | Percent |
|---|---|---|
| Synaptics | 1 | 100% |
Fingerprint Model
Fingerprint sensor models


| Model | Desktops | Percent |
|---|---|---|
| Synaptics WBDI Fingerprint Reader - USB 052 | 1 | 100% |
Chipcard Vendor
Chipcard module vendors
Zero info for selected period =(
Chipcard Model
Chipcard module models
Zero info for selected period =(
Unsupported
Unsupported Devices
Total unsupported devices on board


| Total | Desktops | Percent |
|---|---|---|
| 0 | 27 | 77.14% |
| 1 | 6 | 17.14% |
| 3 | 1 | 2.86% |
| 2 | 1 | 2.86% |
Unsupported Device Types
Types of unsupported devices


| Type | Desktops | Percent |
|---|---|---|
| Unassigned class | 3 | 37.5% |
| Net/wireless | 2 | 25% |
| Multimedia controller | 2 | 25% |
| Fingerprint reader | 1 | 12.5% |