Gentoo Hardware Trends (Desktops)
A project to identify most popular hardware characteristics and track their change over time based on data collected by Gentoo users at https://Linux-Hardware.org.
Anyone can contribute to this report by the hw-probe tool:
sudo -E hw-probe -all -uploadFull-feature report is available here: https://linux-hardware.org/?view=trends
Period: Mar, 2022.
Contents
System
OS
Installed operating systems


| Name | Desktops | Percent |
|---|---|---|
| Gentoo 2.8 | 9 | 39.13% |
| Gentoo 2.7 | 7 | 30.43% |
| Gentoo 2.6 | 7 | 30.43% |
OS Family
OS without a version


| Name | Desktops | Percent |
|---|---|---|
| Gentoo | 23 | 100% |
Kernel
Version of the Linux kernel


| Version | Desktops | Percent |
|---|---|---|
| 5.15.23-gentoo | 3 | 13.04% |
| 5.15.26-gentoo | 2 | 8.7% |
| 5.10.35-gentoo | 2 | 8.7% |
| 5.4.97-gentoo-x86_64 | 1 | 4.35% |
| 5.17.1-gentoo-r1 | 1 | 4.35% |
| 5.17.0-gentoo-x86_64 | 1 | 4.35% |
| 5.17.0-gentoo | 1 | 4.35% |
| 5.16.8-gentoo-x86_64 | 1 | 4.35% |
| 5.16.15 | 1 | 4.35% |
| 5.16.14-gentoo-x86_64 | 1 | 4.35% |
| 5.16.14-gentoo-girlhog | 1 | 4.35% |
| 5.16.12-gentoo-x86_64 | 1 | 4.35% |
| 5.16.11-gentoo-x86_64 | 1 | 4.35% |
| 5.15.26b | 1 | 4.35% |
| 5.15.26-gentoo-x86_64 | 1 | 4.35% |
| 5.15.23-gentoo-dist | 1 | 4.35% |
| 5.15.16-gentoo-NSA | 1 | 4.35% |
| 5.10.49-gentoo-r1-x86_64 | 1 | 4.35% |
| 4.9.135-vs2.3.9.8-dappersec-2 | 1 | 4.35% |
Kernel Family
Linux kernel without a distro release


| Version | Desktops | Percent |
|---|---|---|
| 5.15.26 | 4 | 17.39% |
| 5.15.23 | 4 | 17.39% |
| 5.17.0 | 2 | 8.7% |
| 5.16.14 | 2 | 8.7% |
| 5.10.35 | 2 | 8.7% |
| 5.4.97 | 1 | 4.35% |
| 5.17.1 | 1 | 4.35% |
| 5.16.8 | 1 | 4.35% |
| 5.16.15 | 1 | 4.35% |
| 5.16.12 | 1 | 4.35% |
| 5.16.11 | 1 | 4.35% |
| 5.15.16 | 1 | 4.35% |
| 5.10.49 | 1 | 4.35% |
| 4.9.135 | 1 | 4.35% |
Kernel Major Ver.
Linux kernel major version


| Version | Desktops | Percent |
|---|---|---|
| 5.15 | 9 | 39.13% |
| 5.16 | 6 | 26.09% |
| 5.17 | 3 | 13.04% |
| 5.10 | 3 | 13.04% |
| 5.4 | 1 | 4.35% |
| 4.9 | 1 | 4.35% |
Arch
OS architecture (x86_64, i586, etc.)


| Name | Desktops | Percent |
|---|---|---|
| x86_64 | 23 | 100% |
DE
Desktop Environment


| Name | Desktops | Percent |
|---|---|---|
| KDE5 | 7 | 30.43% |
| GNOME | 5 | 21.74% |
| Unknown | 5 | 21.74% |
| XFCE | 2 | 8.7% |
| MATE | 2 | 8.7% |
| KDE | 1 | 4.35% |
| Cinnamon | 1 | 4.35% |
Display Server
X11 or Wayland


| Name | Desktops | Percent |
|---|---|---|
| X11 | 9 | 39.13% |
| Unknown | 6 | 26.09% |
| Tty | 5 | 21.74% |
| Wayland | 3 | 13.04% |
Display Manager
SDDM, LightDM, etc.


| Name | Desktops | Percent |
|---|---|---|
| Unknown | 11 | 47.83% |
| SDDM | 6 | 26.09% |
| LightDM | 4 | 17.39% |
| LXDM | 1 | 4.35% |
| GDM | 1 | 4.35% |
OS Lang
Language


| Lang | Desktops | Percent |
|---|---|---|
| en_US | 13 | 56.52% |
| C.UTF8 | 3 | 13.04% |
| pl_PL | 2 | 8.7% |
| Unknown | 2 | 8.7% |
| zh_TW | 1 | 4.35% |
| en_IN | 1 | 4.35% |
| en_GB | 1 | 4.35% |
Boot Mode
EFI or BIOS


| Mode | Desktops | Percent |
|---|---|---|
| EFI | 20 | 86.96% |
| BIOS | 3 | 13.04% |
Filesystem
Type of filesystem


| Type | Desktops | Percent |
|---|---|---|
| Ext4 | 15 | 65.22% |
| Btrfs | 5 | 21.74% |
| F2fs | 2 | 8.7% |
| Zfs | 1 | 4.35% |
Part. scheme
Scheme of partitioning


| Type | Desktops | Percent |
|---|---|---|
| GPT | 21 | 91.3% |
| Unknown | 2 | 8.7% |
Dual Boot with Linux/BSD
Hosting more than one Linux/BSD


| Dual boot | Desktops | Percent |
|---|---|---|
| No | 14 | 60.87% |
| Yes | 9 | 39.13% |
Dual Boot (Win)
Hosting Linux and Windows


| Dual boot | Desktops | Percent |
|---|---|---|
| No | 12 | 52.17% |
| Yes | 11 | 47.83% |
Board
Vendor
Motherboard manufacturer


| Name | Desktops | Percent |
|---|---|---|
| ASUSTek Computer | 13 | 56.52% |
| Gigabyte Technology | 3 | 13.04% |
| MSI | 2 | 8.7% |
| ASRock | 2 | 8.7% |
| Intel | 1 | 4.35% |
| Dell | 1 | 4.35% |
| Alienware | 1 | 4.35% |
Model
Motherboard model


| Name | Desktops | Percent |
|---|---|---|
| ASUS TUF GAMING Z590-PLUS WIFI | 2 | 8.7% |
| MSI MS-7D18 | 1 | 4.35% |
| MSI MS-7C94 | 1 | 4.35% |
| Intel DH61WW AAG23116-302 | 1 | 4.35% |
| Gigabyte Z590 UD | 1 | 4.35% |
| Gigabyte B550 GAMING X V2 | 1 | 4.35% |
| Gigabyte AB350-Gaming | 1 | 4.35% |
| Dell OptiPlex 7080 | 1 | 4.35% |
| ASUS Z170 PRO GAMING | 1 | 4.35% |
| ASUS TUF GAMING X570-PRO | 1 | 4.35% |
| ASUS TUF Gaming X570-PLUS | 1 | 4.35% |
| ASUS SABERTOOTH 990FX R2.0 | 1 | 4.35% |
| ASUS ROG STRIX Z390-E GAMING | 1 | 4.35% |
| ASUS ROG STRIX Z370-H GAMING | 1 | 4.35% |
| ASUS ROG STRIX B550-F GAMING | 1 | 4.35% |
| ASUS ROG STRIX B450-F GAMING | 1 | 4.35% |
| ASUS PRIME X299-DELUXE II | 1 | 4.35% |
| ASUS PRIME J4005I-C | 1 | 4.35% |
| ASUS M3A78-CM | 1 | 4.35% |
| ASRock Z170A-X1 | 1 | 4.35% |
| ASRock A300M-STX | 1 | 4.35% |
| Alienware Aurora Ryzen Edition | 1 | 4.35% |
Model Family
Motherboard model prefix


| Name | Desktops | Percent |
|---|---|---|
| ASUS TUF | 4 | 17.39% |
| ASUS ROG | 4 | 17.39% |
| ASUS PRIME | 2 | 8.7% |
| MSI MS-7D18 | 1 | 4.35% |
| MSI MS-7C94 | 1 | 4.35% |
| Intel DH61WW | 1 | 4.35% |
| Gigabyte Z590 | 1 | 4.35% |
| Gigabyte B550 | 1 | 4.35% |
| Gigabyte AB350-Gaming | 1 | 4.35% |
| Dell OptiPlex | 1 | 4.35% |
| ASUS Z170 | 1 | 4.35% |
| ASUS SABERTOOTH | 1 | 4.35% |
| ASUS M3A78-CM | 1 | 4.35% |
| ASRock Z170A-X1 | 1 | 4.35% |
| ASRock A300M-STX | 1 | 4.35% |
| Alienware Aurora | 1 | 4.35% |
MFG Year
Motherboard manufacture year


| Year | Desktops | Percent |
|---|---|---|
| 2020 | 6 | 26.09% |
| 2021 | 4 | 17.39% |
| 2019 | 3 | 13.04% |
| 2018 | 2 | 8.7% |
| 2017 | 2 | 8.7% |
| 2012 | 2 | 8.7% |
| 2022 | 1 | 4.35% |
| 2016 | 1 | 4.35% |
| 2015 | 1 | 4.35% |
| 2008 | 1 | 4.35% |
Form Factor
Physical design of the computer


| Name | Desktops | Percent |
|---|---|---|
| Desktop | 23 | 100% |
Secure Boot
Enabled or disabled


| State | Desktops | Percent |
|---|---|---|
| Disabled | 23 | 100% |
Coreboot
Have coreboot on board


| Used | Desktops | Percent |
|---|---|---|
| No | 23 | 100% |
RAM Size
Total RAM memory


| Size in GB | Desktops | Percent |
|---|---|---|
| 32.01-64.0 | 7 | 30.43% |
| 16.01-24.0 | 7 | 30.43% |
| 64.01-256.0 | 4 | 17.39% |
| 8.01-16.0 | 3 | 13.04% |
| 4.01-8.0 | 1 | 4.35% |
| 24.01-32.0 | 1 | 4.35% |
RAM Used
Used RAM memory


| Used GB | Desktops | Percent |
|---|---|---|
| 4.01-8.0 | 7 | 30.43% |
| 8.01-16.0 | 5 | 21.74% |
| 2.01-3.0 | 3 | 13.04% |
| 0.51-1.0 | 3 | 13.04% |
| 16.01-24.0 | 2 | 8.7% |
| 1.01-2.0 | 2 | 8.7% |
| 0.01-0.5 | 1 | 4.35% |
Total Drives
Number of drives on board


| Drives | Desktops | Percent |
|---|---|---|
| 1 | 7 | 30.43% |
| 2 | 5 | 21.74% |
| 6 | 3 | 13.04% |
| 5 | 3 | 13.04% |
| 3 | 3 | 13.04% |
| 8 | 1 | 4.35% |
| 4 | 1 | 4.35% |
Has CD-ROM
Has CD-ROM on board


| Presented | Desktops | Percent |
|---|---|---|
| No | 18 | 78.26% |
| Yes | 5 | 21.74% |
Has Ethernet
Has Ethernet on board


| Presented | Desktops | Percent |
|---|---|---|
| Yes | 23 | 100% |
Has WiFi
Has WiFi module


| Presented | Desktops | Percent |
|---|---|---|
| No | 12 | 52.17% |
| Yes | 11 | 47.83% |
Has Bluetooth
Has Bluetooth module


| Presented | Desktops | Percent |
|---|---|---|
| No | 13 | 56.52% |
| Yes | 10 | 43.48% |
Location
Country
Geographic location (country)


| Country | Desktops | Percent |
|---|---|---|
| USA | 5 | 21.74% |
| Poland | 3 | 13.04% |
| China | 2 | 8.7% |
| UK | 1 | 4.35% |
| Taiwan | 1 | 4.35% |
| Sweden | 1 | 4.35% |
| Spain | 1 | 4.35% |
| Russia | 1 | 4.35% |
| Philippines | 1 | 4.35% |
| Norway | 1 | 4.35% |
| Mexico | 1 | 4.35% |
| Ireland | 1 | 4.35% |
| India | 1 | 4.35% |
| Hong Kong | 1 | 4.35% |
| Germany | 1 | 4.35% |
| Bulgaria | 1 | 4.35% |
City
Geographic location (city)


| City | Desktops | Percent |
|---|---|---|
| Geleshan | 2 | 8.7% |
| Warsaw | 1 | 4.35% |
| Storsteinnes | 1 | 4.35% |
| Stockholm | 1 | 4.35% |
| Sofia | 1 | 4.35% |
| Poplar | 1 | 4.35% |
| Orange | 1 | 4.35% |
| Munich | 1 | 4.35% |
| Moscow | 1 | 4.35% |
| Miasto Ogrod Komorow | 1 | 4.35% |
| Mexico City | 1 | 4.35% |
| Los Angeles | 1 | 4.35% |
| Laziska Gorne | 1 | 4.35% |
| Hyannis | 1 | 4.35% |
| Hsinchu | 1 | 4.35% |
| Fort Collins | 1 | 4.35% |
| Dublin | 1 | 4.35% |
| Chennai | 1 | 4.35% |
| Central | 1 | 4.35% |
| Cebu City | 1 | 4.35% |
| Bellaterra | 1 | 4.35% |
| Aurora | 1 | 4.35% |
Drives
Drive Vendor
Hard drive vendors


| Vendor | Desktops | Drives | Percent |
|---|---|---|---|
| Samsung Electronics | 11 | 16 | 21.15% |
| Seagate | 10 | 13 | 19.23% |
| WDC | 6 | 10 | 11.54% |
| Toshiba | 4 | 5 | 7.69% |
| Sandisk | 4 | 4 | 7.69% |
| Kingston | 3 | 4 | 5.77% |
| Intel | 2 | 3 | 3.85% |
| GOODRAM | 2 | 2 | 3.85% |
| Transcend | 1 | 1 | 1.92% |
| SK Hynix | 1 | 1 | 1.92% |
| PNY | 1 | 1 | 1.92% |
| Phison | 1 | 1 | 1.92% |
| KIOXIA-EXCERIA | 1 | 2 | 1.92% |
| KIOXIA | 1 | 1 | 1.92% |
| Hitachi | 1 | 3 | 1.92% |
| HGST | 1 | 1 | 1.92% |
| Crucial | 1 | 1 | 1.92% |
| Corsair | 1 | 2 | 1.92% |
Drive Model
Hard drive models


| Model | Desktops | Percent |
|---|---|---|
| Sandisk NVMe SSD Drive 1TB | 2 | 3.03% |
| Samsung SSD 980 PRO 1TB | 2 | 3.03% |
| Samsung SSD 980 500GB | 2 | 3.03% |
| GOODRAM SSDPR-CL100-480-G2 480GB | 2 | 3.03% |
| WDC WDS500G2B0A-00SM50 500GB SSD | 1 | 1.52% |
| WDC WDS100T2B0A-00SM50 1TB SSD | 1 | 1.52% |
| WDC WD8003FFBX-68B9AN0 8TB | 1 | 1.52% |
| WDC WD60EZRX-00MVLB1 6TB | 1 | 1.52% |
| WDC WD5000AZRX-00A8LB0 500GB | 1 | 1.52% |
| WDC WD30EFRX-68EUZN0 3TB | 1 | 1.52% |
| WDC WD20EZAZ-00GGJB0 2TB | 1 | 1.52% |
| WDC WD2003FZEX-00Z4SA0 2TB | 1 | 1.52% |
| WDC WD10EZEX-08M2NA0 1TB | 1 | 1.52% |
| WDC WD1001FALS-00J7B1 1TB | 1 | 1.52% |
| Transcend TS128GMTE110S 128GB | 1 | 1.52% |
| Toshiba TR200 480GB SSD | 1 | 1.52% |
| Toshiba HDWQ140 4TB | 1 | 1.52% |
| Toshiba HDWE150 5TB | 1 | 1.52% |
| Toshiba HDWD130 3TB | 1 | 1.52% |
| Toshiba DT01ACA300 3TB | 1 | 1.52% |
| SK Hynix PC611 NVMe 512GB | 1 | 1.52% |
| Seagate ST8000DM004-2CX188 8TB | 1 | 1.52% |
| Seagate ST500DM002-1BD142 500GB | 1 | 1.52% |
| Seagate ST4000DM004-2CV104 4TB | 1 | 1.52% |
| Seagate ST4000DM000-1F2168 4TB | 1 | 1.52% |
| Seagate ST3000DM001-1ER166 3TB | 1 | 1.52% |
| Seagate ST2000LX001-1RG174 2TB | 1 | 1.52% |
| Seagate ST2000DM005-2CW102 2TB | 1 | 1.52% |
| Seagate ST2000DM001-1ER164 2TB | 1 | 1.52% |
| Seagate ST12000NM0008-2H3101 12TB | 1 | 1.52% |
| Seagate ST1000DM010-2EP102 1TB | 1 | 1.52% |
| Seagate ST1000DM003-1ER162 1TB | 1 | 1.52% |
| Seagate Expansion 320GB | 1 | 1.52% |
| SanDisk Ultra II 480GB SSD | 1 | 1.52% |
| SanDisk SSD PLUS 240GB | 1 | 1.52% |
| Samsung SSD 980 PRO 2TB | 1 | 1.52% |
| Samsung SSD 970 PRO 1TB | 1 | 1.52% |
| Samsung SSD 970 EVO Plus 1TB | 1 | 1.52% |
| Samsung SSD 970 EVO 1TB | 1 | 1.52% |
| Samsung SSD 860 QVO 2TB | 1 | 1.52% |
| Samsung SSD 860 QVO 1TB | 1 | 1.52% |
| Samsung SSD 860 EVO 250GB | 1 | 1.52% |
| Samsung SSD 850 PRO 256GB | 1 | 1.52% |
| Samsung SSD 850 EVO 1TB | 1 | 1.52% |
| Samsung NVMe SSD Drive 512GB | 1 | 1.52% |
| Samsung NVMe SSD Drive 500GB | 1 | 1.52% |
| Samsung NVMe SSD Drive 2TB | 1 | 1.52% |
| PNY CS1311 240GB SSD | 1 | 1.52% |
| Phison Neutron NX500 800GB | 1 | 1.52% |
| KIOXIA-EXCERIA SSD 500GB | 1 | 1.52% |
| KIOXIA-EXCERIA SSD 1TB | 1 | 1.52% |
| KIOXIA KXG60PNV2T04 NVMe 2048GB | 1 | 1.52% |
| Kingston SV300S37A120G 120GB SSD | 1 | 1.52% |
| Kingston SV100S2128G 128GB SSD | 1 | 1.52% |
| Kingston SSDNOW 30GB | 1 | 1.52% |
| Intel SSDPEKKW256G8 256GB | 1 | 1.52% |
| Intel SSD 600P Series 256GB | 1 | 1.52% |
| Hitachi HUS724030ALE641 3TB | 1 | 1.52% |
| HGST HDN724040ALE640 4TB | 1 | 1.52% |
| Crucial CT500MX500SSD1 500GB | 1 | 1.52% |
HDD Vendor
Hard disk drive vendors


| Vendor | Desktops | Drives | Percent |
|---|---|---|---|
| Seagate | 10 | 13 | 50% |
| WDC | 5 | 8 | 25% |
| Toshiba | 3 | 4 | 15% |
| Hitachi | 1 | 3 | 5% |
| HGST | 1 | 1 | 5% |
SSD Vendor
Solid state drive vendors


| Vendor | Desktops | Drives | Percent |
|---|---|---|---|
| Samsung Electronics | 5 | 5 | 27.78% |
| Kingston | 3 | 4 | 16.67% |
| WDC | 2 | 2 | 11.11% |
| SanDisk | 2 | 2 | 11.11% |
| GOODRAM | 2 | 2 | 11.11% |
| Toshiba | 1 | 1 | 5.56% |
| PNY | 1 | 1 | 5.56% |
| Crucial | 1 | 1 | 5.56% |
| Corsair | 1 | 1 | 5.56% |
Drive Kind
HDD or SSD


| Kind | Desktops | Drives | Percent |
|---|---|---|---|
| NVMe | 18 | 23 | 40.91% |
| SSD | 13 | 19 | 29.55% |
| HDD | 13 | 29 | 29.55% |
Drive Connector
SATA, SAS, NVMe, etc.


| Type | Desktops | Drives | Percent |
|---|---|---|---|
| NVMe | 18 | 23 | 52.94% |
| SATA | 15 | 47 | 44.12% |
| SAS | 1 | 1 | 2.94% |
Drive Size
Size of hard drive


| Size in TB | Desktops | Drives | Percent |
|---|---|---|---|
| 0.01-0.5 | 11 | 17 | 34.38% |
| 0.51-1.0 | 7 | 8 | 21.88% |
| 3.01-4.0 | 4 | 4 | 12.5% |
| 1.01-2.0 | 4 | 6 | 12.5% |
| 2.01-3.0 | 3 | 8 | 9.38% |
| 4.01-10.0 | 2 | 4 | 6.25% |
| 10.01-20.0 | 1 | 1 | 3.13% |
Space Total
Amount of disk space available on the file system


| Size in GB | Desktops | Percent |
|---|---|---|
| More than 3000 | 6 | 26.09% |
| 101-250 | 6 | 26.09% |
| 501-1000 | 4 | 17.39% |
| 2001-3000 | 3 | 13.04% |
| 1001-2000 | 2 | 8.7% |
| 1-20 | 2 | 8.7% |
Space Used
Amount of used disk space


| Used GB | Desktops | Percent |
|---|---|---|
| More than 3000 | 4 | 17.39% |
| 1-20 | 4 | 17.39% |
| 251-500 | 3 | 13.04% |
| 21-50 | 3 | 13.04% |
| 1001-2000 | 3 | 13.04% |
| 501-1000 | 3 | 13.04% |
| 101-250 | 2 | 8.7% |
| 2001-3000 | 1 | 4.35% |
Malfunc. Drives
Drive models with a malfunction


| Model | Desktops | Drives | Percent |
|---|---|---|---|
| WDC WD5000AZRX-00A8LB0 500GB | 1 | 1 | 33.33% |
| Toshiba HDWD130 3TB | 1 | 1 | 33.33% |
| Kingston SV100S2128G 128GB SSD | 1 | 1 | 33.33% |
Malfunc. Drive Vendor
Vendors of faulty drives


| Vendor | Desktops | Drives | Percent |
|---|---|---|---|
| WDC | 1 | 1 | 33.33% |
| Toshiba | 1 | 1 | 33.33% |
| Kingston | 1 | 1 | 33.33% |
Malfunc. HDD Vendor
Vendors of faulty HDD drives


| Vendor | Desktops | Drives | Percent |
|---|---|---|---|
| WDC | 1 | 1 | 50% |
| Toshiba | 1 | 1 | 50% |
Malfunc. Drive Kind
Kinds of faulty drives


| Kind | Desktops | Drives | Percent |
|---|---|---|---|
| HDD | 2 | 2 | 66.67% |
| SSD | 1 | 1 | 33.33% |
Failed Drives
Failed drive models
Zero info for selected period =(
Failed Drive Vendor
Failed drive vendors
Zero info for selected period =(
Drive Status
Number of failed and malfunc. drives


| Status | Desktops | Drives | Percent |
|---|---|---|---|
| Works | 19 | 59 | 70.37% |
| Detected | 5 | 9 | 18.52% |
| Malfunc | 3 | 3 | 11.11% |
Storage controller
Storage Vendor
Storage controller vendors


| Vendor | Desktops | Percent |
|---|---|---|
| Intel | 14 | 33.33% |
| AMD | 10 | 23.81% |
| Samsung Electronics | 9 | 21.43% |
| Sandisk | 2 | 4.76% |
| ASMedia Technology | 2 | 4.76% |
| Toshiba America Info Systems | 1 | 2.38% |
| SK Hynix | 1 | 2.38% |
| Silicon Motion | 1 | 2.38% |
| Phison Electronics | 1 | 2.38% |
| KIOXIA | 1 | 2.38% |
Storage Model
Storage controller models


| Model | Desktops | Percent |
|---|---|---|
| Samsung NVMe SSD Controller SM981/PM981/PM983 | 5 | 10.87% |
| Intel 500 Series Chipset Family SATA AHCI Controller | 4 | 8.7% |
| AMD FCH SATA Controller [AHCI mode] | 4 | 8.7% |
| Samsung NVMe SSD Controller PM9A1/PM9A3/980PRO | 3 | 6.52% |
| Sandisk Non-Volatile memory controller | 2 | 4.35% |
| Samsung NVMe SSD Controller 980 | 2 | 4.35% |
| Intel Q170/Q150/B150/H170/H110/Z170/CM236 Chipset SATA Controller [AHCI Mode] | 2 | 4.35% |
| Intel 200 Series PCH SATA controller [AHCI mode] | 2 | 4.35% |
| ASMedia ASM1062 Serial ATA Controller | 2 | 4.35% |
| AMD 500 Series Chipset SATA Controller | 2 | 4.35% |
| Toshiba America Info Systems XG6 NVMe SSD Controller | 1 | 2.17% |
| SK Hynix Non-Volatile memory controller | 1 | 2.17% |
| Silicon Motion SM2263EN/SM2263XT SSD Controller | 1 | 2.17% |
| Phison E7 NVMe Controller | 1 | 2.17% |
| Phison E12 NVMe Controller | 1 | 2.17% |
| KIOXIA NVMe SSD | 1 | 2.17% |
| Intel SSD Pro 7600p/760p/E 6100p Series | 1 | 2.17% |
| Intel SSD 600P Series | 1 | 2.17% |
| Intel Comet Lake SATA AHCI Controller | 1 | 2.17% |
| Intel Celeron/Pentium Silver Processor SATA Controller | 1 | 2.17% |
| Intel Cannon Lake PCH SATA AHCI Controller | 1 | 2.17% |
| Intel 6 Series/C200 Series Chipset Family 6 port Desktop SATA AHCI Controller | 1 | 2.17% |
| AMD SB7x0/SB8x0/SB9x0 SATA Controller [IDE mode] | 1 | 2.17% |
| AMD SB7x0/SB8x0/SB9x0 SATA Controller [AHCI mode] | 1 | 2.17% |
| AMD SB7x0/SB8x0/SB9x0 IDE Controller | 1 | 2.17% |
| AMD FCH RAID Controller | 1 | 2.17% |
| AMD 400 Series Chipset SATA Controller | 1 | 2.17% |
| AMD 300 Series Chipset SATA Controller | 1 | 2.17% |
Storage Kind
Kind of storage controller (IDE, SATA, NVMe, SAS, ...)


| Kind | Desktops | Percent |
|---|---|---|
| SATA | 21 | 51.22% |
| NVMe | 18 | 43.9% |
| RAID | 1 | 2.44% |
| IDE | 1 | 2.44% |
Processor
CPU Vendor
Processor vendors


| Vendor | Desktops | Percent |
|---|---|---|
| Intel | 12 | 52.17% |
| AMD | 11 | 47.83% |
CPU Model
Processor models


| Model | Desktops | Percent |
|---|---|---|
| Intel 11th Gen Core i5-11600KF @ 3.90GHz | 2 | 8.7% |
| Intel Core i9-9900K CPU @ 3.60GHz | 1 | 4.35% |
| Intel Core i7-9800X CPU @ 3.80GHz | 1 | 4.35% |
| Intel Core i7-8700K CPU @ 3.70GHz | 1 | 4.35% |
| Intel Core i7-6700K CPU @ 4.00GHz | 1 | 4.35% |
| Intel Core i7-10700 CPU @ 2.90GHz | 1 | 4.35% |
| Intel Core i5-6500 CPU @ 3.20GHz | 1 | 4.35% |
| Intel Core i5-3330 CPU @ 3.00GHz | 1 | 4.35% |
| Intel Celeron J4005 CPU @ 2.00GHz | 1 | 4.35% |
| Intel 11th Gen Core i7-11700K @ 3.60GHz | 1 | 4.35% |
| Intel 11th Gen Core i5-11400 @ 2.60GHz | 1 | 4.35% |
| AMD Ryzen 9 5950X 16-Core Processor | 1 | 4.35% |
| AMD Ryzen 9 5900X 12-Core Processor | 1 | 4.35% |
| AMD Ryzen 9 3950X 16-Core Processor | 1 | 4.35% |
| AMD Ryzen 9 3900X 12-Core Processor | 1 | 4.35% |
| AMD Ryzen 7 5800X 8-Core Processor | 1 | 4.35% |
| AMD Ryzen 7 5700G with Radeon Graphics | 1 | 4.35% |
| AMD Ryzen 5 5600X 6-Core Processor | 1 | 4.35% |
| AMD Ryzen 5 2600 Six-Core Processor | 1 | 4.35% |
| AMD Ryzen 5 2400G with Radeon Vega Graphics | 1 | 4.35% |
| AMD Phenom II X4 955 Processor | 1 | 4.35% |
| AMD FX-8350 Eight-Core Processor | 1 | 4.35% |
CPU Model Family
Processor model prefix


| Model | Desktops | Percent |
|---|---|---|
| Other | 4 | 17.39% |
| Intel Core i7 | 4 | 17.39% |
| AMD Ryzen 9 | 4 | 17.39% |
| AMD Ryzen 5 | 3 | 13.04% |
| Intel Core i5 | 2 | 8.7% |
| AMD Ryzen 7 | 2 | 8.7% |
| Intel Core i9 | 1 | 4.35% |
| Intel Celeron | 1 | 4.35% |
| AMD Phenom II X4 | 1 | 4.35% |
| AMD FX | 1 | 4.35% |
CPU Cores
Number of processor cores


| Number | Desktops | Percent |
|---|---|---|
| 8 | 6 | 26.09% |
| 6 | 6 | 26.09% |
| 4 | 6 | 26.09% |
| 16 | 2 | 8.7% |
| 12 | 2 | 8.7% |
| 2 | 1 | 4.35% |
CPU Sockets
Number of sockets


| Number | Desktops | Percent |
|---|---|---|
| 1 | 23 | 100% |
CPU Threads
Threads per core (Hyper-Threading)


| Number | Desktops | Percent |
|---|---|---|
| 2 | 19 | 82.61% |
| 1 | 4 | 17.39% |
CPU Op-Modes
CPU Operation Modes (32-bit, 64-bit)


| Op mode | Desktops | Percent |
|---|---|---|
| 32-bit, 64-bit | 23 | 100% |
CPU Microcode
Microcode number


| Number | Desktops | Percent |
|---|---|---|
| 0xa0671 | 4 | 17.39% |
| 0x506e3 | 2 | 8.7% |
| 0x0a201016 | 2 | 8.7% |
| Unknown | 2 | 8.7% |
| 0xa0655 | 1 | 4.35% |
| 0x906ed | 1 | 4.35% |
| 0x706a1 | 1 | 4.35% |
| 0x50654 | 1 | 4.35% |
| 0x306a9 | 1 | 4.35% |
| 0x0a50000c | 1 | 4.35% |
| 0x0a201205 | 1 | 4.35% |
| 0x0a201204 | 1 | 4.35% |
| 0x08701021 | 1 | 4.35% |
| 0x08701013 | 1 | 4.35% |
| 0x0810100b | 1 | 4.35% |
| 0x0800820d | 1 | 4.35% |
| 0x010000db | 1 | 4.35% |
CPU Microarch
Microarchitecture


| Name | Desktops | Percent |
|---|---|---|
| Zen 3 | 5 | 21.74% |
| Skylake | 3 | 13.04% |
| Unknown | 3 | 13.04% |
| Zen 2 | 2 | 8.7% |
| KabyLake | 2 | 8.7% |
| Zen+ | 1 | 4.35% |
| Zen | 1 | 4.35% |
| Piledriver | 1 | 4.35% |
| K10 | 1 | 4.35% |
| IvyBridge | 1 | 4.35% |
| Icelake | 1 | 4.35% |
| Goldmont plus | 1 | 4.35% |
| CometLake | 1 | 4.35% |
Graphics
GPU Vendor
Vendors of graphics cards


| Vendor | Desktops | Percent |
|---|---|---|
| Nvidia | 11 | 44% |
| AMD | 11 | 44% |
| Intel | 3 | 12% |
GPU Model
Graphics card models


| Model | Desktops | Percent |
|---|---|---|
| AMD Ellesmere [Radeon RX 470/480/570/570X/580/580X/590] | 3 | 12% |
| Nvidia TU106 [GeForce RTX 2070] | 2 | 8% |
| Nvidia GT200GL [Quadro FX 4800] | 2 | 8% |
| Nvidia GP104 [GeForce GTX 1070] | 2 | 8% |
| Nvidia GP107 [GeForce GTX 1050 Ti] | 1 | 4% |
| Nvidia GP106 [GeForce GTX 1060 3GB] | 1 | 4% |
| Nvidia GP104 [GeForce GTX 1080] | 1 | 4% |
| Nvidia GA106 [Geforce RTX 3050] | 1 | 4% |
| Nvidia GA102 [GeForce RTX 3090] | 1 | 4% |
| Intel Xeon E3-1200 v2/3rd Gen Core processor Graphics Controller | 1 | 4% |
| Intel GeminiLake [UHD Graphics 600] | 1 | 4% |
| Intel CometLake-S GT2 [UHD Graphics 630] | 1 | 4% |
| AMD Turks PRO [Radeon HD 7570] | 1 | 4% |
| AMD RV730 PRO [Radeon HD 4650] | 1 | 4% |
| AMD RS780C [Radeon 3100] | 1 | 4% |
| AMD Raven Ridge [Radeon Vega Series / Radeon Vega Mobile Series] | 1 | 4% |
| AMD Navi 10 [Radeon RX 5600 OEM/5600 XT / 5700/5700 XT] | 1 | 4% |
| AMD Cezanne | 1 | 4% |
| AMD Cedar [Radeon HD 5000/6000/7350/8350 Series] | 1 | 4% |
| AMD Bonaire XTX [Radeon R7 260X/360] | 1 | 4% |
GPU Combo
Combinations of graphics cards


| Name | Desktops | Percent |
|---|---|---|
| 1 x Nvidia | 10 | 43.48% |
| 1 x AMD | 9 | 39.13% |
| 1 x Intel | 2 | 8.7% |
| Intel + AMD | 1 | 4.35% |
| AMD + Nvidia | 1 | 4.35% |
GPU Driver
Free vs proprietary


| Driver | Desktops | Percent |
|---|---|---|
| Free | 13 | 56.52% |
| Proprietary | 7 | 30.43% |
| Unknown | 3 | 13.04% |
GPU Memory
Total video memory


| Size in GB | Desktops | Percent |
|---|---|---|
| 7.01-8.0 | 8 | 34.78% |
| Unknown | 8 | 34.78% |
| 0.51-1.0 | 3 | 13.04% |
| 1.01-2.0 | 2 | 8.7% |
| 5.01-6.0 | 1 | 4.35% |
| 0.01-0.5 | 1 | 4.35% |
Monitor
Monitor Vendor
Monitor vendors

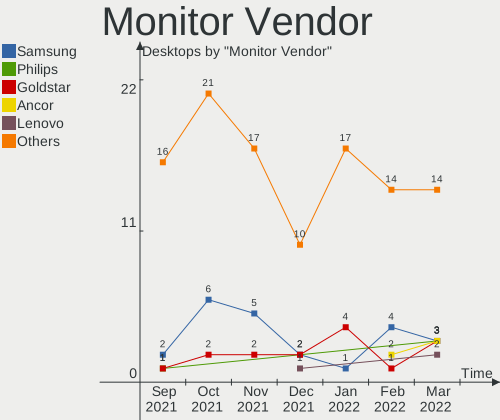
| Vendor | Desktops | Percent |
|---|---|---|
| Samsung Electronics | 3 | 10.71% |
| Philips | 3 | 10.71% |
| Goldstar | 3 | 10.71% |
| Ancor Communications | 3 | 10.71% |
| Lenovo | 2 | 7.14% |
| Hewlett-Packard | 2 | 7.14% |
| AOC | 2 | 7.14% |
| ViewSonic | 1 | 3.57% |
| Onkyo | 1 | 3.57% |
| LYC | 1 | 3.57% |
| LG Electronics | 1 | 3.57% |
| KTC | 1 | 3.57% |
| Iiyama | 1 | 3.57% |
| Gigabyte Technology | 1 | 3.57% |
| Dell | 1 | 3.57% |
| BenQ | 1 | 3.57% |
| ASUSTek Computer | 1 | 3.57% |
Monitor Model
Monitor models


| Model | Desktops | Percent |
|---|---|---|
| ViewSonic VX2458-mhd VSC0437 1920x1080 521x293mm 23.5-inch | 1 | 3.45% |
| Samsung Electronics SyncMaster SAM05CC 1920x1080 530x300mm 24.0-inch | 1 | 3.45% |
| Samsung Electronics SMS27A850 SAM083D 2560x1440 518x324mm 24.1-inch | 1 | 3.45% |
| Samsung Electronics S22B300 SAM08C8 1920x1080 477x268mm 21.5-inch | 1 | 3.45% |
| Philips PHL 273V7 PHLC156 1920x1080 598x336mm 27.0-inch | 1 | 3.45% |
| Philips PHL 242M8 PHLC214 1920x1080 527x296mm 23.8-inch | 1 | 3.45% |
| Philips LCD Monitor PHL 275S1 2560x1440 | 1 | 3.45% |
| Onkyo TX-NR535 ONK0E51 2560x1440 597x336mm 27.0-inch | 1 | 3.45% |
| LYC L2106 LYC0001 1920x1080 476x268mm 21.5-inch | 1 | 3.45% |
| LG Electronics LCD Monitor E2351 1920x1080 | 1 | 3.45% |
| Lenovo M14t LEN62A3 1920x1080 309x174mm 14.0-inch | 1 | 3.45% |
| Lenovo LEN Q27h-10 LEN66A7 2560x1440 598x336mm 27.0-inch | 1 | 3.45% |
| KTC Q2711SH KTC2700 2560x1440 597x336mm 27.0-inch | 1 | 3.45% |
| Iiyama PL2792Q IVM6637 2560x1440 597x336mm 27.0-inch | 1 | 3.45% |
| Iiyama PL2792Q IVM6630 2560x1440 600x340mm 27.2-inch | 1 | 3.45% |
| Hewlett-Packard LP2475w HWP26F9 1920x1200 546x352mm 25.6-inch | 1 | 3.45% |
| Hewlett-Packard 27fh HPN354A 1920x1080 598x336mm 27.0-inch | 1 | 3.45% |
| Goldstar ULTRAGEAR GSM5BB4 2560x1440 597x336mm 27.0-inch | 1 | 3.45% |
| Goldstar E1942 GSM4C09 1366x768 410x230mm 18.5-inch | 1 | 3.45% |
| Goldstar 27GL850 GSM5B7F 2560x1440 597x336mm 27.0-inch | 1 | 3.45% |
| Gigabyte Technology G34WQC GBT3400 3440x1440 800x330mm 34.1-inch | 1 | 3.45% |
| Dell P2319H DELD0D6 1920x1080 509x286mm 23.0-inch | 1 | 3.45% |
| BenQ G2200W BNQ780E 1680x1050 473x297mm 22.0-inch | 1 | 3.45% |
| ASUSTek Computer VG249 AUS2421 1920x1080 527x296mm 23.8-inch | 1 | 3.45% |
| AOC 2757 AOC2757 1920x1080 598x336mm 27.0-inch | 1 | 3.45% |
| AOC 24B2W1 AOC2402 1920x1080 527x296mm 23.8-inch | 1 | 3.45% |
| Ancor Communications VX239 ACI23E1 1920x1080 510x290mm 23.1-inch | 1 | 3.45% |
| Ancor Communications ASUS VS247 ACI249A 1920x1080 521x293mm 23.5-inch | 1 | 3.45% |
| Ancor Communications ASUS VN247 ACI24C3 1920x1080 521x293mm 23.5-inch | 1 | 3.45% |
Monitor Resolution
Monitor screen resolution


| Resolution | Desktops | Percent |
|---|---|---|
| 1920x1080 (FHD) | 12 | 52.17% |
| 2560x1440 (QHD) | 6 | 26.09% |
| 3840x2160 (4K) | 1 | 4.35% |
| 3440x1440 | 1 | 4.35% |
| 1920x1200 (WUXGA) | 1 | 4.35% |
| 1680x1050 (WSXGA+) | 1 | 4.35% |
| 1366x768 (WXGA) | 1 | 4.35% |
Monitor Diagonal
Diagonal size in inches


| Inches | Desktops | Percent |
|---|---|---|
| 27 | 7 | 25.93% |
| 23 | 7 | 25.93% |
| 24 | 3 | 11.11% |
| 21 | 2 | 7.41% |
| Unknown | 2 | 7.41% |
| 49 | 1 | 3.7% |
| 34 | 1 | 3.7% |
| 25 | 1 | 3.7% |
| 22 | 1 | 3.7% |
| 18 | 1 | 3.7% |
| 14 | 1 | 3.7% |
Monitor Width
Physical width


| Width in mm | Desktops | Percent |
|---|---|---|
| 501-600 | 13 | 59.09% |
| 401-500 | 4 | 18.18% |
| Unknown | 2 | 9.09% |
| 701-800 | 1 | 4.55% |
| 301-350 | 1 | 4.55% |
| 1001-1500 | 1 | 4.55% |
Aspect Ratio
Proportional relationship between the width and the height


| Ratio | Desktops | Percent |
|---|---|---|
| 16/9 | 14 | 70% |
| 16/10 | 3 | 15% |
| Unknown | 2 | 10% |
| 21/9 | 1 | 5% |
Monitor Area
Area in inch²


| Area in inch² | Desktops | Percent |
|---|---|---|
| 201-250 | 10 | 38.46% |
| 301-350 | 7 | 26.92% |
| 251-300 | 2 | 7.69% |
| Unknown | 2 | 7.69% |
| More than 1000 | 1 | 3.85% |
| 81-90 | 1 | 3.85% |
| 351-500 | 1 | 3.85% |
| 151-200 | 1 | 3.85% |
| 141-150 | 1 | 3.85% |
Pixel Density
Pixels per inch


| Density | Desktops | Percent |
|---|---|---|
| 51-100 | 13 | 56.52% |
| 101-120 | 7 | 30.43% |
| Unknown | 2 | 8.7% |
| 121-160 | 1 | 4.35% |
Multiple Monitors
Total monitors connected


| Total | Desktops | Percent |
|---|---|---|
| 1 | 11 | 47.83% |
| 2 | 6 | 26.09% |
| 0 | 4 | 17.39% |
| 4 | 1 | 4.35% |
| 3 | 1 | 4.35% |
Network
Net Controller Vendor
Controller vendors


| Vendor | Desktops | Percent |
|---|---|---|
| Intel | 14 | 50% |
| Realtek Semiconductor | 11 | 39.29% |
| MEDIATEK | 1 | 3.57% |
| Broadcom | 1 | 3.57% |
| Aquantia | 1 | 3.57% |
Net Controller Model
Controller models


| Model | Desktops | Percent |
|---|---|---|
| Realtek RTL8111/8168/8411 PCI Express Gigabit Ethernet Controller | 7 | 18.92% |
| Intel Ethernet Controller I225-V | 4 | 10.81% |
| Intel Ethernet Connection (2) I219-V | 4 | 10.81% |
| Realtek RTL8125 2.5GbE Controller | 3 | 8.11% |
| Intel Wi-Fi 6 AX200 | 3 | 8.11% |
| Intel Tiger Lake PCH CNVi WiFi | 3 | 8.11% |
| Intel 82574L Gigabit Network Connection | 2 | 5.41% |
| Realtek RTL8812AE 802.11ac PCIe Wireless Network Adapter | 1 | 2.7% |
| Realtek Killer E2600 Gigabit Ethernet Controller | 1 | 2.7% |
| MEDIATEK RZ608 Wi-Fi 6E 80MHz | 1 | 2.7% |
| Intel Wireless-AC 9260 | 1 | 2.7% |
| Intel I211 Gigabit Network Connection | 1 | 2.7% |
| Intel Ethernet Connection (7) I219-V | 1 | 2.7% |
| Intel Ethernet Connection (11) I219-LM | 1 | 2.7% |
| Intel Cannon Lake PCH CNVi WiFi | 1 | 2.7% |
| Intel 82579V Gigabit Network Connection | 1 | 2.7% |
| Broadcom BCM4360 802.11ac Wireless Network Adapter | 1 | 2.7% |
| Aquantia AQC111 NBase-T/IEEE 802.3bz Ethernet Controller [AQtion] | 1 | 2.7% |
Wireless Vendor
Wireless vendors


| Vendor | Desktops | Percent |
|---|---|---|
| Intel | 8 | 72.73% |
| Realtek Semiconductor | 1 | 9.09% |
| MEDIATEK | 1 | 9.09% |
| Broadcom | 1 | 9.09% |
Wireless Model
Wireless models


| Model | Desktops | Percent |
|---|---|---|
| Intel Wi-Fi 6 AX200 | 3 | 27.27% |
| Intel Tiger Lake PCH CNVi WiFi | 3 | 27.27% |
| Realtek RTL8812AE 802.11ac PCIe Wireless Network Adapter | 1 | 9.09% |
| MEDIATEK RZ608 Wi-Fi 6E 80MHz | 1 | 9.09% |
| Intel Wireless-AC 9260 | 1 | 9.09% |
| Intel Cannon Lake PCH CNVi WiFi | 1 | 9.09% |
| Broadcom BCM4360 802.11ac Wireless Network Adapter | 1 | 9.09% |
Ethernet Vendor
Ethernet vendors


| Vendor | Desktops | Percent |
|---|---|---|
| Intel | 12 | 50% |
| Realtek Semiconductor | 11 | 45.83% |
| Aquantia | 1 | 4.17% |
Ethernet Model
Ethernet models


| Model | Desktops | Percent |
|---|---|---|
| Realtek RTL8111/8168/8411 PCI Express Gigabit Ethernet Controller | 7 | 26.92% |
| Intel Ethernet Controller I225-V | 4 | 15.38% |
| Intel Ethernet Connection (2) I219-V | 4 | 15.38% |
| Realtek RTL8125 2.5GbE Controller | 3 | 11.54% |
| Intel 82574L Gigabit Network Connection | 2 | 7.69% |
| Realtek Killer E2600 Gigabit Ethernet Controller | 1 | 3.85% |
| Intel I211 Gigabit Network Connection | 1 | 3.85% |
| Intel Ethernet Connection (7) I219-V | 1 | 3.85% |
| Intel Ethernet Connection (11) I219-LM | 1 | 3.85% |
| Intel 82579V Gigabit Network Connection | 1 | 3.85% |
| Aquantia AQC111 NBase-T/IEEE 802.3bz Ethernet Controller [AQtion] | 1 | 3.85% |
Net Controller Kind
Ethernet, WiFi or modem


| Kind | Desktops | Percent |
|---|---|---|
| Ethernet | 23 | 67.65% |
| WiFi | 11 | 32.35% |
Used Controller
Currently used network controller


| Kind | Desktops | Percent |
|---|---|---|
| Ethernet | 20 | 80% |
| WiFi | 5 | 20% |
NICs
Total network controllers on board


| Total | Desktops | Percent |
|---|---|---|
| 2 | 11 | 47.83% |
| 1 | 10 | 43.48% |
| 3 | 2 | 8.7% |
IPv6
IPv6 vs IPv4


| Used | Desktops | Percent |
|---|---|---|
| No | 17 | 73.91% |
| Yes | 6 | 26.09% |
Bluetooth
Bluetooth Vendor
Controller vendors


| Vendor | Desktops | Percent |
|---|---|---|
| Intel | 7 | 70% |
| Cambridge Silicon Radio | 2 | 20% |
| MediaTek | 1 | 10% |
Bluetooth Model
Controller models


| Model | Desktops | Percent |
|---|---|---|
| Intel AX201 Bluetooth | 3 | 30% |
| Intel AX200 Bluetooth | 2 | 20% |
| Cambridge Silicon Radio Bluetooth Dongle (HCI mode) | 2 | 20% |
| MediaTek Wireless_Device | 1 | 10% |
| Intel Bluetooth Device | 1 | 10% |
| Intel Bluetooth 9460/9560 Jefferson Peak (JfP) | 1 | 10% |
Sound
Sound Vendor
Sound card vendors


| Vendor | Desktops | Percent |
|---|---|---|
| AMD | 14 | 33.33% |
| Intel | 11 | 26.19% |
| Nvidia | 9 | 21.43% |
| Thesycon Systemsoftware & Consulting | 1 | 2.38% |
| Sony | 1 | 2.38% |
| Sennheiser Communications | 1 | 2.38% |
| Plantronics | 1 | 2.38% |
| FiiO Electronics Technology | 1 | 2.38% |
| Comtrue | 1 | 2.38% |
| C-Media Electronics | 1 | 2.38% |
| AudioQuest | 1 | 2.38% |
Sound Model
Sound card models


| Model | Desktops | Percent |
|---|---|---|
| AMD Starship/Matisse HD Audio Controller | 6 | 12.24% |
| Intel Tiger Lake-H HD Audio Controller | 4 | 8.16% |
| Nvidia GP104 High Definition Audio Controller | 3 | 6.12% |
| AMD Ellesmere HDMI Audio [Radeon RX 470/480 / 570/580/590] | 3 | 6.12% |
| Nvidia TU106 High Definition Audio Controller | 2 | 4.08% |
| Intel 200 Series PCH HD Audio | 2 | 4.08% |
| Intel 100 Series/C230 Series Chipset Family HD Audio Controller | 2 | 4.08% |
| AMD SBx00 Azalia (Intel HDA) | 2 | 4.08% |
| AMD Family 17h/19h HD Audio Controller | 2 | 4.08% |
| Thesycon Systemsoftware & Consulting D30 Pro | 1 | 2.04% |
| Sony DualShock 4 [CUH-ZCT2x] | 1 | 2.04% |
| Sennheiser Communications GSX 1200 Pro Main Audio | 1 | 2.04% |
| Plantronics RIG 800HD | 1 | 2.04% |
| Nvidia GP107GL High Definition Audio Controller | 1 | 2.04% |
| Nvidia GP106 High Definition Audio Controller | 1 | 2.04% |
| Nvidia GA102 High Definition Audio Controller | 1 | 2.04% |
| Nvidia Audio device | 1 | 2.04% |
| Intel Comet Lake PCH cAVS | 1 | 2.04% |
| Intel Cannon Lake PCH cAVS | 1 | 2.04% |
| Intel 6 Series/C200 Series Chipset Family High Definition Audio Controller | 1 | 2.04% |
| FiiO Electronics Technology BTR5 | 1 | 2.04% |
| Comtrue E1DA PowerDAC V2.1 PCM24/192 | 1 | 2.04% |
| C-Media Electronics Blue Snowball | 1 | 2.04% |
| AudioQuest DragonFly Red | 1 | 2.04% |
| AMD Turks HDMI Audio [Radeon HD 6500/6600 / 6700M Series] | 1 | 2.04% |
| AMD Tobago HDMI Audio [Radeon R7 360 / R9 360 OEM] | 1 | 2.04% |
| AMD RV710/730 HDMI Audio [Radeon HD 4000 series] | 1 | 2.04% |
| AMD Renoir Radeon High Definition Audio Controller | 1 | 2.04% |
| AMD Raven/Raven2/Fenghuang HDMI/DP Audio Controller | 1 | 2.04% |
| AMD Navi 10 HDMI Audio | 1 | 2.04% |
| AMD Family 17h (Models 00h-0fh) HD Audio Controller | 1 | 2.04% |
| AMD Cedar HDMI Audio [Radeon HD 5400/6300/7300 Series] | 1 | 2.04% |
Memory
Memory Vendor
Memory module vendors


| Vendor | Desktops | Percent |
|---|---|---|
| Kingston | 6 | 27.27% |
| Corsair | 4 | 18.18% |
| Crucial | 3 | 13.64% |
| Micron Technology | 2 | 9.09% |
| G.Skill | 2 | 9.09% |
| Unknown | 1 | 4.55% |
| Transcend | 1 | 4.55% |
| Thermaltake | 1 | 4.55% |
| Team | 1 | 4.55% |
| A-DATA Technology | 1 | 4.55% |
Memory Model
Memory module models


| Model | Desktops | Percent |
|---|---|---|
| Kingston RAM KHX3200C16D4/16GX 16384MB DIMM DDR4 3600MT/s | 2 | 8% |
| Unknown RAM Module 2GB DIMM DDR2 667MT/s | 1 | 4% |
| Transcend RAM TS512MLK64V3H 4GB DIMM DDR3 1333MT/s | 1 | 4% |
| Transcend RAM JM1333KLH-4G 4GB DIMM DDR3 1333MT/s | 1 | 4% |
| Thermaltake RAM R009R432GX2-3600C18A 32GB DIMM DDR4 3600MT/s | 1 | 4% |
| Team RAM TEAMGROUP-UD4-3200 16384MB DIMM DDR4 3733MT/s | 1 | 4% |
| Micron RAM 8ATF1G64HZ-2G6E1 8GB SODIMM DDR4 2667MT/s | 1 | 4% |
| Micron RAM 8ATF1G64AZ-3G2J1 8GB DIMM DDR4 3200MT/s | 1 | 4% |
| Kingston RAM XVTW4H-MIE 32GB DIMM DDR4 3200MT/s | 1 | 4% |
| Kingston RAM KHX2400C11D3/8GX 8GB DIMM DDR3 2400MT/s | 1 | 4% |
| Kingston RAM KHX2133C14D4/4G 4096MB DIMM DDR4 2933MT/s | 1 | 4% |
| Kingston RAM KHX2133C14/8G 8GB DIMM DDR4 2400MT/s | 1 | 4% |
| Kingston RAM HX426C16FB/8 8GB DIMM DDR4 2667MT/s | 1 | 4% |
| G.Skill RAM Module 16GB DIMM DDR4 2133MT/s | 1 | 4% |
| G.Skill RAM F4-3600C16-16GTZN 16GB DIMM DDR4 3733MT/s | 1 | 4% |
| Crucial RAM CT8G4SFS8266.M8FE 8GB SODIMM DDR4 2667MT/s | 1 | 4% |
| Crucial RAM BL8G32C16U4R.M8FE1 8GB DIMM DDR4 3400MT/s | 1 | 4% |
| Crucial RAM BL32G32C16U4B.M16FB1 32GB DIMM DDR4 3200MT/s | 1 | 4% |
| Corsair RAM CMK8GX4M1A2400C14 8GB DIMM DDR4 2667MT/s | 1 | 4% |
| Corsair RAM CMK32GX4M2B3000C15 16GB DIMM DDR4 3000MT/s | 1 | 4% |
| Corsair RAM CMK16GX4M2B3200C16 8192MB DIMM DDR4 3600MT/s | 1 | 4% |
| Corsair RAM CMK16GX4M2B3000C15 8GB DIMM DDR4 3000MT/s | 1 | 4% |
| Corsair RAM CMK16GX4M2A2666C16 8GB DIMM DDR4 3200MT/s | 1 | 4% |
| A-DATA RAM DDR4 3200 8GB DIMM DDR4 3200MT/s | 1 | 4% |
Memory Kind
Memory module kinds


| Kind | Desktops | Percent |
|---|---|---|
| DDR4 | 18 | 85.71% |
| DDR3 | 2 | 9.52% |
| DDR2 | 1 | 4.76% |
Memory Form Factor
Physical design of the memory module


| Name | Desktops | Percent |
|---|---|---|
| DIMM | 20 | 95.24% |
| SODIMM | 1 | 4.76% |
Memory Size
Memory module size


| Size | Desktops | Percent |
|---|---|---|
| 8192 | 10 | 43.48% |
| 32768 | 5 | 21.74% |
| 16384 | 5 | 21.74% |
| 4096 | 2 | 8.7% |
| 2048 | 1 | 4.35% |
Memory Speed
Memory module speed


| Speed | Desktops | Percent |
|---|---|---|
| 3200 | 5 | 21.74% |
| 3600 | 4 | 17.39% |
| 2667 | 3 | 13.04% |
| 3733 | 2 | 8.7% |
| 2400 | 2 | 8.7% |
| 3466 | 1 | 4.35% |
| 3400 | 1 | 4.35% |
| 3000 | 1 | 4.35% |
| 2933 | 1 | 4.35% |
| 2133 | 1 | 4.35% |
| 1333 | 1 | 4.35% |
| 667 | 1 | 4.35% |
Printers & scanners
Printer Vendor
Printer device vendors


| Vendor | Desktops | Percent |
|---|---|---|
| Hewlett-Packard | 1 | 100% |
Printer Model
Printer device models


| Model | Desktops | Percent |
|---|---|---|
| HP LaserJet M14-M17 | 1 | 100% |
Scanner Vendor
Scanner device vendors
Zero info for selected period =(
Scanner Model
Scanner device models
Zero info for selected period =(
Camera
Camera Vendor
Camera device vendors


| Vendor | Desktops | Percent |
|---|---|---|
| Logitech | 3 | 100% |
Camera Model
Camera device models


| Model | Desktops | Percent |
|---|---|---|
| Logitech Webcam C270 | 2 | 66.67% |
| Logitech HD Pro Webcam C920 | 1 | 33.33% |
Security
Fingerprint Vendor
Fingerprint sensor vendors
Zero info for selected period =(
Fingerprint Model
Fingerprint sensor models
Zero info for selected period =(
Chipcard Vendor
Chipcard module vendors
Zero info for selected period =(
Chipcard Model
Chipcard module models
Zero info for selected period =(
Unsupported
Unsupported Devices
Total unsupported devices on board


| Total | Desktops | Percent |
|---|---|---|
| 0 | 14 | 60.87% |
| 1 | 6 | 26.09% |
| 4 | 1 | 4.35% |
| 3 | 1 | 4.35% |
| 2 | 1 | 4.35% |
Unsupported Device Types
Types of unsupported devices


| Type | Desktops | Percent |
|---|---|---|
| Graphics card | 4 | 33.33% |
| Sound | 2 | 16.67% |
| Net/wireless | 2 | 16.67% |
| Storage/raid | 1 | 8.33% |
| Storage/ata | 1 | 8.33% |
| Net/ethernet | 1 | 8.33% |
| Bluetooth | 1 | 8.33% |