BlackPanther Hardware Trends (Desktops)
A project to identify most popular hardware characteristics and track their change over time based on data collected by BlackPanther users at https://Linux-Hardware.org.
Anyone can contribute to this report by the hw-probe tool:
sudo -E hw-probe -all -uploadFull-feature report is available here: https://linux-hardware.org/?view=trends
Period: Nov, 2021.
Contents
System
OS
Installed operating systems


| Name | Desktops | Percent |
|---|---|---|
| BlackPanther 18.1 | 37 | 100% |
OS Family
OS without a version


| Name | Desktops | Percent |
|---|---|---|
| BlackPanther | 37 | 100% |
Kernel
Version of the Linux kernel


| Version | Desktops | Percent |
|---|---|---|
| 5.6.14-desktop-2bP | 25 | 67.57% |
| 4.18.16-desktop-1bP | 12 | 32.43% |
Kernel Family
Linux kernel without a distro release


| Version | Desktops | Percent |
|---|---|---|
| 5.6.14 | 25 | 67.57% |
| 4.18.16 | 12 | 32.43% |
Kernel Major Ver.
Linux kernel major version


| Version | Desktops | Percent |
|---|---|---|
| 5.6 | 25 | 67.57% |
| 4.18 | 12 | 32.43% |
Arch
OS architecture (x86_64, i586, etc.)


| Name | Desktops | Percent |
|---|---|---|
| x86_64 | 37 | 100% |
DE
Desktop Environment


| Name | Desktops | Percent |
|---|---|---|
| KDE5 | 37 | 100% |
Display Server
X11 or Wayland


| Name | Desktops | Percent |
|---|---|---|
| X11 | 37 | 100% |
Display Manager
SDDM, LightDM, etc.


| Name | Desktops | Percent |
|---|---|---|
| SDDM | 37 | 100% |
OS Lang
Language


| Lang | Desktops | Percent |
|---|---|---|
| Unknown | 37 | 100% |
Boot Mode
EFI or BIOS


| Mode | Desktops | Percent |
|---|---|---|
| BIOS | 24 | 64.86% |
| EFI | 13 | 35.14% |
Filesystem
Type of filesystem


| Type | Desktops | Percent |
|---|---|---|
| Overlay | 36 | 97.3% |
| Ext4 | 1 | 2.7% |
Part. scheme
Scheme of partitioning


| Type | Desktops | Percent |
|---|---|---|
| MBR | 23 | 62.16% |
| GPT | 14 | 37.84% |
Dual Boot with Linux/BSD
Hosting more than one Linux/BSD


| Dual boot | Desktops | Percent |
|---|---|---|
| Yes | 20 | 54.05% |
| No | 17 | 45.95% |
Dual Boot (Win)
Hosting Linux and Windows


| Dual boot | Desktops | Percent |
|---|---|---|
| Yes | 22 | 59.46% |
| No | 15 | 40.54% |
Board
Vendor
Motherboard manufacturer


| Name | Desktops | Percent |
|---|---|---|
| Gigabyte Technology | 8 | 21.62% |
| ASUSTek Computer | 8 | 21.62% |
| Dell | 5 | 13.51% |
| Hewlett-Packard | 4 | 10.81% |
| ASRock | 4 | 10.81% |
| Fujitsu | 3 | 8.11% |
| Medion | 2 | 5.41% |
| Shanghai Zhaoxin Semiconductor | 1 | 2.7% |
| MSI | 1 | 2.7% |
| Lenovo | 1 | 2.7% |
Model
Motherboard model


| Name | Desktops | Percent |
|---|---|---|
| Shanghai Zhaoxin ZXE CRB | 1 | 2.7% |
| MSI PPPPP-CCC#MMMMMMMM | 1 | 2.7% |
| Medion MS-7748 | 1 | 2.7% |
| Medion MS-7646 | 1 | 2.7% |
| Lenovo 7052-A9G | 1 | 2.7% |
| HP ProDesk 600 G2 SFF | 1 | 2.7% |
| HP Compaq Pro 6300 MT | 1 | 2.7% |
| HP Compaq 8100 Elite CMT PC | 1 | 2.7% |
| HP Compaq 6005 Pro MT PC | 1 | 2.7% |
| Gigabyte P67A-D3-B3 | 1 | 2.7% |
| Gigabyte J4005ND2P-CF | 1 | 2.7% |
| Gigabyte H510M H | 1 | 2.7% |
| Gigabyte H110M-S2H | 1 | 2.7% |
| Gigabyte GA-E350N | 1 | 2.7% |
| Gigabyte G41MT-S2PT | 1 | 2.7% |
| Gigabyte B450M S2H | 1 | 2.7% |
| Gigabyte B450M GAMING | 1 | 2.7% |
| Fujitsu ESPRIMO P720 | 1 | 2.7% |
| Fujitsu ESPRIMO P710 | 1 | 2.7% |
| Fujitsu ESPRIMO E910 | 1 | 2.7% |
| Dell OptiPlex GX620 | 1 | 2.7% |
| Dell OptiPlex 9020 | 1 | 2.7% |
| Dell OptiPlex 9010 | 1 | 2.7% |
| Dell OptiPlex 7010 | 1 | 2.7% |
| Dell OptiPlex 330 | 1 | 2.7% |
| ASUS PRIME H270-PLUS | 1 | 2.7% |
| ASUS PRIME B450-PLUS | 1 | 2.7% |
| ASUS PRIME A320M-R | 1 | 2.7% |
| ASUS P6T7 WS SUPERCOMPUTER | 1 | 2.7% |
| ASUS P5KPL-AM IN/ROEM/SI | 1 | 2.7% |
| ASUS P5B-PLUS Series | 1 | 2.7% |
| ASUS H110-PLUS | 1 | 2.7% |
| ASUS All Series | 1 | 2.7% |
| ASRock ION3D-HT | 1 | 2.7% |
| ASRock G31M-GS | 1 | 2.7% |
| ASRock FM2A75M Pro4+ | 1 | 2.7% |
| ASRock B85M Pro4 | 1 | 2.7% |
Model Family
Motherboard model prefix


| Name | Desktops | Percent |
|---|---|---|
| Dell OptiPlex | 5 | 13.51% |
| HP Compaq | 3 | 8.11% |
| Fujitsu ESPRIMO | 3 | 8.11% |
| ASUS PRIME | 3 | 8.11% |
| Gigabyte B450M | 2 | 5.41% |
| Shanghai Zhaoxin ZXE | 1 | 2.7% |
| MSI PPPPP-CCC#MMMMMMMM | 1 | 2.7% |
| Medion MS-7748 | 1 | 2.7% |
| Medion MS-7646 | 1 | 2.7% |
| Lenovo 7052-A9G | 1 | 2.7% |
| HP ProDesk | 1 | 2.7% |
| Gigabyte P67A-D3-B3 | 1 | 2.7% |
| Gigabyte J4005ND2P-CF | 1 | 2.7% |
| Gigabyte H510M | 1 | 2.7% |
| Gigabyte H110M-S2H | 1 | 2.7% |
| Gigabyte GA-E350N | 1 | 2.7% |
| Gigabyte G41MT-S2PT | 1 | 2.7% |
| ASUS P6T7 | 1 | 2.7% |
| ASUS P5KPL-AM | 1 | 2.7% |
| ASUS P5B-PLUS | 1 | 2.7% |
| ASUS H110-PLUS | 1 | 2.7% |
| ASUS All | 1 | 2.7% |
| ASRock ION3D-HT | 1 | 2.7% |
| ASRock G31M-GS | 1 | 2.7% |
| ASRock FM2A75M | 1 | 2.7% |
| ASRock B85M | 1 | 2.7% |
MFG Year
Motherboard manufacture year


| Year | Desktops | Percent |
|---|---|---|
| 2018 | 5 | 13.51% |
| 2011 | 5 | 13.51% |
| 2014 | 4 | 10.81% |
| 2012 | 4 | 10.81% |
| 2010 | 4 | 10.81% |
| 2021 | 3 | 8.11% |
| 2013 | 3 | 8.11% |
| 2019 | 2 | 5.41% |
| 2017 | 2 | 5.41% |
| 2009 | 2 | 5.41% |
| 2020 | 1 | 2.7% |
| 2008 | 1 | 2.7% |
| 2006 | 1 | 2.7% |
Form Factor
Physical design of the computer


| Name | Desktops | Percent |
|---|---|---|
| Desktop | 37 | 100% |
Secure Boot
Enabled or disabled


| State | Desktops | Percent |
|---|---|---|
| Disabled | 37 | 100% |
Coreboot
Have coreboot on board


| Used | Desktops | Percent |
|---|---|---|
| No | 37 | 100% |
RAM Size
Total RAM memory


| Size in GB | Desktops | Percent |
|---|---|---|
| 3.01-4.0 | 14 | 37.84% |
| 8.01-16.0 | 12 | 32.43% |
| 4.01-8.0 | 5 | 13.51% |
| 16.01-24.0 | 5 | 13.51% |
| 24.01-32.0 | 1 | 2.7% |
RAM Used
Used RAM memory


| Used GB | Desktops | Percent |
|---|---|---|
| 0.01-0.5 | 27 | 72.97% |
| 0.51-1.0 | 7 | 18.92% |
| 1.01-2.0 | 3 | 8.11% |
Total Drives
Number of drives on board


| Drives | Desktops | Percent |
|---|---|---|
| 1 | 19 | 51.35% |
| 2 | 13 | 35.14% |
| 5 | 2 | 5.41% |
| 3 | 2 | 5.41% |
| 9 | 1 | 2.7% |
Has CD-ROM
Has CD-ROM on board


| Presented | Desktops | Percent |
|---|---|---|
| Yes | 29 | 78.38% |
| No | 8 | 21.62% |
Has Ethernet
Has Ethernet on board


| Presented | Desktops | Percent |
|---|---|---|
| Yes | 37 | 100% |
Has WiFi
Has WiFi module


| Presented | Desktops | Percent |
|---|---|---|
| No | 29 | 78.38% |
| Yes | 8 | 21.62% |
Has Bluetooth
Has Bluetooth module


| Presented | Desktops | Percent |
|---|---|---|
| No | 30 | 81.08% |
| Yes | 7 | 18.92% |
Location
Country
Geographic location (country)


| Country | Desktops | Percent |
|---|---|---|
| Hungary | 34 | 91.89% |
| Spain | 1 | 2.7% |
| China | 1 | 2.7% |
| Belgium | 1 | 2.7% |
City
Geographic location (city)


| City | Desktops | Percent |
|---|---|---|
| Budapest | 5 | 13.51% |
| Veresegyhaz | 2 | 5.41% |
| P?cs | 2 | 5.41% |
| Debrecen | 2 | 5.41% |
| Vemend | 1 | 2.7% |
| Turkeve | 1 | 2.7% |
| Szolnok | 1 | 2.7% |
| Roszke | 1 | 2.7% |
| Pilismarot | 1 | 2.7% |
| Paszto | 1 | 2.7% |
| Nyirtass | 1 | 2.7% |
| Mezokovesd | 1 | 2.7% |
| Lebeny | 1 | 2.7% |
| Koszeg | 1 | 2.7% |
| Kecsked | 1 | 2.7% |
| Karcag | 1 | 2.7% |
| Kal | 1 | 2.7% |
| Jerez de la Frontera | 1 | 2.7% |
| Jaszdozsa | 1 | 2.7% |
| Huy | 1 | 2.7% |
| Hodmezovasarhely | 1 | 2.7% |
| G?d?ll? | 1 | 2.7% |
| Fuzesabony | 1 | 2.7% |
| Farmos | 1 | 2.7% |
| Esztergom | 1 | 2.7% |
| Dalian | 1 | 2.7% |
| Cserepfalu | 1 | 2.7% |
| Balatonfured | 1 | 2.7% |
| Alsozsolca | 1 | 2.7% |
| Ajka | 1 | 2.7% |
Drives
Drive Vendor
Hard drive vendors


| Vendor | Desktops | Drives | Percent |
|---|---|---|---|
| WDC | 13 | 16 | 20.63% |
| Kingston | 11 | 11 | 17.46% |
| Samsung Electronics | 9 | 12 | 14.29% |
| Seagate | 7 | 10 | 11.11% |
| Toshiba | 6 | 6 | 9.52% |
| A-DATA Technology | 3 | 3 | 4.76% |
| Team | 2 | 2 | 3.17% |
| China | 2 | 2 | 3.17% |
| Transcend | 1 | 1 | 1.59% |
| Teclast | 1 | 1 | 1.59% |
| SPCC | 1 | 1 | 1.59% |
| sobetter | 1 | 1 | 1.59% |
| SK Hynix | 1 | 1 | 1.59% |
| Hitachi | 1 | 1 | 1.59% |
| HGST | 1 | 1 | 1.59% |
| Gigabyte Technology | 1 | 1 | 1.59% |
| Crucial | 1 | 1 | 1.59% |
| Apacer | 1 | 1 | 1.59% |
Drive Model
Hard drive models


| Model | Desktops | Percent |
|---|---|---|
| Kingston SA400S37240G 240GB SSD | 4 | 5.63% |
| Kingston SA400S37120G 120GB SSD | 3 | 4.23% |
| Seagate ST500DM002-1BD142 500GB | 2 | 2.82% |
| WDC WD5000AVCS-982DY1 500GB | 1 | 1.41% |
| WDC WD5000AAKX-75U6AA0 500GB | 1 | 1.41% |
| WDC WD5000AAKX-60U6AA0 500GB | 1 | 1.41% |
| WDC WD5000AAKX-08U6AA0 500GB | 1 | 1.41% |
| WDC WD40 EZAZ-00SF3B0 4TB | 1 | 1.41% |
| WDC WD3200LPLX-00ZNTT0 320GB | 1 | 1.41% |
| WDC WD30EZRZ-00GXCB0 3TB | 1 | 1.41% |
| WDC WD30EFRX-68EUZN0 3TB | 1 | 1.41% |
| WDC WD2500AAKX-221CA1 250GB | 1 | 1.41% |
| WDC WD2500AAJS-07M0A0 250GB | 1 | 1.41% |
| WDC WD20EZRZ-00Z5HB0 2TB | 1 | 1.41% |
| WDC WD1600BEVT-22ZCT0 160GB | 1 | 1.41% |
| WDC WD1600AAJB-56WRA0 160GB | 1 | 1.41% |
| WDC WD1500HLFS-01MZUV0 150GB | 1 | 1.41% |
| WDC WD10EZRX-00A8LB0 1TB | 1 | 1.41% |
| WDC WD10EZEX-08WN4A0 1TB | 1 | 1.41% |
| Transcend TS128GMTE110S 128GB | 1 | 1.41% |
| Toshiba Q300. 240GB SSD | 1 | 1.41% |
| Toshiba MQ04ABF100 1TB | 1 | 1.41% |
| Toshiba MQ01ABF050 500GB | 1 | 1.41% |
| Toshiba HDWD220 2TB | 1 | 1.41% |
| Toshiba HDWD130 3TB | 1 | 1.41% |
| Toshiba DT01ACA050 500GB | 1 | 1.41% |
| Teclast 256GB A850 SSD | 1 | 1.41% |
| Team T253X1240G 240GB SSD | 1 | 1.41% |
| Team L7 EVO SSD 60GB | 1 | 1.41% |
| SPCC M.2 PCIe SSD 512GB | 1 | 1.41% |
| sobetter EXT 1TB | 1 | 1.41% |
| SK Hynix PC300 NVMe 1TB | 1 | 1.41% |
| Seagate ST96812AS 64GB | 1 | 1.41% |
| Seagate ST9250315AS 250GB | 1 | 1.41% |
| Seagate ST4000DM 000-1F2168 4TB | 1 | 1.41% |
| Seagate ST3500418AS 500GB | 1 | 1.41% |
| Seagate ST3160023AS 160GB | 1 | 1.41% |
| Seagate ST31000528AS 1TB | 1 | 1.41% |
| Seagate ST1000LM 048-2E7172 1TB | 1 | 1.41% |
| Seagate Expansion 1TB | 1 | 1.41% |
| Samsung SSD PM871b M.2 2280 256GB | 1 | 1.41% |
| Samsung SSD 970 EVO Plus 500GB | 1 | 1.41% |
| Samsung SSD 960 EVO 250GB | 1 | 1.41% |
| Samsung SSD 870 QVO 1TB | 1 | 1.41% |
| Samsung SSD 870 EVO 250GB | 1 | 1.41% |
| Samsung SSD 840 EVO 120GB | 1 | 1.41% |
| Samsung SSD 830 Series 64GB | 1 | 1.41% |
| Samsung SP2004C 200GB | 1 | 1.41% |
| Samsung HD503HI 500GB | 1 | 1.41% |
| Samsung HD501LJ 500GB | 1 | 1.41% |
| Samsung HD154UI 1TB | 1 | 1.41% |
| Kingston SV300S37A120G 120GB SSD | 1 | 1.41% |
| Kingston SUV400S37120G 120GB SSD | 1 | 1.41% |
| Kingston SA2000M8250G 250GB | 1 | 1.41% |
| Kingston SA1000M8240G 240GB | 1 | 1.41% |
| Hitachi HDS721010CLA330 1TB | 1 | 1.41% |
| HGST HTS541010B7E610 1TB | 1 | 1.41% |
| Gigabyte GP-GSTFS31120GNTD 120GB | 1 | 1.41% |
| Crucial CT480BX500SSD1 480GB | 1 | 1.41% |
| China T60 64GB SSD | 1 | 1.41% |
HDD Vendor
Hard disk drive vendors


| Vendor | Desktops | Drives | Percent |
|---|---|---|---|
| WDC | 13 | 16 | 41.94% |
| Seagate | 7 | 10 | 22.58% |
| Toshiba | 5 | 5 | 16.13% |
| Samsung Electronics | 4 | 4 | 12.9% |
| Hitachi | 1 | 1 | 3.23% |
| HGST | 1 | 1 | 3.23% |
SSD Vendor
Solid state drive vendors


| Vendor | Desktops | Drives | Percent |
|---|---|---|---|
| Kingston | 9 | 9 | 34.62% |
| Samsung Electronics | 5 | 6 | 19.23% |
| A-DATA Technology | 3 | 3 | 11.54% |
| Team | 2 | 2 | 7.69% |
| China | 2 | 2 | 7.69% |
| Toshiba | 1 | 1 | 3.85% |
| Teclast | 1 | 1 | 3.85% |
| Gigabyte Technology | 1 | 1 | 3.85% |
| Crucial | 1 | 1 | 3.85% |
| Apacer | 1 | 1 | 3.85% |
Drive Kind
HDD or SSD


| Kind | Desktops | Drives | Percent |
|---|---|---|---|
| HDD | 27 | 37 | 47.37% |
| SSD | 24 | 27 | 42.11% |
| NVMe | 5 | 7 | 8.77% |
| Unknown | 1 | 1 | 1.75% |
Drive Connector
SATA, SAS, NVMe, etc.


| Type | Desktops | Drives | Percent |
|---|---|---|---|
| SATA | 37 | 60 | 86.05% |
| NVMe | 5 | 7 | 11.63% |
| SAS | 1 | 5 | 2.33% |
Drive Size
Size of hard drive


| Size in TB | Desktops | Drives | Percent |
|---|---|---|---|
| 0.01-0.5 | 34 | 47 | 70.83% |
| 0.51-1.0 | 9 | 10 | 18.75% |
| 2.01-3.0 | 2 | 3 | 4.17% |
| 1.01-2.0 | 2 | 2 | 4.17% |
| 3.01-4.0 | 1 | 2 | 2.08% |
Space Total
Amount of disk space available on the file system


| Size in GB | Desktops | Percent |
|---|---|---|
| Unknown | 36 | 97.3% |
| 101-250 | 1 | 2.7% |
Space Used
Amount of used disk space


| Used GB | Desktops | Percent |
|---|---|---|
| Unknown | 36 | 97.3% |
| 1-20 | 1 | 2.7% |
Malfunc. Drives
Drive models with a malfunction


| Model | Desktops | Drives | Percent |
|---|---|---|---|
| WDC WD5000AAKX-08U6AA0 500GB | 1 | 1 | 5.56% |
| WDC WD2500AAKX-221CA1 250GB | 1 | 1 | 5.56% |
| WDC WD2500AAJS-07M0A0 250GB | 1 | 1 | 5.56% |
| WDC WD1500HLFS-01MZUV0 150GB | 1 | 1 | 5.56% |
| WDC WD10EZRX-00A8LB0 1TB | 1 | 1 | 5.56% |
| WDC WD10EZEX-08WN4A0 1TB | 1 | 1 | 5.56% |
| Toshiba HDWD130 3TB | 1 | 1 | 5.56% |
| Toshiba DT01ACA050 500GB | 1 | 1 | 5.56% |
| Seagate ST96812AS 64GB | 1 | 1 | 5.56% |
| Seagate ST9250315AS 250GB | 1 | 1 | 5.56% |
| Seagate ST500DM002-1BD142 500GB | 1 | 1 | 5.56% |
| Seagate ST4000DM 000-1F2168 4TB | 1 | 1 | 5.56% |
| Seagate ST3500418AS 500GB | 1 | 1 | 5.56% |
| Seagate ST3160023AS 160GB | 1 | 1 | 5.56% |
| Samsung Electronics SP2004C 200GB | 1 | 1 | 5.56% |
| Samsung Electronics HD503HI 500GB | 1 | 1 | 5.56% |
| Hitachi HDS721010CLA330 1TB | 1 | 1 | 5.56% |
| A-DATA Technology SU630 240GB SSD | 1 | 1 | 5.56% |
Malfunc. Drive Vendor
Vendors of faulty drives


| Vendor | Desktops | Drives | Percent |
|---|---|---|---|
| WDC | 6 | 6 | 35.29% |
| Seagate | 5 | 6 | 29.41% |
| Toshiba | 2 | 2 | 11.76% |
| Samsung Electronics | 2 | 2 | 11.76% |
| Hitachi | 1 | 1 | 5.88% |
| A-DATA Technology | 1 | 1 | 5.88% |
Malfunc. HDD Vendor
Vendors of faulty HDD drives


| Vendor | Desktops | Drives | Percent |
|---|---|---|---|
| WDC | 6 | 6 | 37.5% |
| Seagate | 5 | 6 | 31.25% |
| Toshiba | 2 | 2 | 12.5% |
| Samsung Electronics | 2 | 2 | 12.5% |
| Hitachi | 1 | 1 | 6.25% |
Malfunc. Drive Kind
Kinds of faulty drives


| Kind | Desktops | Drives | Percent |
|---|---|---|---|
| HDD | 15 | 17 | 93.75% |
| SSD | 1 | 1 | 6.25% |
Failed Drives
Failed drive models
Zero info for selected period =(
Failed Drive Vendor
Failed drive vendors
Zero info for selected period =(
Drive Status
Number of failed and malfunc. drives


| Status | Desktops | Drives | Percent |
|---|---|---|---|
| Works | 28 | 50 | 63.64% |
| Malfunc | 15 | 18 | 34.09% |
| Detected | 1 | 4 | 2.27% |
Storage controller
Storage Vendor
Storage controller vendors


| Vendor | Desktops | Percent |
|---|---|---|
| Intel | 27 | 58.7% |
| AMD | 9 | 19.57% |
| Samsung Electronics | 2 | 4.35% |
| Kingston Technology Company | 2 | 4.35% |
| Zhaoxin | 1 | 2.17% |
| SK Hynix | 1 | 2.17% |
| Silicon Motion | 1 | 2.17% |
| Silicon Image | 1 | 2.17% |
| Phison Electronics | 1 | 2.17% |
| JMicron Technology | 1 | 2.17% |
Storage Model
Storage controller models


| Model | Desktops | Percent |
|---|---|---|
| Intel 82801G (ICH7 Family) IDE Controller | 5 | 8.33% |
| Intel 7 Series/C210 Series Chipset Family 6-port SATA Controller [AHCI mode] | 5 | 8.33% |
| AMD FCH SATA Controller [AHCI mode] | 5 | 8.33% |
| Intel NM10/ICH7 Family SATA Controller [IDE mode] | 4 | 6.67% |
| Intel SATA Controller [RAID mode] | 3 | 5% |
| Intel Q170/Q150/B150/H170/H110/Z170/CM236 Chipset SATA Controller [AHCI Mode] | 3 | 5% |
| Intel 8 Series/C220 Series Chipset Family 6-port SATA Controller 1 [AHCI mode] | 3 | 5% |
| AMD 400 Series Chipset SATA Controller | 3 | 5% |
| AMD SB7x0/SB8x0/SB9x0 SATA Controller [IDE mode] | 2 | 3.33% |
| AMD SB7x0/SB8x0/SB9x0 IDE Controller | 2 | 3.33% |
| Zhaoxin ZX-100/ZX-200/ZX-E StorX AHCI Controller | 1 | 1.67% |
| SK Hynix PC300 NVMe Solid State Drive 1TB | 1 | 1.67% |
| Silicon Motion SM2263EN/SM2263XT SSD Controller | 1 | 1.67% |
| Silicon Image SiI 3114 [SATALink/SATARaid] Serial ATA Controller | 1 | 1.67% |
| Samsung NVMe SSD Controller SM981/PM981/PM983 | 1 | 1.67% |
| Samsung NVMe SSD Controller SM961/PM961/SM963 | 1 | 1.67% |
| Phison E12 NVMe Controller | 1 | 1.67% |
| Kingston Company U-SNS8154P3 NVMe SSD | 1 | 1.67% |
| Kingston Company A2000 NVMe SSD | 1 | 1.67% |
| JMicron JMB363 SATA/IDE Controller | 1 | 1.67% |
| Intel NM10/ICH7 Family SATA Controller [AHCI mode] | 1 | 1.67% |
| Intel Celeron/Pentium Silver Processor SATA Controller | 1 | 1.67% |
| Intel 82801JI (ICH10 Family) 4 port SATA IDE Controller #1 | 1 | 1.67% |
| Intel 82801JI (ICH10 Family) 2 port SATA IDE Controller #2 | 1 | 1.67% |
| Intel 82801HR/HO/HH (ICH8R/DO/DH) 6 port SATA Controller [AHCI mode] | 1 | 1.67% |
| Intel 82801HM/HEM (ICH8M/ICH8M-E) SATA Controller [IDE mode] | 1 | 1.67% |
| Intel 82801HM/HEM (ICH8M/ICH8M-E) IDE Controller | 1 | 1.67% |
| Intel 6 Series/C200 Series Chipset Family Desktop SATA Controller (IDE mode, ports 4-5) | 1 | 1.67% |
| Intel 6 Series/C200 Series Chipset Family Desktop SATA Controller (IDE mode, ports 0-3) | 1 | 1.67% |
| Intel 6 Series/C200 Series Chipset Family 6 port Desktop SATA AHCI Controller | 1 | 1.67% |
| Intel 500 Series Chipset Family SATA AHCI Controller | 1 | 1.67% |
| Intel 5 Series/3400 Series Chipset 6 port SATA AHCI Controller | 1 | 1.67% |
| AMD SB7x0/SB8x0/SB9x0 SATA Controller [AHCI mode] | 1 | 1.67% |
| AMD FCH SATA Controller D | 1 | 1.67% |
| AMD FCH IDE Controller | 1 | 1.67% |
Storage Kind
Kind of storage controller (IDE, SATA, NVMe, SAS, ...)


| Kind | Desktops | Percent |
|---|---|---|
| SATA | 27 | 56.25% |
| IDE | 12 | 25% |
| NVMe | 5 | 10.42% |
| RAID | 4 | 8.33% |
Processor
CPU Vendor
Processor vendors


| Vendor | Desktops | Percent |
|---|---|---|
| Intel | 27 | 72.97% |
| AMD | 9 | 24.32% |
| CentaurHauls | 1 | 2.7% |
CPU Model
Processor models


| Model | Desktops | Percent |
|---|---|---|
| Intel Core i5-6500 CPU @ 3.20GHz | 2 | 5.41% |
| Intel Core i5-3470 CPU @ 3.20GHz | 2 | 5.41% |
| Intel Core i5 CPU 650 @ 3.20GHz | 2 | 5.41% |
| Intel Pentium Dual-Core CPU E6500 @ 2.93GHz | 1 | 2.7% |
| Intel Pentium Dual-Core CPU E5700 @ 3.00GHz | 1 | 2.7% |
| Intel Pentium D CPU 3.40GHz | 1 | 2.7% |
| Intel Pentium CPU G4560 @ 3.50GHz | 1 | 2.7% |
| Intel Pentium CPU G3420 @ 3.20GHz | 1 | 2.7% |
| Intel Core i7 CPU X 980 @ 3.33GHz | 1 | 2.7% |
| Intel Core i5-4670 CPU @ 3.40GHz | 1 | 2.7% |
| Intel Core i5-4590 CPU @ 3.30GHz | 1 | 2.7% |
| Intel Core i5-3470S CPU @ 2.90GHz | 1 | 2.7% |
| Intel Core i5-2400 CPU @ 3.10GHz | 1 | 2.7% |
| Intel Core i5-2300 CPU @ 2.80GHz | 1 | 2.7% |
| Intel Core i3-7100 CPU @ 3.90GHz | 1 | 2.7% |
| Intel Core i3-4130 CPU @ 3.40GHz | 1 | 2.7% |
| Intel Core i3-3220 CPU @ 3.30GHz | 1 | 2.7% |
| Intel Core i3-2120 CPU @ 3.30GHz | 1 | 2.7% |
| Intel Core i3-10100 CPU @ 3.60GHz | 1 | 2.7% |
| Intel Core 2 Quad CPU Q9300 @ 2.50GHz | 1 | 2.7% |
| Intel Core 2 CPU 6320 @ 1.86GHz | 1 | 2.7% |
| Intel Celeron J4005 CPU @ 2.00GHz | 1 | 2.7% |
| Intel Celeron CPU 430 @ 1.80GHz | 1 | 2.7% |
| Intel Atom CPU D525 @ 1.80GHz | 1 | 2.7% |
| CentaurHauls ZHAOXIN KaiXian KX-6640MA@2.2+GHz | 1 | 2.7% |
| AMD Ryzen 5 3400G with Radeon Vega Graphics | 1 | 2.7% |
| AMD Ryzen 5 2600 Six-Core Processor | 1 | 2.7% |
| AMD Ryzen 5 2400G with Radeon Vega Graphics | 1 | 2.7% |
| AMD Ryzen 3 2200G with Radeon Vega Graphics | 1 | 2.7% |
| AMD E-350D APU with Radeon HD Graphics | 1 | 2.7% |
| AMD Athlon II X4 620 Processor | 1 | 2.7% |
| AMD Athlon II X2 B26 Processor | 1 | 2.7% |
| AMD A8-6600K APU with Radeon HD Graphics | 1 | 2.7% |
| AMD A8-3800 APU with Radeon HD Graphics | 1 | 2.7% |
CPU Model Family
Processor model prefix


| Model | Desktops | Percent |
|---|---|---|
| Intel Core i5 | 11 | 29.73% |
| Intel Core i3 | 5 | 13.51% |
| AMD Ryzen 5 | 3 | 8.11% |
| Intel Pentium Dual-Core | 2 | 5.41% |
| Intel Pentium | 2 | 5.41% |
| Intel Celeron | 2 | 5.41% |
| AMD A8 | 2 | 5.41% |
| Other | 1 | 2.7% |
| Intel Pentium D | 1 | 2.7% |
| Intel Core i7 | 1 | 2.7% |
| Intel Core 2 Quad | 1 | 2.7% |
| Intel Core 2 | 1 | 2.7% |
| Intel Atom | 1 | 2.7% |
| AMD Ryzen 3 | 1 | 2.7% |
| AMD E | 1 | 2.7% |
| AMD Athlon II X4 | 1 | 2.7% |
| AMD Athlon II X2 | 1 | 2.7% |
CPU Cores
Number of processor cores


| Number | Desktops | Percent |
|---|---|---|
| 4 | 17 | 45.95% |
| 2 | 17 | 45.95% |
| 6 | 2 | 5.41% |
| 1 | 1 | 2.7% |
CPU Sockets
Number of sockets


| Number | Desktops | Percent |
|---|---|---|
| 1 | 37 | 100% |
CPU Threads
Threads per core (Hyper-Threading)


| Number | Desktops | Percent |
|---|---|---|
| 1 | 23 | 62.16% |
| 2 | 14 | 37.84% |
CPU Op-Modes
CPU Operation Modes (32-bit, 64-bit)


| Op mode | Desktops | Percent |
|---|---|---|
| 32-bit, 64-bit | 37 | 100% |
CPU Microcode
Microcode number


| Number | Desktops | Percent |
|---|---|---|
| 0x306c3 | 4 | 10.81% |
| 0x306a9 | 4 | 10.81% |
| 0x206a7 | 3 | 8.11% |
| 0x906e9 | 2 | 5.41% |
| 0x506e3 | 2 | 5.41% |
| 0x20652 | 2 | 5.41% |
| 0x1067a | 2 | 5.41% |
| 0x0810100b | 2 | 5.41% |
| 0xf65 | 1 | 2.7% |
| 0xa0653 | 1 | 2.7% |
| 0x706a1 | 1 | 2.7% |
| 0x6f6 | 1 | 2.7% |
| 0x206c2 | 1 | 2.7% |
| 0x106ca | 1 | 2.7% |
| 0x10677 | 1 | 2.7% |
| 0x10661 | 1 | 2.7% |
| 0x08108109 | 1 | 2.7% |
| 0x0800820d | 1 | 2.7% |
| 0x06001119 | 1 | 2.7% |
| 0x05000119 | 1 | 2.7% |
| 0x03000027 | 1 | 2.7% |
| 0x010000db | 1 | 2.7% |
| 0x010000b6 | 1 | 2.7% |
| Unknown | 1 | 2.7% |
CPU Microarch
Microarchitecture


| Name | Desktops | Percent |
|---|---|---|
| IvyBridge | 4 | 10.81% |
| Haswell | 4 | 10.81% |
| Westmere | 3 | 8.11% |
| SandyBridge | 3 | 8.11% |
| Penryn | 3 | 8.11% |
| Zen+ | 2 | 5.41% |
| Zen | 2 | 5.41% |
| Skylake | 2 | 5.41% |
| KabyLake | 2 | 5.41% |
| K10 | 2 | 5.41% |
| Core | 2 | 5.41% |
| Piledriver | 1 | 2.7% |
| NetBurst | 1 | 2.7% |
| K10 Llano | 1 | 2.7% |
| Goldmont plus | 1 | 2.7% |
| CometLake | 1 | 2.7% |
| Bonnell | 1 | 2.7% |
| Bobcat | 1 | 2.7% |
| Unknown | 1 | 2.7% |
Graphics
GPU Vendor
Vendors of graphics cards


| Vendor | Desktops | Percent |
|---|---|---|
| AMD | 17 | 44.74% |
| Intel | 11 | 28.95% |
| Nvidia | 9 | 23.68% |
| Zhaoxin | 1 | 2.63% |
GPU Model
Graphics card models


| Model | Desktops | Percent |
|---|---|---|
| Nvidia GF108 [GeForce GT 630] | 2 | 5% |
| Intel Xeon E3-1200 v3/4th Gen Core Processor Integrated Graphics Controller | 2 | 5% |
| Intel Xeon E3-1200 v2/3rd Gen Core processor Graphics Controller | 2 | 5% |
| AMD Cedar [Radeon HD 5000/6000/7350/8350 Series] | 2 | 5% |
| Zhaoxin ZX-E C-960 GPU | 1 | 2.5% |
| Nvidia GT218 [ION] | 1 | 2.5% |
| Nvidia GP107 [GeForce GTX 1050 Ti] | 1 | 2.5% |
| Nvidia GP104 [GeForce GTX 1060 6GB] | 1 | 2.5% |
| Nvidia GM107GL [Quadro K620] | 1 | 2.5% |
| Nvidia GK208B [GeForce GT 720] | 1 | 2.5% |
| Nvidia GF119 [GeForce GT 610] | 1 | 2.5% |
| Nvidia GF119 [GeForce GT 520] | 1 | 2.5% |
| Intel HD Graphics 630 | 1 | 2.5% |
| Intel HD Graphics 530 | 1 | 2.5% |
| Intel GeminiLake [UHD Graphics 600] | 1 | 2.5% |
| Intel Core Processor Integrated Graphics Controller | 1 | 2.5% |
| Intel CometLake-S GT2 [UHD Graphics 630] | 1 | 2.5% |
| Intel 82G33/G31 Express Integrated Graphics Controller | 1 | 2.5% |
| Intel 2nd Generation Core Processor Family Integrated Graphics Controller | 1 | 2.5% |
| AMD Wrestler [Radeon HD 6310] | 1 | 2.5% |
| AMD Turks XT [Radeon HD 6670/7670] | 1 | 2.5% |
| AMD Sumo [Radeon HD 6550D] | 1 | 2.5% |
| AMD RV630 XT [Radeon HD 2600 XT] | 1 | 2.5% |
| AMD RV610 [Radeon HD 2400 PRO] | 1 | 2.5% |
| AMD RV370 [Radeon X300] | 1 | 2.5% |
| AMD RV370 [Radeon X300 SE] | 1 | 2.5% |
| AMD RS880 [Radeon HD 4200] | 1 | 2.5% |
| AMD Richland [Radeon HD 8570D] | 1 | 2.5% |
| AMD Redwood XT [Radeon HD 5670/5690/5730] | 1 | 2.5% |
| AMD Picasso/Raven 2 [Radeon Vega Series / Radeon Vega Mobile Series] | 1 | 2.5% |
| AMD Park [Mobility Radeon HD 5430] | 1 | 2.5% |
| AMD Oland PRO [Radeon R7 240/340] | 1 | 2.5% |
| AMD Ellesmere [Radeon RX 470/480/570/570X/580/580X/590] | 1 | 2.5% |
| AMD Cypress XT [Radeon HD 5870] | 1 | 2.5% |
| AMD Bonaire XTX [Radeon R7 260X/360] | 1 | 2.5% |
| AMD Baffin [Radeon RX 550 640SP / RX 560/560X] | 1 | 2.5% |
GPU Combo
Combinations of graphics cards


| Name | Desktops | Percent |
|---|---|---|
| 1 x AMD | 15 | 40.54% |
| 1 x Intel | 10 | 27.03% |
| 1 x Nvidia | 8 | 21.62% |
| 2 x AMD | 2 | 5.41% |
| 1 x Zhaoxin | 1 | 2.7% |
| Intel + Nvidia | 1 | 2.7% |
GPU Driver
Free vs proprietary


| Driver | Desktops | Percent |
|---|---|---|
| Free | 33 | 89.19% |
| Unknown | 4 | 10.81% |
GPU Memory
Total video memory


| Size in GB | Desktops | Percent |
|---|---|---|
| Unknown | 12 | 32.43% |
| 0.51-1.0 | 8 | 21.62% |
| 0.01-0.5 | 7 | 18.92% |
| 3.01-4.0 | 4 | 10.81% |
| 1.01-2.0 | 4 | 10.81% |
| 7.01-8.0 | 1 | 2.7% |
| 5.01-6.0 | 1 | 2.7% |
Monitor
Monitor Vendor
Monitor vendors


| Vendor | Desktops | Percent |
|---|---|---|
| Samsung Electronics | 6 | 18.75% |
| Hewlett-Packard | 3 | 9.38% |
| Goldstar | 3 | 9.38% |
| Dell | 3 | 9.38% |
| Vestel Elektronik | 2 | 6.25% |
| Philips | 2 | 6.25% |
| Ancor Communications | 2 | 6.25% |
| Acer | 2 | 6.25% |
| MStar | 1 | 3.13% |
| MiTAC | 1 | 3.13% |
| Medion | 1 | 3.13% |
| Iiyama | 1 | 3.13% |
| HKC | 1 | 3.13% |
| Daewoo | 1 | 3.13% |
| BenQ | 1 | 3.13% |
| Belinea | 1 | 3.13% |
| AOC | 1 | 3.13% |
Monitor Model
Monitor models


| Model | Desktops | Percent |
|---|---|---|
| Vestel Elektronik 50UHD_LCD_TV VES3700 3840x2160 1872x1053mm 84.6-inch | 2 | 6.06% |
| Samsung Electronics T24B301 SAM098E 1920x1080 521x293mm 23.5-inch | 1 | 3.03% |
| Samsung Electronics S27E500 SAM0D0D 1920x1080 600x340mm 27.2-inch | 1 | 3.03% |
| Samsung Electronics S27C450 SAM09D1 1920x1080 598x336mm 27.0-inch | 1 | 3.03% |
| Samsung Electronics LF27T35 SAM707F 1920x1080 600x340mm 27.2-inch | 1 | 3.03% |
| Samsung Electronics LCD Monitor SAM7016 3840x2160 950x540mm 43.0-inch | 1 | 3.03% |
| Samsung Electronics LCD Monitor SAM0FA2 3840x2160 1872x1053mm 84.6-inch | 1 | 3.03% |
| Philips PHL 223V5 PHLC0CF 1920x1080 480x270mm 21.7-inch | 1 | 3.03% |
| Philips FTV PHL01EA 1920x1080 1440x810mm 65.0-inch | 1 | 3.03% |
| MStar TV_MONITOR MST0030 1440x900 1150x650mm 52.0-inch | 1 | 3.03% |
| MiTAC MTC26T42 MTC0B01 1920x1080 700x390mm 31.5-inch | 1 | 3.03% |
| Medion MD20328 MED3941 1600x900 462x272mm 21.1-inch | 1 | 3.03% |
| Iiyama PLX2783H IVM6648 1920x1080 598x336mm 27.0-inch | 1 | 3.03% |
| HKC LCD MONITOR HKC03D7 1440x900 410x256mm 19.0-inch | 1 | 3.03% |
| Hewlett-Packard w2207 HWP26A9 1680x1050 473x296mm 22.0-inch | 1 | 3.03% |
| Hewlett-Packard LP2065 HWP0A72 1600x1200 408x306mm 20.1-inch | 1 | 3.03% |
| Hewlett-Packard E221c HWP3093 1920x1080 497x292mm 22.7-inch | 1 | 3.03% |
| Hewlett-Packard 7500 HWP2603 1280x1024 312x234mm 15.4-inch | 1 | 3.03% |
| Goldstar LG ULTRAWIDE GSM59F1 1920x1080 580x240mm 24.7-inch | 1 | 3.03% |
| Goldstar FULL HD GSM5B54 1920x1080 480x270mm 21.7-inch | 1 | 3.03% |
| Goldstar E2350 GSM5790 1920x1080 510x290mm 23.1-inch | 1 | 3.03% |
| Dell P2213 DELF041 1680x1050 473x296mm 22.0-inch | 1 | 3.03% |
| Dell E198FP DELA028 1280x1024 380x305mm 19.2-inch | 1 | 3.03% |
| Dell 2208WFP DEL403B 1680x1050 473x296mm 22.0-inch | 1 | 3.03% |
| Daewoo LM1710 (VGA) DWE1710 1280x1024 337x270mm 17.0-inch | 1 | 3.03% |
| BenQ EW277HDR BNQ7948 1920x1080 598x336mm 27.0-inch | 1 | 3.03% |
| Belinea B101935 MAX0787 1280x1024 376x301mm 19.0-inch | 1 | 3.03% |
| AOC 2041 AOC2041 1600x900 443x249mm 20.0-inch | 1 | 3.03% |
| Ancor Communications VW195 ACI19AB 1440x900 410x260mm 19.1-inch | 1 | 3.03% |
| Ancor Communications ASUS VH192 ACI19E4 1366x768 410x230mm 18.5-inch | 1 | 3.03% |
| Acer KA220HQ ACR0497 1920x1080 477x268mm 21.5-inch | 1 | 3.03% |
| Acer AL1717 A ACRAD46 1280x1024 338x270mm 17.0-inch | 1 | 3.03% |
Monitor Resolution
Monitor screen resolution


| Resolution | Desktops | Percent |
|---|---|---|
| 1920x1080 (FHD) | 12 | 36.36% |
| 3840x2160 (4K) | 5 | 15.15% |
| 1280x1024 (SXGA) | 5 | 15.15% |
| 1680x1050 (WSXGA+) | 3 | 9.09% |
| 1600x900 (HD+) | 2 | 6.06% |
| 1440x900 (WXGA+) | 2 | 6.06% |
| 2560x1080 | 1 | 3.03% |
| 1920x540 | 1 | 3.03% |
| 1600x1200 | 1 | 3.03% |
| 1366x768 (WXGA) | 1 | 3.03% |
Monitor Diagonal
Diagonal size in inches


| Inches | Desktops | Percent |
|---|---|---|
| 27 | 5 | 15.15% |
| 84 | 4 | 12.12% |
| 22 | 4 | 12.12% |
| 21 | 4 | 12.12% |
| 19 | 4 | 12.12% |
| 23 | 2 | 6.06% |
| 20 | 2 | 6.06% |
| 17 | 2 | 6.06% |
| 65 | 1 | 3.03% |
| 52 | 1 | 3.03% |
| 34 | 1 | 3.03% |
| 32 | 1 | 3.03% |
| 18 | 1 | 3.03% |
| 15 | 1 | 3.03% |
Monitor Width
Physical width


| Width in mm | Desktops | Percent |
|---|---|---|
| 401-500 | 13 | 39.39% |
| 501-600 | 7 | 21.21% |
| 1501-2000 | 4 | 12.12% |
| 301-350 | 3 | 9.09% |
| 701-800 | 2 | 6.06% |
| 351-400 | 2 | 6.06% |
| 1001-1500 | 2 | 6.06% |
Aspect Ratio
Proportional relationship between the width and the height


| Ratio | Desktops | Percent |
|---|---|---|
| 16/9 | 21 | 63.64% |
| 16/10 | 5 | 15.15% |
| 5/4 | 4 | 12.12% |
| 4/3 | 2 | 6.06% |
| 21/9 | 1 | 3.03% |
Monitor Area
Area in inch²


| Area in inch² | Desktops | Percent |
|---|---|---|
| 201-250 | 9 | 27.27% |
| 151-200 | 7 | 21.21% |
| More than 1000 | 6 | 18.18% |
| 301-350 | 5 | 15.15% |
| 141-150 | 3 | 9.09% |
| 351-500 | 2 | 6.06% |
| 111-120 | 1 | 3.03% |
Pixel Density
Pixels per inch


| Density | Desktops | Percent |
|---|---|---|
| 51-100 | 26 | 81.25% |
| 101-120 | 4 | 12.5% |
| 1-50 | 2 | 6.25% |
Multiple Monitors
Total monitors connected


| Total | Desktops | Percent |
|---|---|---|
| 1 | 33 | 89.19% |
| 0 | 3 | 8.11% |
| 2 | 1 | 2.7% |
Network
Net Controller Vendor
Controller vendors


| Vendor | Desktops | Percent |
|---|---|---|
| Realtek Semiconductor | 22 | 51.16% |
| Intel | 12 | 27.91% |
| Qualcomm Atheros | 3 | 6.98% |
| IMC Networks | 2 | 4.65% |
| Broadcom | 2 | 4.65% |
| Qualcomm Atheros Communications | 1 | 2.33% |
| Broadcom Limited | 1 | 2.33% |
Net Controller Model
Controller models


| Model | Desktops | Percent |
|---|---|---|
| Realtek RTL8111/8168/8411 PCI Express Gigabit Ethernet Controller | 19 | 42.22% |
| Intel 82579LM Gigabit Network Connection (Lewisville) | 5 | 11.11% |
| Intel Ethernet Connection I217-V | 2 | 4.44% |
| IMC Networks Mediao 802.11n WLAN [Realtek RTL8191SU] | 2 | 4.44% |
| Realtek RTL88x2bu [AC1200 Techkey] | 1 | 2.22% |
| Realtek RTL8191SU 802.11n WLAN Adapter | 1 | 2.22% |
| Realtek RTL8188EUS 802.11n Wireless Network Adapter | 1 | 2.22% |
| Realtek RTL8169 PCI Gigabit Ethernet Controller | 1 | 2.22% |
| Realtek RTL810xE PCI Express Fast Ethernet controller | 1 | 2.22% |
| Qualcomm Atheros QCA8171 Gigabit Ethernet | 1 | 2.22% |
| Qualcomm Atheros AR9271 802.11n | 1 | 2.22% |
| Qualcomm Atheros Attansic L1 Gigabit Ethernet | 1 | 2.22% |
| Qualcomm Atheros AR922X Wireless Network Adapter | 1 | 2.22% |
| Intel Wireless 7265 | 1 | 2.22% |
| Intel Ethernet Connection I217-LM | 1 | 2.22% |
| Intel Ethernet Connection (2) I219-LM | 1 | 2.22% |
| Intel 82579V Gigabit Network Connection | 1 | 2.22% |
| Intel 82578DM Gigabit Network Connection | 1 | 2.22% |
| Broadcom NetXtreme BCM5761 Gigabit Ethernet PCIe | 1 | 2.22% |
| Broadcom NetXtreme BCM5751 Gigabit Ethernet PCI Express | 1 | 2.22% |
| Broadcom Limited NetLink BCM5787 Gigabit Ethernet PCI Express | 1 | 2.22% |
Wireless Vendor
Wireless vendors


| Vendor | Desktops | Percent |
|---|---|---|
| Realtek Semiconductor | 3 | 37.5% |
| IMC Networks | 2 | 25% |
| Qualcomm Atheros Communications | 1 | 12.5% |
| Qualcomm Atheros | 1 | 12.5% |
| Intel | 1 | 12.5% |
Wireless Model
Wireless models


| Model | Desktops | Percent |
|---|---|---|
| IMC Networks Mediao 802.11n WLAN [Realtek RTL8191SU] | 2 | 25% |
| Realtek RTL88x2bu [AC1200 Techkey] | 1 | 12.5% |
| Realtek RTL8191SU 802.11n WLAN Adapter | 1 | 12.5% |
| Realtek RTL8188EUS 802.11n Wireless Network Adapter | 1 | 12.5% |
| Qualcomm Atheros AR9271 802.11n | 1 | 12.5% |
| Qualcomm Atheros AR922X Wireless Network Adapter | 1 | 12.5% |
| Intel Wireless 7265 | 1 | 12.5% |
Ethernet Vendor
Ethernet vendors


| Vendor | Desktops | Percent |
|---|---|---|
| Realtek Semiconductor | 21 | 56.76% |
| Intel | 11 | 29.73% |
| Qualcomm Atheros | 2 | 5.41% |
| Broadcom | 2 | 5.41% |
| Broadcom Limited | 1 | 2.7% |
Ethernet Model
Ethernet models


| Model | Desktops | Percent |
|---|---|---|
| Realtek RTL8111/8168/8411 PCI Express Gigabit Ethernet Controller | 19 | 51.35% |
| Intel 82579LM Gigabit Network Connection (Lewisville) | 5 | 13.51% |
| Intel Ethernet Connection I217-V | 2 | 5.41% |
| Realtek RTL8169 PCI Gigabit Ethernet Controller | 1 | 2.7% |
| Realtek RTL810xE PCI Express Fast Ethernet controller | 1 | 2.7% |
| Qualcomm Atheros QCA8171 Gigabit Ethernet | 1 | 2.7% |
| Qualcomm Atheros Attansic L1 Gigabit Ethernet | 1 | 2.7% |
| Intel Ethernet Connection I217-LM | 1 | 2.7% |
| Intel Ethernet Connection (2) I219-LM | 1 | 2.7% |
| Intel 82579V Gigabit Network Connection | 1 | 2.7% |
| Intel 82578DM Gigabit Network Connection | 1 | 2.7% |
| Broadcom NetXtreme BCM5761 Gigabit Ethernet PCIe | 1 | 2.7% |
| Broadcom NetXtreme BCM5751 Gigabit Ethernet PCI Express | 1 | 2.7% |
| Broadcom Limited NetLink BCM5787 Gigabit Ethernet PCI Express | 1 | 2.7% |
Net Controller Kind
Ethernet, WiFi or modem


| Kind | Desktops | Percent |
|---|---|---|
| Ethernet | 37 | 82.22% |
| WiFi | 8 | 17.78% |
Used Controller
Currently used network controller
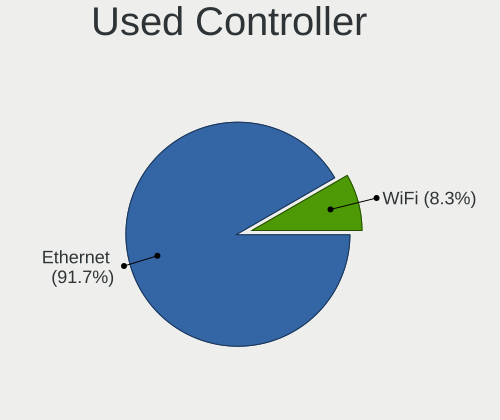

| Kind | Desktops | Percent |
|---|---|---|
| Ethernet | 33 | 91.67% |
| WiFi | 3 | 8.33% |
NICs
Total network controllers on board


| Total | Desktops | Percent |
|---|---|---|
| 1 | 34 | 91.89% |
| 2 | 3 | 8.11% |
IPv6
IPv6 vs IPv4


| Used | Desktops | Percent |
|---|---|---|
| No | 31 | 83.78% |
| Yes | 6 | 16.22% |
Bluetooth
Bluetooth Vendor
Controller vendors


| Vendor | Desktops | Percent |
|---|---|---|
| Cambridge Silicon Radio | 5 | 71.43% |
| Intel | 1 | 14.29% |
| Integrated System Solution | 1 | 14.29% |
Bluetooth Model
Controller models


| Model | Desktops | Percent |
|---|---|---|
| Cambridge Silicon Radio Bluetooth Dongle (HCI mode) | 5 | 71.43% |
| Intel Bluetooth wireless interface | 1 | 14.29% |
| Integrated System Solution Bluetooth Device | 1 | 14.29% |
Sound
Sound Vendor
Sound card vendors


| Vendor | Desktops | Percent |
|---|---|---|
| Intel | 26 | 47.27% |
| AMD | 18 | 32.73% |
| Nvidia | 9 | 16.36% |
| Zhaoxin | 1 | 1.82% |
| C-Media Electronics | 1 | 1.82% |
Sound Model
Sound card models


| Model | Desktops | Percent |
|---|---|---|
| Intel 7 Series/C216 Chipset Family High Definition Audio Controller | 5 | 7.69% |
| Intel NM10/ICH7 Family High Definition Audio Controller | 4 | 6.15% |
| Intel 8 Series/C220 Series Chipset High Definition Audio Controller | 4 | 6.15% |
| Intel 100 Series/C230 Series Chipset Family HD Audio Controller | 3 | 4.62% |
| AMD SBx00 Azalia (Intel HDA) | 3 | 4.62% |
| AMD Family 17h (Models 10h-1fh) HD Audio Controller | 3 | 4.62% |
| AMD Cedar HDMI Audio [Radeon HD 5400/6300/7300 Series] | 3 | 4.62% |
| Nvidia GF119 HDMI Audio Controller | 2 | 3.08% |
| Nvidia GF108 High Definition Audio Controller | 2 | 3.08% |
| Intel Xeon E3-1200 v3/4th Gen Core Processor HD Audio Controller | 2 | 3.08% |
| Intel 82801H (ICH8 Family) HD Audio Controller | 2 | 3.08% |
| Intel 6 Series/C200 Series Chipset Family High Definition Audio Controller | 2 | 3.08% |
| Intel 5 Series/3400 Series Chipset High Definition Audio | 2 | 3.08% |
| AMD FCH Azalia Controller | 2 | 3.08% |
| Zhaoxin ZX-E High Definition Audio Controller | 1 | 1.54% |
| Zhaoxin ZX-100/ZX-D/ZX-E High Definition Audio Controller | 1 | 1.54% |
| Nvidia High Definition Audio Controller | 1 | 1.54% |
| Nvidia GP107GL High Definition Audio Controller | 1 | 1.54% |
| Nvidia GP104 High Definition Audio Controller | 1 | 1.54% |
| Nvidia GM107 High Definition Audio Controller [GeForce 940MX] | 1 | 1.54% |
| Nvidia GK208 HDMI/DP Audio Controller | 1 | 1.54% |
| Intel Celeron/Pentium Silver Processor High Definition Audio | 1 | 1.54% |
| Intel Audio device | 1 | 1.54% |
| Intel 82801JI (ICH10 Family) HD Audio Controller | 1 | 1.54% |
| Intel 82801G (ICH7 Family) AC'97 Audio Controller | 1 | 1.54% |
| C-Media Electronics CMI8788 [Oxygen HD Audio] | 1 | 1.54% |
| AMD Wrestler HDMI Audio | 1 | 1.54% |
| AMD Turks HDMI Audio [Radeon HD 6500/6600 / 6700M Series] | 1 | 1.54% |
| AMD Trinity HDMI Audio Controller | 1 | 1.54% |
| AMD Tobago HDMI Audio [Radeon R7 360 / R9 360 OEM] | 1 | 1.54% |
| AMD RV630 HDMI Audio [Radeon HD 2600 PRO/XT / HD 3610] | 1 | 1.54% |
| AMD RV610 HDMI Audio [Radeon HD 2350 PRO / 2400 PRO/XT / HD 3410] | 1 | 1.54% |
| AMD Redwood HDMI Audio [Radeon HD 5000 Series] | 1 | 1.54% |
| AMD Raven/Raven2/Fenghuang HDMI/DP Audio Controller | 1 | 1.54% |
| AMD Oland/Hainan/Cape Verde/Pitcairn HDMI Audio [Radeon HD 7000 Series] | 1 | 1.54% |
| AMD Family 17h (Models 00h-0fh) HD Audio Controller | 1 | 1.54% |
| AMD Ellesmere HDMI Audio [Radeon RX 470/480 / 570/580/590] | 1 | 1.54% |
| AMD Cypress HDMI Audio [Radeon HD 5830/5850/5870 / 6850/6870 Rebrand] | 1 | 1.54% |
| AMD BeaverCreek HDMI Audio [Radeon HD 6500D and 6400G-6600G series] | 1 | 1.54% |
| AMD Baffin HDMI/DP Audio [Radeon RX 550 640SP / RX 560/560X] | 1 | 1.54% |
Memory
Memory Vendor
Memory module vendors


| Vendor | Desktops | Percent |
|---|---|---|
| Kingston | 10 | 23.26% |
| Unknown | 9 | 20.93% |
| Samsung Electronics | 7 | 16.28% |
| SK Hynix | 4 | 9.3% |
| Micron Technology | 3 | 6.98% |
| Corsair | 2 | 4.65% |
| Team | 1 | 2.33% |
| Silicon Power | 1 | 2.33% |
| Nanya Technology | 1 | 2.33% |
| Kingmax | 1 | 2.33% |
| J&A Information | 1 | 2.33% |
| G.Skill | 1 | 2.33% |
| Elpida | 1 | 2.33% |
| Crucial | 1 | 2.33% |
Memory Model
Memory module models


| Model | Desktops | Percent |
|---|---|---|
| Samsung RAM M378B5173QH0-CK0 4GB DIMM DDR3 1866MT/s | 2 | 4.26% |
| Samsung RAM M378B5173DB0-CK0 4GB DIMM DDR3 1600MT/s | 2 | 4.26% |
| Kingston RAM KHX1600C9D3/4GX 4096MB DIMM DDR3 2400MT/s | 2 | 4.26% |
| Unknown RAM Module 8192MB DIMM DDR3 1600MT/s | 1 | 2.13% |
| Unknown RAM Module 8192MB DIMM 1333MT/s | 1 | 2.13% |
| Unknown RAM Module 2048MB SODIMM DDR2 800MT/s | 1 | 2.13% |
| Unknown RAM Module 2048MB DIMM SDRAM | 1 | 2.13% |
| Unknown RAM Module 2048MB DIMM DDR2 800MT/s | 1 | 2.13% |
| Unknown RAM Module 2048MB DIMM 400MT/s | 1 | 2.13% |
| Unknown RAM Module 2048MB DIMM 1333MT/s | 1 | 2.13% |
| Unknown RAM Module 2048MB DIMM 1066MT/s | 1 | 2.13% |
| Unknown RAM Module 1024MB DIMM SDRAM 800MT/s | 1 | 2.13% |
| Unknown RAM Module 1024MB DIMM DDR2 800MT/s | 1 | 2.13% |
| Team RAM TEAMGROUP-UD4-2400 8GB DIMM DDR4 2400MT/s | 1 | 2.13% |
| SK Hynix RAM Module 4096MB DIMM DDR4 2133MT/s | 1 | 2.13% |
| SK Hynix RAM HMT351U6EFR8C-PB 4096MB DIMM DDR3 1800MT/s | 1 | 2.13% |
| SK Hynix RAM HMT351U6CFR8C-PB 4GB DIMM DDR3 1800MT/s | 1 | 2.13% |
| SK Hynix RAM HMT125U7TFR8C-H9 2048MB DIMM DDR3 1333MT/s | 1 | 2.13% |
| Silicon Power RAM SP004GBLFU240C02 4096MB DIMM DDR4 2400MT/s | 1 | 2.13% |
| Samsung RAM Module 8192MB DIMM DDR4 2666MT/s | 1 | 2.13% |
| Samsung RAM M378B5773DH0-CH9 2048MB DIMM DDR3 1333MT/s | 1 | 2.13% |
| Samsung RAM M378B5673FH0-CH9 2048MB DIMM 1600MT/s | 1 | 2.13% |
| Samsung RAM M378B5673EH1-CH9 2048MB DIMM DDR3 1333MT/s | 1 | 2.13% |
| Nanya RAM NT2GC64B8HA0NF-BE 2048MB DIMM 533MT/s | 1 | 2.13% |
| Micron RAM 8JTF25664AZ-1G4M1 2048MB DIMM DDR3 1333MT/s | 1 | 2.13% |
| Micron RAM 4JTF25664AZ-1G6E1 2048MB DIMM DDR3 1600MT/s | 1 | 2.13% |
| Micron RAM 16JTF25664AZ-1G4G1 2048MB DIMM 1400MT/s | 1 | 2.13% |
| Micron RAM 16ATF1G64AZ-2G1A2 8192MB DIMM DDR4 2400MT/s | 1 | 2.13% |
| Kingston RAM KHX2133C14/8G 8GB DIMM DDR4 2400MT/s | 1 | 2.13% |
| Kingston RAM KHX1600C10D3/8G 8192MB DIMM DDR3 1867MT/s | 1 | 2.13% |
| Kingston RAM KHX1600C10D3/4G 4096MB DIMM DDR3 1866MT/s | 1 | 2.13% |
| Kingston RAM K531R8-HYA 4096MB DIMM DDR3 1600MT/s | 1 | 2.13% |
| Kingston RAM 99U5429-007.A00LF 2048MB DIMM DDR2 800MT/s | 1 | 2.13% |
| Kingston RAM 9905743-140.A00G 8192MB DIMM DDR4 2666MT/s | 1 | 2.13% |
| Kingston RAM 9905595-010.A00LF 4096MB DIMM 1600MT/s | 1 | 2.13% |
| Kingston RAM 9905584-049.A00LF 4096MB DIMM DDR3 1333MT/s | 1 | 2.13% |
| Kingmax RAM KLDE88F-B8KY6 2048MB DIMM DDR 800MT/s | 1 | 2.13% |
| Kingmax RAM KLDE88F-B8KW6 2048MB DIMM DDR 667MT/s | 1 | 2.13% |
| J&A Information RAM Module 16384MB DIMM DDR4 2400MT/s | 1 | 2.13% |
| G.Skill RAM F4-3200C16-8GIS 8GB DIMM DDR4 3200MT/s | 1 | 2.13% |
| Elpida RAM EBJ21UE8BDF0-DJ-F 2048MB DIMM DDR3 1333MT/s | 1 | 2.13% |
| Crucial RAM CT4G4DFS8213.C8FAR2 4GB DIMM DDR4 2133MT/s | 1 | 2.13% |
| Corsair RAM CMZ16GX3M2A1600C10 8GB DIMM DDR3 1600MT/s | 1 | 2.13% |
| Corsair RAM CMV8GX4M1A2400C16 8192MB DIMM DDR4 2400MT/s | 1 | 2.13% |
Memory Kind
Memory module kinds


| Kind | Desktops | Percent |
|---|---|---|
| DDR3 | 14 | 35.9% |
| DDR4 | 11 | 28.21% |
| SDRAM | 6 | 15.38% |
| Unknown | 5 | 12.82% |
| DDR2 | 3 | 7.69% |
Memory Form Factor
Physical design of the memory module


| Name | Desktops | Percent |
|---|---|---|
| DIMM | 36 | 97.3% |
| SODIMM | 1 | 2.7% |
Memory Size
Memory module size


| Size | Desktops | Percent |
|---|---|---|
| 2048 | 15 | 35.71% |
| 4096 | 13 | 30.95% |
| 8192 | 10 | 23.81% |
| 16384 | 2 | 4.76% |
| 1024 | 2 | 4.76% |
Memory Speed
Memory module speed


| Speed | Desktops | Percent |
|---|---|---|
| 2400 | 8 | 18.18% |
| 1333 | 8 | 18.18% |
| 1600 | 6 | 13.64% |
| 800 | 5 | 11.36% |
| 1866 | 3 | 6.82% |
| 2666 | 2 | 4.55% |
| 2133 | 2 | 4.55% |
| 1800 | 2 | 4.55% |
| 3200 | 1 | 2.27% |
| 1867 | 1 | 2.27% |
| 1400 | 1 | 2.27% |
| 1066 | 1 | 2.27% |
| 667 | 1 | 2.27% |
| 533 | 1 | 2.27% |
| 400 | 1 | 2.27% |
| Unknown | 1 | 2.27% |
Printers & scanners
Printer Vendor
Printer device vendors


| Vendor | Desktops | Percent |
|---|---|---|
| Samsung Electronics | 1 | 100% |
Printer Model
Printer device models


| Model | Desktops | Percent |
|---|---|---|
| Samsung SCX-3400 Series | 1 | 100% |
Scanner Vendor
Scanner device vendors


| Vendor | Desktops | Percent |
|---|---|---|
| Canon | 1 | 100% |
Scanner Model
Scanner device models


| Model | Desktops | Percent |
|---|---|---|
| Canon CanoScan LIDE 25 | 1 | 100% |
Camera
Camera Vendor
Camera device vendors


| Vendor | Desktops | Percent |
|---|---|---|
| Microsoft | 2 | 28.57% |
| Microdia | 2 | 28.57% |
| Realtek Semiconductor | 1 | 14.29% |
| MACROSIL | 1 | 14.29% |
| KYE Systems (Mouse Systems) | 1 | 14.29% |
Camera Model
Camera device models


| Model | Desktops | Percent |
|---|---|---|
| Microdia Camera | 2 | 28.57% |
| Realtek USB Camera | 1 | 14.29% |
| Microsoft LifeCam VX-2000 | 1 | 14.29% |
| Microsoft LifeCam HD-3000 | 1 | 14.29% |
| MACROSIL AV TO USB2.0 | 1 | 14.29% |
| KYE Systems (Mouse Systems) iSlim 321R | 1 | 14.29% |
Security
Fingerprint Vendor
Fingerprint sensor vendors
Zero info for selected period =(
Fingerprint Model
Fingerprint sensor models
Zero info for selected period =(
Chipcard Vendor
Chipcard module vendors
Zero info for selected period =(
Chipcard Model
Chipcard module models
Zero info for selected period =(
Unsupported
Unsupported Devices
Total unsupported devices on board


| Total | Desktops | Percent |
|---|---|---|
| 0 | 31 | 83.78% |
| 1 | 4 | 10.81% |
| 2 | 2 | 5.41% |
Unsupported Device Types
Types of unsupported devices


| Type | Desktops | Percent |
|---|---|---|
| Graphics card | 5 | 62.5% |
| Sound | 1 | 12.5% |
| Net/wireless | 1 | 12.5% |
| Communication controller | 1 | 12.5% |