BlackPanther Hardware Trends (Desktops)
A project to identify most popular hardware characteristics and track their change over time based on data collected by BlackPanther users at https://Linux-Hardware.org.
Anyone can contribute to this report by the hw-probe tool:
sudo -E hw-probe -all -uploadFull-feature report is available here: https://linux-hardware.org/?view=trends&formfactor=desktop
Period: Aug, 2021.
Contents
System
OS
Installed operating systems


| Name | Desktops | Percent |
|---|---|---|
| BlackPanther 18.1 | 37 | 97.37% |
| BlackPanther 16.2 | 1 | 2.63% |
OS Family
OS without a version


| Name | Desktops | Percent |
|---|---|---|
| BlackPanther | 38 | 100% |
Kernel
Version of the Linux kernel


| Version | Desktops | Percent |
|---|---|---|
| 5.6.14-desktop-2bP | 25 | 65.79% |
| 4.18.16-desktop-1bP | 12 | 31.58% |
| 4.9.20-desktop-pae-1bP | 1 | 2.63% |
Kernel Family
Linux kernel without a distro release


| Version | Desktops | Percent |
|---|---|---|
| 5.6.14 | 25 | 65.79% |
| 4.18.16 | 12 | 31.58% |
| 4.9.20 | 1 | 2.63% |
Kernel Major Ver.
Linux kernel major version


| Version | Desktops | Percent |
|---|---|---|
| 5.6 | 25 | 65.79% |
| 4.18 | 12 | 31.58% |
| 4.9 | 1 | 2.63% |
Arch
OS architecture (x86_64, i586, etc.)


| Name | Desktops | Percent |
|---|---|---|
| x86_64 | 37 | 97.37% |
| i686 | 1 | 2.63% |
DE
Desktop Environment


| Name | Desktops | Percent |
|---|---|---|
| KDE5 | 38 | 100% |
Display Server
X11 or Wayland


| Name | Desktops | Percent |
|---|---|---|
| X11 | 38 | 100% |
Display Manager
SDDM, LightDM, etc.


| Name | Desktops | Percent |
|---|---|---|
| SDDM | 38 | 100% |
OS Lang
Language


| Lang | Desktops | Percent |
|---|---|---|
| Unknown | 38 | 100% |
Boot Mode
EFI or BIOS


| Mode | Desktops | Percent |
|---|---|---|
| BIOS | 28 | 73.68% |
| EFI | 10 | 26.32% |
Filesystem
Type of filesystem


| Type | Desktops | Percent |
|---|---|---|
| Overlay | 34 | 89.47% |
| Ext4 | 4 | 10.53% |
Part. scheme
Scheme of partitioning


| Type | Desktops | Percent |
|---|---|---|
| MBR | 21 | 55.26% |
| GPT | 16 | 42.11% |
| Unknown | 1 | 2.63% |
Dual Boot with Linux/BSD
Hosting more than one Linux/BSD


| Dual boot | Desktops | Percent |
|---|---|---|
| Yes | 21 | 55.26% |
| No | 17 | 44.74% |
Dual Boot (Win)
Hosting Linux and Windows


| Dual boot | Desktops | Percent |
|---|---|---|
| Yes | 20 | 52.63% |
| No | 18 | 47.37% |
Board
Vendor
Motherboard manufacturer


| Name | Desktops | Percent |
|---|---|---|
| ASUSTek Computer | 12 | 31.58% |
| Gigabyte Technology | 7 | 18.42% |
| Dell | 6 | 15.79% |
| ASRock | 5 | 13.16% |
| Lenovo | 3 | 7.89% |
| Hewlett-Packard | 2 | 5.26% |
| MSI | 1 | 2.63% |
| Fujitsu | 1 | 2.63% |
| Foxconn | 1 | 2.63% |
Model
Motherboard model


| Name | Desktops | Percent |
|---|---|---|
| ASUS PRIME B365M-A | 3 | 7.89% |
| HP Compaq Pro 6300 SFF | 2 | 5.26% |
| ASUS All Series | 2 | 5.26% |
| MSI MS-7C02 | 1 | 2.63% |
| Lenovo ThinkStation D20 4158AF8 | 1 | 2.63% |
| Lenovo ThinkStation C30 1097A34 | 1 | 2.63% |
| Lenovo ThinkCentre A57 98517HG | 1 | 2.63% |
| Gigabyte P67A-D3-B3 | 1 | 2.63% |
| Gigabyte H61M-S1 | 1 | 2.63% |
| Gigabyte H310M S2H 2.0 | 1 | 2.63% |
| Gigabyte GA-MA790X-UD4P | 1 | 2.63% |
| Gigabyte G41MT-S2PT | 1 | 2.63% |
| Gigabyte G41MT-S2 | 1 | 2.63% |
| Gigabyte EP45-UD3 | 1 | 2.63% |
| Fujitsu ESPRIMO P7936 | 1 | 2.63% |
| Foxconn Pro 3500 Series | 1 | 2.63% |
| Dell OptiPlex 990 | 1 | 2.63% |
| Dell OptiPlex 780 | 1 | 2.63% |
| Dell OptiPlex 755 | 1 | 2.63% |
| Dell OptiPlex 380 | 1 | 2.63% |
| Dell OptiPlex 330 | 1 | 2.63% |
| Dell OptiPlex 3010 | 1 | 2.63% |
| ASUS ROG STRIX B450-F GAMING II | 1 | 2.63% |
| ASUS ROG STRIX B450-F GAMING | 1 | 2.63% |
| ASUS PRIME A320M-R | 1 | 2.63% |
| ASUS P6T7 WS SUPERCOMPUTER | 1 | 2.63% |
| ASUS H110M-K | 1 | 2.63% |
| ASUS B75M-A | 1 | 2.63% |
| ASUS A8N-SLI | 1 | 2.63% |
| ASRock G31M-GS | 1 | 2.63% |
| ASRock FM2A75M Pro4+ | 1 | 2.63% |
| ASRock FM2A55M-DGS | 1 | 2.63% |
| ASRock B85M | 1 | 2.63% |
| ASRock 4CoreDual-SATA2 | 1 | 2.63% |
Model Family
Motherboard model prefix


| Name | Desktops | Percent |
|---|---|---|
| Dell OptiPlex | 6 | 15.79% |
| ASUS PRIME | 4 | 10.53% |
| Lenovo ThinkStation | 2 | 5.26% |
| HP Compaq | 2 | 5.26% |
| ASUS ROG | 2 | 5.26% |
| ASUS All | 2 | 5.26% |
| MSI MS-7C02 | 1 | 2.63% |
| Lenovo ThinkCentre | 1 | 2.63% |
| Gigabyte P67A-D3-B3 | 1 | 2.63% |
| Gigabyte H61M-S1 | 1 | 2.63% |
| Gigabyte H310M | 1 | 2.63% |
| Gigabyte GA-MA790X-UD4P | 1 | 2.63% |
| Gigabyte G41MT-S2PT | 1 | 2.63% |
| Gigabyte G41MT-S2 | 1 | 2.63% |
| Gigabyte EP45-UD3 | 1 | 2.63% |
| Fujitsu ESPRIMO | 1 | 2.63% |
| Foxconn Pro | 1 | 2.63% |
| ASUS P6T7 | 1 | 2.63% |
| ASUS H110M-K | 1 | 2.63% |
| ASUS B75M-A | 1 | 2.63% |
| ASUS A8N-SLI | 1 | 2.63% |
| ASRock G31M-GS | 1 | 2.63% |
| ASRock FM2A75M | 1 | 2.63% |
| ASRock FM2A55M-DGS | 1 | 2.63% |
| ASRock B85M | 1 | 2.63% |
| ASRock 4CoreDual-SATA2 | 1 | 2.63% |
MFG Year
Motherboard manufacture year


| Year | Desktops | Percent |
|---|---|---|
| 2013 | 5 | 13.16% |
| 2012 | 5 | 13.16% |
| 2020 | 4 | 10.53% |
| 2010 | 4 | 10.53% |
| 2019 | 3 | 7.89% |
| 2018 | 3 | 7.89% |
| 2014 | 3 | 7.89% |
| 2011 | 3 | 7.89% |
| 2008 | 3 | 7.89% |
| 2009 | 2 | 5.26% |
| 2021 | 1 | 2.63% |
| 2016 | 1 | 2.63% |
| 2005 | 1 | 2.63% |
Form Factor
Physical design of the computer


| Name | Desktops | Percent |
|---|---|---|
| Desktop | 38 | 100% |
Secure Boot
Enabled or disabled


| State | Desktops | Percent |
|---|---|---|
| Disabled | 38 | 100% |
Coreboot
Have coreboot on board


| Used | Desktops | Percent |
|---|---|---|
| No | 38 | 100% |
RAM Size
Total RAM memory


| Size in GB | Desktops | Percent |
|---|---|---|
| 3.01-4.0 | 15 | 39.47% |
| 8.01-16.0 | 10 | 26.32% |
| 16.01-24.0 | 5 | 13.16% |
| 4.01-8.0 | 3 | 7.89% |
| 32.01-64.0 | 2 | 5.26% |
| 24.01-32.0 | 1 | 2.63% |
| 2.01-3.0 | 1 | 2.63% |
| 1.01-2.0 | 1 | 2.63% |
RAM Used
Used RAM memory


| Used GB | Desktops | Percent |
|---|---|---|
| 0.01-0.5 | 23 | 60.53% |
| 0.51-1.0 | 14 | 36.84% |
| 1.01-2.0 | 1 | 2.63% |
Total Drives
Number of drives on board


| Drives | Desktops | Percent |
|---|---|---|
| 1 | 17 | 44.74% |
| 2 | 8 | 21.05% |
| 3 | 5 | 13.16% |
| 4 | 4 | 10.53% |
| 0 | 2 | 5.26% |
| 6 | 1 | 2.63% |
| 5 | 1 | 2.63% |
Has CD-ROM
Has CD-ROM on board


| Presented | Desktops | Percent |
|---|---|---|
| Yes | 26 | 68.42% |
| No | 12 | 31.58% |
Has Ethernet
Has Ethernet on board


| Presented | Desktops | Percent |
|---|---|---|
| Yes | 38 | 100% |
Has WiFi
Has WiFi module


| Presented | Desktops | Percent |
|---|---|---|
| No | 27 | 71.05% |
| Yes | 11 | 28.95% |
Has Bluetooth
Has Bluetooth module


| Presented | Desktops | Percent |
|---|---|---|
| No | 37 | 97.37% |
| Yes | 1 | 2.63% |
Location
Country
Geographic location (country)


| Country | Desktops | Percent |
|---|---|---|
| Hungary | 33 | 86.84% |
| USA | 1 | 2.63% |
| UK | 1 | 2.63% |
| Slovakia | 1 | 2.63% |
| Germany | 1 | 2.63% |
| Australia | 1 | 2.63% |
City
Geographic location (city)


| City | Desktops | Percent |
|---|---|---|
| Budapest | 5 | 13.16% |
| Oroshaza | 4 | 10.53% |
| Kenderes | 2 | 5.26% |
| Eger | 2 | 5.26% |
| Zalaegerszeg | 1 | 2.63% |
| Vecses | 1 | 2.63% |
| V??c | 1 | 2.63% |
| Szeksz??rd | 1 | 2.63% |
| Szeged | 1 | 2.63% |
| Sydney | 1 | 2.63% |
| Southend-on-Sea | 1 | 2.63% |
| Sajobabony | 1 | 2.63% |
| Roszke | 1 | 2.63% |
| P?cs | 1 | 2.63% |
| New Windsor | 1 | 2.63% |
| Nagyvisnyo | 1 | 2.63% |
| Mezokovesd | 1 | 2.63% |
| Kunszentmiklos | 1 | 2.63% |
| Kecskem?t | 1 | 2.63% |
| Karcag | 1 | 2.63% |
| Kal | 1 | 2.63% |
| Hodmezovasarhely | 1 | 2.63% |
| Hnusta | 1 | 2.63% |
| Heves | 1 | 2.63% |
| Hegyfalu | 1 | 2.63% |
| Gotha | 1 | 2.63% |
| Esztergom | 1 | 2.63% |
| Debrecen | 1 | 2.63% |
| Baja | 1 | 2.63% |
Drives
Drive Vendor
Hard drive vendors


| Vendor | Desktops | Drives | Percent |
|---|---|---|---|
| WDC | 20 | 23 | 31.25% |
| Samsung Electronics | 13 | 18 | 20.31% |
| Toshiba | 6 | 7 | 9.38% |
| Kingston | 4 | 5 | 6.25% |
| Zheino | 3 | 3 | 4.69% |
| Seagate | 3 | 4 | 4.69% |
| Maxtor | 3 | 3 | 4.69% |
| Crucial | 3 | 3 | 4.69% |
| China | 2 | 2 | 3.13% |
| XPG | 1 | 1 | 1.56% |
| PNY | 1 | 1 | 1.56% |
| Netac | 1 | 1 | 1.56% |
| Intenso | 1 | 1 | 1.56% |
| Hitachi | 1 | 1 | 1.56% |
| Apacer | 1 | 1 | 1.56% |
| A-DATA Technology | 1 | 1 | 1.56% |
Drive Model
Hard drive models


| Model | Desktops | Percent |
|---|---|---|
| Samsung HD103UJ 1TB | 4 | 5.48% |
| Zheino CHN-NGFFNV2280-256 256GB | 3 | 4.11% |
| WDC WDS240G2G0B-00EPW0 240GB SSD | 3 | 4.11% |
| Toshiba DT01ACA100 1TB | 3 | 4.11% |
| Samsung SSD 870 EVO 250GB | 2 | 2.74% |
| Kingston SA400S37240G 240GB SSD | 2 | 2.74% |
| XPG GAMMIX S11 Pro 512GB | 1 | 1.37% |
| WDC WDS500G2B0A-00SM50 500GB SSD | 1 | 1.37% |
| WDC WDS120G2G0B-00EPW0 120GB SSD | 1 | 1.37% |
| WDC WD800JD-55MUA1 80GB | 1 | 1.37% |
| WDC WD5000AAKX-22ERMA0 500GB | 1 | 1.37% |
| WDC WD5000AAKX-08U6AA0 500GB | 1 | 1.37% |
| WDC WD5000AAKX-001CA0 500GB | 1 | 1.37% |
| WDC WD5000AACS-00G8B1 500GB | 1 | 1.37% |
| WDC WD30EZRZ-00GXCB0 3TB | 1 | 1.37% |
| WDC WD30EFRX-68EUZN0 3TB | 1 | 1.37% |
| WDC WD2500AAKX-603CA0 250GB | 1 | 1.37% |
| WDC WD2500AAJS-75B4A0 250GB | 1 | 1.37% |
| WDC WD20PURX-64P6ZY0 2TB | 1 | 1.37% |
| WDC WD1600AAJS-60WAA0 160GB | 1 | 1.37% |
| WDC WD1600AAJB-56WRA0 160GB | 1 | 1.37% |
| WDC WD10EZEX-75WN4A0 1TB | 1 | 1.37% |
| WDC WD10EZEX-60M2NA0 1TB | 1 | 1.37% |
| WDC WD10EZEX-08WN4A0 1TB | 1 | 1.37% |
| WDC WD10EZEX-00KUWA0 1TB | 1 | 1.37% |
| WDC WD10EZEX-00BN5A0 1TB | 1 | 1.37% |
| WDC WD10EFRX-68PJCN0 1TB | 1 | 1.37% |
| Toshiba TR200 240GB SSD | 1 | 1.37% |
| Toshiba MQ04ABF100 1TB | 1 | 1.37% |
| Toshiba MK1646GSX 160GB | 1 | 1.37% |
| Toshiba DT01ACA050 500GB | 1 | 1.37% |
| Seagate ST500DM002-1BD142 500GB | 1 | 1.37% |
| Seagate ST3160318AS 160GB | 1 | 1.37% |
| Seagate ST31500341AS 1TB | 1 | 1.37% |
| Samsung SSD 870 EVO 1TB | 1 | 1.37% |
| Samsung SSD 860 EVO 500GB | 1 | 1.37% |
| Samsung SSD 830 Series 64GB | 1 | 1.37% |
| Samsung SP2004C 200GB | 1 | 1.37% |
| Samsung SP1614C 160GB | 1 | 1.37% |
| Samsung HD502HJ 500GB | 1 | 1.37% |
| Samsung HD322HJ 320GB | 1 | 1.37% |
| Samsung HD204UI 2TB | 1 | 1.37% |
| Samsung HD160JJ 160GB | 1 | 1.37% |
| Samsung HD154UI 1TB | 1 | 1.37% |
| Samsung HD103SJ 1TB | 1 | 1.37% |
| PNY CS900 120GB SSD | 1 | 1.37% |
| Netac SSD 128GB | 1 | 1.37% |
| Maxtor 6V250F0 256GB | 1 | 1.37% |
| Maxtor 4D040H2 41GB | 1 | 1.37% |
| Maxtor 2B020H1 20GB | 1 | 1.37% |
| Kingston SV300S37A60G 64GB SSD | 1 | 1.37% |
| Kingston SV300S37A120G 120GB SSD | 1 | 1.37% |
| Kingston SA2000M8250G 250GB | 1 | 1.37% |
| Intenso SSD 120GB | 1 | 1.37% |
| Hitachi HTS543232A7A384 320GB | 1 | 1.37% |
| Crucial M4-CT128M4SSD2 128GB | 1 | 1.37% |
| Crucial CT240BX500SSD1 240GB | 1 | 1.37% |
| Crucial CT1000MX500SSD1 1TB | 1 | 1.37% |
| China SSD 120GB | 1 | 1.37% |
| China SATA SSD 120GB | 1 | 1.37% |
HDD Vendor
Hard disk drive vendors


| Vendor | Desktops | Drives | Percent |
|---|---|---|---|
| WDC | 16 | 18 | 42.11% |
| Samsung Electronics | 10 | 12 | 26.32% |
| Toshiba | 5 | 6 | 13.16% |
| Seagate | 3 | 4 | 7.89% |
| Maxtor | 3 | 3 | 7.89% |
| Hitachi | 1 | 1 | 2.63% |
SSD Vendor
Solid state drive vendors


| Vendor | Desktops | Drives | Percent |
|---|---|---|---|
| Samsung Electronics | 5 | 6 | 20.83% |
| WDC | 4 | 5 | 16.67% |
| Kingston | 4 | 4 | 16.67% |
| Crucial | 3 | 3 | 12.5% |
| China | 2 | 2 | 8.33% |
| Toshiba | 1 | 1 | 4.17% |
| PNY | 1 | 1 | 4.17% |
| Netac | 1 | 1 | 4.17% |
| Intenso | 1 | 1 | 4.17% |
| Apacer | 1 | 1 | 4.17% |
| A-DATA Technology | 1 | 1 | 4.17% |
Drive Kind
HDD or SSD


| Kind | Desktops | Drives | Percent |
|---|---|---|---|
| HDD | 30 | 44 | 55.56% |
| SSD | 19 | 26 | 35.19% |
| NVMe | 5 | 5 | 9.26% |
Drive Connector
SATA, SAS, NVMe, etc.


| Type | Desktops | Drives | Percent |
|---|---|---|---|
| SATA | 36 | 70 | 87.8% |
| NVMe | 5 | 5 | 12.2% |
Drive Size
Size of hard drive


| Size in TB | Desktops | Drives | Percent |
|---|---|---|---|
| 0.01-0.5 | 29 | 47 | 60.42% |
| 0.51-1.0 | 16 | 19 | 33.33% |
| 1.01-2.0 | 2 | 2 | 4.17% |
| 2.01-3.0 | 1 | 2 | 2.08% |
Space Total
Amount of disk space available on the file system


| Size in GB | Desktops | Percent |
|---|---|---|
| Unknown | 34 | 89.47% |
| 251-500 | 2 | 5.26% |
| 101-250 | 2 | 5.26% |
Space Used
Amount of used disk space


| Used GB | Desktops | Percent |
|---|---|---|
| Unknown | 34 | 89.47% |
| 1-20 | 4 | 10.53% |
Malfunc. Drives
Drive models with a malfunction


| Model | Desktops | Drives | Percent |
|---|---|---|---|
| Samsung Electronics HD103UJ 1TB | 4 | 4 | 18.18% |
| Toshiba DT01ACA100 1TB | 2 | 2 | 9.09% |
| WDC WD800JD-55MUA1 80GB | 1 | 1 | 4.55% |
| WDC WD5000AAKX-08U6AA0 500GB | 1 | 1 | 4.55% |
| WDC WD5000AAKX-001CA0 500GB | 1 | 1 | 4.55% |
| WDC WD2500AAJS-75B4A0 250GB | 1 | 1 | 4.55% |
| WDC WD20PURX-64P6ZY0 2TB | 1 | 1 | 4.55% |
| WDC WD1600AAJB-56WRA0 160GB | 1 | 1 | 4.55% |
| WDC WD10EZEX-60M2NA0 1TB | 1 | 1 | 4.55% |
| WDC WD10EZEX-08WN4A0 1TB | 1 | 1 | 4.55% |
| Toshiba MK1646GSX 160GB | 1 | 1 | 4.55% |
| Toshiba DT01ACA050 500GB | 1 | 1 | 4.55% |
| Seagate ST500DM002-1BD142 500GB | 1 | 2 | 4.55% |
| Seagate ST31500341AS 1TB | 1 | 1 | 4.55% |
| Samsung Electronics SP2004C 200GB | 1 | 1 | 4.55% |
| Samsung Electronics HD204UI 2TB | 1 | 1 | 4.55% |
| Maxtor 6V250F0 256GB | 1 | 1 | 4.55% |
| Maxtor 2B020H1 20GB | 1 | 1 | 4.55% |
Malfunc. Drive Vendor
Vendors of faulty drives


| Vendor | Desktops | Drives | Percent |
|---|---|---|---|
| WDC | 7 | 8 | 35% |
| Samsung Electronics | 5 | 6 | 25% |
| Toshiba | 4 | 4 | 20% |
| Seagate | 2 | 3 | 10% |
| Maxtor | 2 | 2 | 10% |
Malfunc. HDD Vendor
Vendors of faulty HDD drives


| Vendor | Desktops | Drives | Percent |
|---|---|---|---|
| WDC | 7 | 8 | 35% |
| Samsung Electronics | 5 | 6 | 25% |
| Toshiba | 4 | 4 | 20% |
| Seagate | 2 | 3 | 10% |
| Maxtor | 2 | 2 | 10% |
Malfunc. Drive Kind
Kinds of faulty drives


| Kind | Desktops | Drives | Percent |
|---|---|---|---|
| HDD | 16 | 23 | 100% |
Failed Drives
Failed drive models
Zero info for selected period =(
Failed Drive Vendor
Failed drive vendors
Zero info for selected period =(
Drive Status
Number of failed and malfunc. drives


| Status | Desktops | Drives | Percent |
|---|---|---|---|
| Works | 28 | 51 | 62.22% |
| Malfunc | 16 | 23 | 35.56% |
| Detected | 1 | 1 | 2.22% |
Storage controller
Storage Vendor
Storage controller vendors


| Vendor | Desktops | Percent |
|---|---|---|
| Intel | 28 | 58.33% |
| AMD | 8 | 16.67% |
| Silicon Motion | 3 | 6.25% |
| JMicron Technology | 2 | 4.17% |
| VIA Technologies | 1 | 2.08% |
| Silicon Image | 1 | 2.08% |
| Nvidia | 1 | 2.08% |
| Kingston Technology Company | 1 | 2.08% |
| ADATA Technology | 1 | 2.08% |
| Adaptec | 1 | 2.08% |
| 3ware | 1 | 2.08% |
Storage Model
Storage controller models


| Model | Desktops | Percent |
|---|---|---|
| AMD FCH SATA Controller [AHCI mode] | 6 | 8.7% |
| Intel NM10/ICH7 Family SATA Controller [IDE mode] | 5 | 7.25% |
| Intel 82801G (ICH7 Family) IDE Controller | 5 | 7.25% |
| Intel 200 Series PCH SATA controller [AHCI mode] | 4 | 5.8% |
| Silicon Motion SM2263EN/SM2263XT SSD Controller | 3 | 4.35% |
| AMD 400 Series Chipset SATA Controller | 3 | 4.35% |
| JMicron JMB363 SATA/IDE Controller | 2 | 2.9% |
| Intel 82801JI (ICH10 Family) 4 port SATA IDE Controller #1 | 2 | 2.9% |
| Intel 82801JI (ICH10 Family) 2 port SATA IDE Controller #2 | 2 | 2.9% |
| Intel 82801JD/DO (ICH10 Family) SATA AHCI Controller | 2 | 2.9% |
| Intel 8 Series/C220 Series Chipset Family 6-port SATA Controller 1 [AHCI mode] | 2 | 2.9% |
| Intel 7 Series/C210 Series Chipset Family 6-port SATA Controller [AHCI mode] | 2 | 2.9% |
| Intel 6 Series/C200 Series Chipset Family Desktop SATA Controller (IDE mode, ports 4-5) | 2 | 2.9% |
| Intel 6 Series/C200 Series Chipset Family Desktop SATA Controller (IDE mode, ports 0-3) | 2 | 2.9% |
| Intel 6 Series/C200 Series Chipset Family 6 port Desktop SATA AHCI Controller | 2 | 2.9% |
| AMD FCH IDE Controller | 2 | 2.9% |
| VIA VT82C586A/B/VT82C686/A/B/VT823x/A/C PIPC Bus Master IDE | 1 | 1.45% |
| VIA VT8237/8251 Serial ATA Controller | 1 | 1.45% |
| Silicon Image SiI 3114 [SATALink/SATARaid] Serial ATA Controller | 1 | 1.45% |
| Nvidia CK804 Serial ATA Controller | 1 | 1.45% |
| Nvidia CK804 IDE | 1 | 1.45% |
| Kingston Company A2000 NVMe SSD | 1 | 1.45% |
| Intel SATA Controller [RAID mode] | 1 | 1.45% |
| Intel Q170/Q150/B150/H170/H110/Z170/CM236 Chipset SATA Controller [AHCI Mode] | 1 | 1.45% |
| Intel NM10/ICH7 Family SATA Controller [AHCI mode] | 1 | 1.45% |
| Intel C602 chipset 4-Port SATA Storage Control Unit | 1 | 1.45% |
| Intel C600/X79 series chipset IDE-r Controller | 1 | 1.45% |
| Intel C600/X79 series chipset 6-Port SATA AHCI Controller | 1 | 1.45% |
| Intel 82801JI (ICH10 Family) SATA AHCI Controller | 1 | 1.45% |
| Intel 82801IR/IO/IH (ICH9R/DO/DH) 6 port SATA Controller [AHCI mode] | 1 | 1.45% |
| Intel 7 Series/C210 Series Chipset Family 4-port SATA Controller [IDE mode] | 1 | 1.45% |
| Intel 7 Series/C210 Series Chipset Family 2-port SATA Controller [IDE mode] | 1 | 1.45% |
| Intel 4 Series Chipset PT IDER Controller | 1 | 1.45% |
| AMD SB7x0/SB8x0/SB9x0 SATA Controller [IDE mode] | 1 | 1.45% |
| AMD SB7x0/SB8x0/SB9x0 IDE Controller | 1 | 1.45% |
| AMD FCH SATA Controller D | 1 | 1.45% |
| ADATA XPG SX8200 Pro PCIe Gen3x4 M.2 2280 Solid State Drive | 1 | 1.45% |
| Adaptec AIC-7870P/7871 [AHA-2940/W/S76] | 1 | 1.45% |
| 3ware 7xxx/8xxx-series PATA/SATA-RAID | 1 | 1.45% |
Storage Kind
Kind of storage controller (IDE, SATA, NVMe, SAS, ...)


| Kind | Desktops | Percent |
|---|---|---|
| SATA | 25 | 47.17% |
| IDE | 18 | 33.96% |
| NVMe | 5 | 9.43% |
| RAID | 3 | 5.66% |
| SAS | 1 | 1.89% |
| SCSI | 1 | 1.89% |
Processor
CPU Vendor
Processor vendors


| Vendor | Desktops | Percent |
|---|---|---|
| Intel | 29 | 76.32% |
| AMD | 9 | 23.68% |
CPU Model
Processor models


| Model | Desktops | Percent |
|---|---|---|
| Intel Core i3-8100 CPU @ 3.60GHz | 3 | 7.89% |
| Intel Pentium Dual-Core CPU E5700 @ 3.00GHz | 2 | 5.26% |
| Intel Core i3-2120 CPU @ 3.30GHz | 2 | 5.26% |
| Intel Core 2 Quad CPU Q9400 @ 2.66GHz | 2 | 5.26% |
| Intel Core 2 Duo CPU E8400 @ 3.00GHz | 2 | 5.26% |
| Intel Xeon CPU X5677 @ 3.47GHz | 1 | 2.63% |
| Intel Xeon CPU X5472 @ 3.00GHz | 1 | 2.63% |
| Intel Xeon CPU E5-2620 0 @ 2.00GHz | 1 | 2.63% |
| Intel Pentium CPU G3430 @ 3.30GHz | 1 | 2.63% |
| Intel Pentium CPU G3240 @ 3.10GHz | 1 | 2.63% |
| Intel Core i7-6700K CPU @ 4.00GHz | 1 | 2.63% |
| Intel Core i7 CPU X 980 @ 3.33GHz | 1 | 2.63% |
| Intel Core i5-8400 CPU @ 2.80GHz | 1 | 2.63% |
| Intel Core i5-3470 CPU @ 3.20GHz | 1 | 2.63% |
| Intel Core i5-2400 CPU @ 3.10GHz | 1 | 2.63% |
| Intel Core i5-2300 CPU @ 2.80GHz | 1 | 2.63% |
| Intel Core i3-3225 CPU @ 3.30GHz | 1 | 2.63% |
| Intel Core i3-3220 CPU @ 3.30GHz | 1 | 2.63% |
| Intel Core 2 Quad CPU Q9300 @ 2.50GHz | 1 | 2.63% |
| Intel Core 2 Duo CPU E7500 @ 2.93GHz | 1 | 2.63% |
| Intel Core 2 Duo CPU E6550 @ 2.33GHz | 1 | 2.63% |
| Intel Celeron CPU G1610 @ 2.60GHz | 1 | 2.63% |
| Intel Celeron CPU 430 @ 1.80GHz | 1 | 2.63% |
| AMD Sempron 3850 APU with Radeon R3 | 1 | 2.63% |
| AMD Ryzen 5 3600X 6-Core Processor | 1 | 2.63% |
| AMD Ryzen 5 3600 6-Core Processor | 1 | 2.63% |
| AMD Ryzen 3 3200G with Radeon Vega Graphics | 1 | 2.63% |
| AMD Ryzen 3 2200G with Radeon Vega Graphics | 1 | 2.63% |
| AMD Phenom II X4 940 Processor | 1 | 2.63% |
| AMD Athlon 64 Processor 3200+ | 1 | 2.63% |
| AMD A8-6600K APU with Radeon HD Graphics | 1 | 2.63% |
| AMD A4-5300 APU with Radeon HD Graphics | 1 | 2.63% |
CPU Model Family
Processor model prefix


| Model | Desktops | Percent |
|---|---|---|
| Intel Core i3 | 7 | 18.42% |
| Intel Core i5 | 4 | 10.53% |
| Intel Core 2 Duo | 4 | 10.53% |
| Intel Xeon | 3 | 7.89% |
| Intel Core 2 Quad | 3 | 7.89% |
| Intel Pentium Dual-Core | 2 | 5.26% |
| Intel Pentium | 2 | 5.26% |
| Intel Core i7 | 2 | 5.26% |
| Intel Celeron | 2 | 5.26% |
| AMD Ryzen 5 | 2 | 5.26% |
| AMD Ryzen 3 | 2 | 5.26% |
| AMD Sempron | 1 | 2.63% |
| AMD Phenom II X4 | 1 | 2.63% |
| AMD Athlon 64 | 1 | 2.63% |
| AMD A8 | 1 | 2.63% |
| AMD A4 | 1 | 2.63% |
CPU Cores
Number of processor cores


| Number | Desktops | Percent |
|---|---|---|
| 4 | 15 | 39.47% |
| 2 | 14 | 36.84% |
| 6 | 4 | 10.53% |
| 1 | 3 | 7.89% |
| 12 | 1 | 2.63% |
| 8 | 1 | 2.63% |
CPU Sockets
Number of sockets


| Number | Desktops | Percent |
|---|---|---|
| 1 | 36 | 94.74% |
| 2 | 2 | 5.26% |
CPU Threads
Threads per core (Hyper-Threading)


| Number | Desktops | Percent |
|---|---|---|
| 1 | 26 | 68.42% |
| 2 | 12 | 31.58% |
CPU Op-Modes
CPU Operation Modes (32-bit, 64-bit)


| Op mode | Desktops | Percent |
|---|---|---|
| 32-bit, 64-bit | 38 | 100% |
CPU Microcode
Microcode number


| Number | Desktops | Percent |
|---|---|---|
| 0x1067a | 7 | 18.42% |
| 0x306a9 | 4 | 10.53% |
| 0x206a7 | 4 | 10.53% |
| 0x906eb | 3 | 7.89% |
| 0x306c3 | 2 | 5.26% |
| 0x206c2 | 2 | 5.26% |
| 0x06001119 | 2 | 5.26% |
| 0x906ea | 1 | 2.63% |
| 0x6fb | 1 | 2.63% |
| 0x506e3 | 1 | 2.63% |
| 0x206d7 | 1 | 2.63% |
| 0x10677 | 1 | 2.63% |
| 0x10676 | 1 | 2.63% |
| 0x10661 | 1 | 2.63% |
| 0x08701021 | 1 | 2.63% |
| 0x08701013 | 1 | 2.63% |
| 0x08108109 | 1 | 2.63% |
| 0x0810100b | 1 | 2.63% |
| 0x0700010f | 1 | 2.63% |
| 0x010000db | 1 | 2.63% |
| Unknown | 1 | 2.63% |
CPU Microarch
Microarchitecture


| Name | Desktops | Percent |
|---|---|---|
| Penryn | 9 | 23.68% |
| SandyBridge | 5 | 13.16% |
| KabyLake | 4 | 10.53% |
| IvyBridge | 4 | 10.53% |
| Zen 2 | 2 | 5.26% |
| Westmere | 2 | 5.26% |
| Piledriver | 2 | 5.26% |
| Haswell | 2 | 5.26% |
| Core | 2 | 5.26% |
| Zen+ | 1 | 2.63% |
| Zen | 1 | 2.63% |
| Skylake | 1 | 2.63% |
| K8 Hammer | 1 | 2.63% |
| K10 | 1 | 2.63% |
| Jaguar | 1 | 2.63% |
Graphics
GPU Vendor
Vendors of graphics cards


| Vendor | Desktops | Percent |
|---|---|---|
| Nvidia | 14 | 35.9% |
| Intel | 14 | 35.9% |
| AMD | 11 | 28.21% |
GPU Model
Graphics card models


| Model | Desktops | Percent |
|---|---|---|
| Intel CoffeeLake-S GT2 [UHD Graphics 630] | 3 | 7.32% |
| Intel 4 Series Chipset Integrated Graphics Controller | 3 | 7.32% |
| Nvidia GP108 [GeForce GT 1030] | 2 | 4.88% |
| Intel Xeon E3-1200 v3/4th Gen Core Processor Integrated Graphics Controller | 2 | 4.88% |
| Intel 82G33/G31 Express Integrated Graphics Controller | 2 | 4.88% |
| Intel 2nd Generation Core Processor Family Integrated Graphics Controller | 2 | 4.88% |
| Nvidia TU116 [GeForce GTX 1660 SUPER] | 1 | 2.44% |
| Nvidia NV43 [GeForce 6600 GT] | 1 | 2.44% |
| Nvidia GT218 [GeForce 210] | 1 | 2.44% |
| Nvidia GP107 [GeForce GTX 1050 Ti] | 1 | 2.44% |
| Nvidia GP106 [GeForce GTX 1060 6GB] | 1 | 2.44% |
| Nvidia GK208B [GeForce GT 730] | 1 | 2.44% |
| Nvidia GK208B [GeForce GT 710] | 1 | 2.44% |
| Nvidia GK107GL [Quadro K2000] | 1 | 2.44% |
| Nvidia GK107 [GeForce GTX 650] | 1 | 2.44% |
| Nvidia GF108 [GeForce GT 630] | 1 | 2.44% |
| Nvidia G96C [GeForce 9500 GT] | 1 | 2.44% |
| Nvidia G73 [GeForce 7300 GT] | 1 | 2.44% |
| Intel HD Graphics 530 | 1 | 2.44% |
| Intel 82Q35 Express Integrated Graphics Controller | 1 | 2.44% |
| AMD Trinity 2 [Radeon HD 7480D] | 1 | 2.44% |
| AMD RV770 [Radeon HD 4850] | 1 | 2.44% |
| AMD RV630 XT [Radeon HD 2600 XT] | 1 | 2.44% |
| AMD Richland [Radeon HD 8570D] | 1 | 2.44% |
| AMD Redwood XT [Radeon HD 5670/5690/5730] | 1 | 2.44% |
| AMD Raven Ridge [Radeon Vega Series / Radeon Vega Mobile Series] | 1 | 2.44% |
| AMD Picasso | 1 | 2.44% |
| AMD Oland PRO [Radeon R7 240/340] | 1 | 2.44% |
| AMD Kabini [Radeon HD 8280 / R3 Series] | 1 | 2.44% |
| AMD Cypress XT [Radeon HD 5870] | 1 | 2.44% |
| AMD Cedar [Radeon HD 5000/6000/7350/8350 Series] | 1 | 2.44% |
| AMD Cape Verde XT [Radeon HD 7770/8760 / R7 250X] | 1 | 2.44% |
| AMD Caicos [Radeon HD 6450/7450/8450 / R5 230 OEM] | 1 | 2.44% |
GPU Combo
Combinations of graphics cards


| Name | Desktops | Percent |
|---|---|---|
| 1 x Intel | 14 | 36.84% |
| 1 x Nvidia | 13 | 34.21% |
| 1 x AMD | 8 | 21.05% |
| 2 x AMD | 2 | 5.26% |
| AMD + Nvidia | 1 | 2.63% |
GPU Driver
Free vs proprietary


| Driver | Desktops | Percent |
|---|---|---|
| Free | 38 | 100% |
GPU Memory
Total video memory


| Size in GB | Desktops | Percent |
|---|---|---|
| Unknown | 14 | 36.84% |
| 0.51-1.0 | 9 | 23.68% |
| 1.01-2.0 | 6 | 15.79% |
| 0.01-0.5 | 6 | 15.79% |
| 5.01-6.0 | 2 | 5.26% |
| 3.01-4.0 | 1 | 2.63% |
Monitor
Monitor Vendor
Monitor vendors


| Vendor | Desktops | Percent |
|---|---|---|
| Samsung Electronics | 7 | 17.07% |
| Goldstar | 4 | 9.76% |
| Dell | 4 | 9.76% |
| Lenovo | 3 | 7.32% |
| Ancor Communications | 3 | 7.32% |
| Vestel Elektronik | 2 | 4.88% |
| Iiyama | 2 | 4.88% |
| BenQ | 2 | 4.88% |
| Acer | 2 | 4.88% |
| ZLS | 1 | 2.44% |
| ViewSonic | 1 | 2.44% |
| Toshiba | 1 | 2.44% |
| Philips | 1 | 2.44% |
| Panasonic | 1 | 2.44% |
| MStar | 1 | 2.44% |
| HannStar | 1 | 2.44% |
| Gericom | 1 | 2.44% |
| Fujitsu Siemens | 1 | 2.44% |
| CVT | 1 | 2.44% |
| ASUSTek Computer | 1 | 2.44% |
| AOC | 1 | 2.44% |
Monitor Model
Monitor models


| Model | Desktops | Percent |
|---|---|---|
| Lenovo LEN L171p LEN24C9 1280x1024 338x270mm 17.0-inch | 3 | 7.14% |
| Vestel Elektronik 50UHD_LCD_TV VES3700 3840x2160 1872x1053mm 84.6-inch | 2 | 4.76% |
| ZLS VMD-1951 ZLS1950 1600x900 | 1 | 2.38% |
| ViewSonic VA702 VSC1C1C 1280x1024 338x270mm 17.0-inch | 1 | 2.38% |
| Toshiba TV TSB0108 1920x1080 890x500mm 40.2-inch | 1 | 2.38% |
| Samsung Electronics SyncMaster SAM011E 1280x1024 338x270mm 17.0-inch | 1 | 2.38% |
| Samsung Electronics SMS24A850 SAM0825 1920x1200 518x324mm 24.1-inch | 1 | 2.38% |
| Samsung Electronics S24D330 SAM0D92 1920x1080 531x299mm 24.0-inch | 1 | 2.38% |
| Samsung Electronics S22C300 SAM0A1F 1920x1080 477x268mm 21.5-inch | 1 | 2.38% |
| Samsung Electronics S19B150 SAM08A2 1366x768 410x230mm 18.5-inch | 1 | 2.38% |
| Samsung Electronics LCD Monitor SAM025D 1360x768 885x498mm 40.0-inch | 1 | 2.38% |
| Samsung Electronics EPSON PJ SECA114 1600x1200 | 1 | 2.38% |
| Philips 196V4 PHLC0AF 1366x768 410x230mm 18.5-inch | 1 | 2.38% |
| Panasonic TV MEIC0FD 1920x540 1434x806mm 64.8-inch | 1 | 2.38% |
| MStar TV_MONITOR MST0030 1440x900 1150x650mm 52.0-inch | 1 | 2.38% |
| Iiyama PL2473HD IVM6107 1920x1080 521x293mm 23.5-inch | 1 | 2.38% |
| Iiyama PL2294H IVM563B 1920x1080 476x268mm 21.5-inch | 1 | 2.38% |
| HannStar HX191D HSD15C6 1280x1024 376x301mm 19.0-inch | 1 | 2.38% |
| Goldstar MP59G GSM5B34 1920x1080 480x270mm 21.7-inch | 1 | 2.38% |
| Goldstar L1953TR GSM4B43 1280x1024 338x270mm 17.0-inch | 1 | 2.38% |
| Goldstar L1919S GSM4AF2 1280x1024 380x300mm 19.1-inch | 1 | 2.38% |
| Goldstar HDR WFHD GSM7715 2560x1080 798x334mm 34.1-inch | 1 | 2.38% |
| Goldstar E2350 GSM5790 1920x1080 510x290mm 23.1-inch | 1 | 2.38% |
| Gericom Q19 QMX52C6 1440x900 410x257mm 19.1-inch | 1 | 2.38% |
| Fujitsu Siemens B22W-5 ECO FUS07C4 1680x1050 474x296mm 22.0-inch | 1 | 2.38% |
| Dell P2213 DELF041 1680x1050 473x296mm 22.0-inch | 1 | 2.38% |
| Dell M783p DEL700D 1280x1024 306x230mm 15.1-inch | 1 | 2.38% |
| Dell 2209WA DELF010 1680x1050 470x300mm 22.0-inch | 1 | 2.38% |
| Dell 2208WFP DEL403B 1680x1050 473x296mm 22.0-inch | 1 | 2.38% |
| CVT CVTE TV CVT0003 1920x1080 575x323mm 26.0-inch | 1 | 2.38% |
| BenQ G2010W BNQ7811 1680x1050 474x296mm 22.0-inch | 1 | 2.38% |
| BenQ EW277HDR BNQ7948 1920x1080 598x336mm 27.0-inch | 1 | 2.38% |
| ASUSTek Computer XG32V AUS32B1 2560x1440 697x393mm 31.5-inch | 1 | 2.38% |
| AOC 2200W AOC2200 1920x1080 476x268mm 21.5-inch | 1 | 2.38% |
| Ancor Communications VX248 ACI24C5 1920x1080 530x300mm 24.0-inch | 1 | 2.38% |
| Ancor Communications VW195 ACI19AB 1440x900 410x260mm 19.1-inch | 1 | 2.38% |
| Ancor Communications ASUS VW193D ACI19D5 1440x900 408x255mm 18.9-inch | 1 | 2.38% |
| Acer V203H ACR00C7 1600x900 443x249mm 20.0-inch | 1 | 2.38% |
| Acer AL2416W ACRAD61 1920x1200 518x324mm 24.1-inch | 1 | 2.38% |
Monitor Resolution
Monitor screen resolution


| Resolution | Desktops | Percent |
|---|---|---|
| 1920x1080 (FHD) | 10 | 25% |
| 1280x1024 (SXGA) | 7 | 17.5% |
| 1680x1050 (WSXGA+) | 5 | 12.5% |
| 3840x2160 (4K) | 3 | 7.5% |
| 1440x900 (WXGA+) | 3 | 7.5% |
| 1920x540 | 2 | 5% |
| 1920x1200 (WUXGA) | 2 | 5% |
| 1600x900 (HD+) | 2 | 5% |
| 1366x768 (WXGA) | 2 | 5% |
| 2560x1440 (QHD) | 1 | 2.5% |
| 2560x1080 | 1 | 2.5% |
| 1600x1200 | 1 | 2.5% |
| 1360x768 | 1 | 2.5% |
Monitor Diagonal
Diagonal size in inches


| Inches | Desktops | Percent |
|---|---|---|
| 22 | 5 | 12.5% |
| 17 | 5 | 12.5% |
| 24 | 4 | 10% |
| 19 | 4 | 10% |
| 23 | 3 | 7.5% |
| 21 | 3 | 7.5% |
| 84 | 2 | 5% |
| 18 | 2 | 5% |
| Unknown | 2 | 5% |
| 72 | 1 | 2.5% |
| 64 | 1 | 2.5% |
| 52 | 1 | 2.5% |
| 40 | 1 | 2.5% |
| 34 | 1 | 2.5% |
| 31 | 1 | 2.5% |
| 27 | 1 | 2.5% |
| 26 | 1 | 2.5% |
| 20 | 1 | 2.5% |
| 15 | 1 | 2.5% |
Monitor Width
Physical width


| Width in mm | Desktops | Percent |
|---|---|---|
| 401-500 | 14 | 35% |
| 501-600 | 9 | 22.5% |
| 301-350 | 6 | 15% |
| 1501-2000 | 3 | 7.5% |
| 1001-1500 | 2 | 5% |
| Unknown | 2 | 5% |
| 801-900 | 1 | 2.5% |
| 701-800 | 1 | 2.5% |
| 601-700 | 1 | 2.5% |
| 351-400 | 1 | 2.5% |
Aspect Ratio
Proportional relationship between the width and the height


| Ratio | Desktops | Percent |
|---|---|---|
| 16/9 | 20 | 51.28% |
| 16/10 | 10 | 25.64% |
| 5/4 | 6 | 15.38% |
| 4/3 | 2 | 5.13% |
| 21/9 | 1 | 2.56% |
Monitor Area
Area in inch²


| Area in inch² | Desktops | Percent |
|---|---|---|
| 201-250 | 11 | 27.5% |
| 151-200 | 7 | 17.5% |
| 141-150 | 7 | 17.5% |
| More than 1000 | 5 | 12.5% |
| 251-300 | 3 | 7.5% |
| 351-500 | 2 | 5% |
| Unknown | 2 | 5% |
| 301-350 | 1 | 2.5% |
| 101-110 | 1 | 2.5% |
| 501-1000 | 1 | 2.5% |
Pixel Density
Pixels per inch


| Density | Desktops | Percent |
|---|---|---|
| 51-100 | 29 | 74.36% |
| 1-50 | 4 | 10.26% |
| 101-120 | 4 | 10.26% |
| Unknown | 2 | 5.13% |
Multiple Monitors
Total monitors connected


| Total | Desktops | Percent |
|---|---|---|
| 1 | 35 | 92.11% |
| 2 | 2 | 5.26% |
| 3 | 1 | 2.63% |
Network
Net Controller Vendor
Controller vendors


| Vendor | Desktops | Percent |
|---|---|---|
| Realtek Semiconductor | 21 | 41.18% |
| Intel | 9 | 17.65% |
| Qualcomm Atheros | 6 | 11.76% |
| TP-Link | 3 | 5.88% |
| Ralink | 2 | 3.92% |
| Broadcom Limited | 2 | 3.92% |
| Broadcom | 2 | 3.92% |
| VIA Technologies | 1 | 1.96% |
| Qualcomm | 1 | 1.96% |
| Nvidia | 1 | 1.96% |
| Marvell Technology Group | 1 | 1.96% |
| D-Link | 1 | 1.96% |
| ASUSTek Computer | 1 | 1.96% |
Net Controller Model
Controller models


| Model | Desktops | Percent |
|---|---|---|
| Realtek RTL8111/8168/8411 PCI Express Gigabit Ethernet Controller | 19 | 36.54% |
| Intel 82579LM Gigabit Network Connection (Lewisville) | 4 | 7.69% |
| TP-Link TL-WN821N Version 5 RTL8192EU | 3 | 5.77% |
| Qualcomm Atheros QCA8171 Gigabit Ethernet | 2 | 3.85% |
| Qualcomm Atheros AR922X Wireless Network Adapter | 2 | 3.85% |
| Intel I211 Gigabit Network Connection | 2 | 3.85% |
| Intel 82567LM-3 Gigabit Network Connection | 2 | 3.85% |
| VIA VT6102/VT6103 [Rhine-II] | 1 | 1.92% |
| Realtek RTL8188CUS 802.11n WLAN Adapter | 1 | 1.92% |
| Realtek RTL8169 PCI Gigabit Ethernet Controller | 1 | 1.92% |
| Realtek RTL-8100/8101L/8139 PCI Fast Ethernet Adapter | 1 | 1.92% |
| Ralink RT2760 Wireless 802.11n 1T/2R | 1 | 1.92% |
| Ralink RT2561/RT61 802.11g PCI | 1 | 1.92% |
| Qualcomm Mobile Router | 1 | 1.92% |
| Qualcomm Atheros AR8151 v1.0 Gigabit Ethernet | 1 | 1.92% |
| Qualcomm Atheros AR5413/AR5414 Wireless Network Adapter [AR5006X(S) 802.11abg] | 1 | 1.92% |
| Nvidia CK804 Ethernet Controller | 1 | 1.92% |
| Marvell Group 88E8056 PCI-E Gigabit Ethernet Controller | 1 | 1.92% |
| Intel 82566DM-2 Gigabit Network Connection | 1 | 1.92% |
| D-Link GO-USB-N150 N Adapter | 1 | 1.92% |
| Broadcom NetXtreme BCM5754 Gigabit Ethernet PCI Express | 1 | 1.92% |
| Broadcom NetLink BCM57780 Gigabit Ethernet PCIe | 1 | 1.92% |
| Broadcom Limited NetXtreme BCM5755 Gigabit Ethernet PCI Express | 1 | 1.92% |
| Broadcom Limited NetLink BCM5787 Gigabit Ethernet PCI Express | 1 | 1.92% |
| ASUS N10 Nano 802.11n Network Adapter [Realtek RTL8192CU] | 1 | 1.92% |
Wireless Vendor
Wireless vendors


| Vendor | Desktops | Percent |
|---|---|---|
| TP-Link | 3 | 27.27% |
| Qualcomm Atheros | 3 | 27.27% |
| Ralink | 2 | 18.18% |
| Realtek Semiconductor | 1 | 9.09% |
| D-Link | 1 | 9.09% |
| ASUSTek Computer | 1 | 9.09% |
Wireless Model
Wireless models


| Model | Desktops | Percent |
|---|---|---|
| TP-Link TL-WN821N Version 5 RTL8192EU | 3 | 27.27% |
| Qualcomm Atheros AR922X Wireless Network Adapter | 2 | 18.18% |
| Realtek RTL8188CUS 802.11n WLAN Adapter | 1 | 9.09% |
| Ralink RT2760 Wireless 802.11n 1T/2R | 1 | 9.09% |
| Ralink RT2561/RT61 802.11g PCI | 1 | 9.09% |
| Qualcomm Atheros AR5413/AR5414 Wireless Network Adapter [AR5006X(S) 802.11abg] | 1 | 9.09% |
| D-Link GO-USB-N150 N Adapter | 1 | 9.09% |
| ASUS N10 Nano 802.11n Network Adapter [Realtek RTL8192CU] | 1 | 9.09% |
Ethernet Vendor
Ethernet vendors


| Vendor | Desktops | Percent |
|---|---|---|
| Realtek Semiconductor | 21 | 51.22% |
| Intel | 9 | 21.95% |
| Qualcomm Atheros | 3 | 7.32% |
| Broadcom Limited | 2 | 4.88% |
| Broadcom | 2 | 4.88% |
| VIA Technologies | 1 | 2.44% |
| Qualcomm | 1 | 2.44% |
| Nvidia | 1 | 2.44% |
| Marvell Technology Group | 1 | 2.44% |
Ethernet Model
Ethernet models


| Model | Desktops | Percent |
|---|---|---|
| Realtek RTL8111/8168/8411 PCI Express Gigabit Ethernet Controller | 19 | 46.34% |
| Intel 82579LM Gigabit Network Connection (Lewisville) | 4 | 9.76% |
| Qualcomm Atheros QCA8171 Gigabit Ethernet | 2 | 4.88% |
| Intel I211 Gigabit Network Connection | 2 | 4.88% |
| Intel 82567LM-3 Gigabit Network Connection | 2 | 4.88% |
| VIA VT6102/VT6103 [Rhine-II] | 1 | 2.44% |
| Realtek RTL8169 PCI Gigabit Ethernet Controller | 1 | 2.44% |
| Realtek RTL-8100/8101L/8139 PCI Fast Ethernet Adapter | 1 | 2.44% |
| Qualcomm Mobile Router | 1 | 2.44% |
| Qualcomm Atheros AR8151 v1.0 Gigabit Ethernet | 1 | 2.44% |
| Nvidia CK804 Ethernet Controller | 1 | 2.44% |
| Marvell Group 88E8056 PCI-E Gigabit Ethernet Controller | 1 | 2.44% |
| Intel 82566DM-2 Gigabit Network Connection | 1 | 2.44% |
| Broadcom NetXtreme BCM5754 Gigabit Ethernet PCI Express | 1 | 2.44% |
| Broadcom NetLink BCM57780 Gigabit Ethernet PCIe | 1 | 2.44% |
| Broadcom Limited NetXtreme BCM5755 Gigabit Ethernet PCI Express | 1 | 2.44% |
| Broadcom Limited NetLink BCM5787 Gigabit Ethernet PCI Express | 1 | 2.44% |
Net Controller Kind
Ethernet, WiFi or modem


| Kind | Desktops | Percent |
|---|---|---|
| Ethernet | 38 | 77.55% |
| WiFi | 11 | 22.45% |
Used Controller
Currently used network controller


| Kind | Desktops | Percent |
|---|---|---|
| Ethernet | 33 | 89.19% |
| WiFi | 4 | 10.81% |
NICs
Total network controllers on board


| Total | Desktops | Percent |
|---|---|---|
| 1 | 30 | 78.95% |
| 2 | 8 | 21.05% |
IPv6
IPv6 vs IPv4


| Used | Desktops | Percent |
|---|---|---|
| No | 26 | 68.42% |
| Yes | 12 | 31.58% |
Bluetooth
Bluetooth Vendor
Controller vendors


| Vendor | Desktops | Percent |
|---|---|---|
| Cambridge Silicon Radio | 1 | 100% |
Bluetooth Model
Controller models


| Model | Desktops | Percent |
|---|---|---|
| Cambridge Silicon Radio Bluetooth Dongle (HCI mode) | 1 | 100% |
Sound
Sound Vendor
Sound card vendors


| Vendor | Desktops | Percent |
|---|---|---|
| Intel | 27 | 46.55% |
| AMD | 13 | 22.41% |
| Nvidia | 12 | 20.69% |
| C-Media Electronics | 2 | 3.45% |
| VIA Technologies | 1 | 1.72% |
| Texas Instruments | 1 | 1.72% |
| Promethean Limited | 1 | 1.72% |
| Kingston Technology | 1 | 1.72% |
Sound Model
Sound card models


| Model | Desktops | Percent |
|---|---|---|
| Intel NM10/ICH7 Family High Definition Audio Controller | 5 | 7.46% |
| Intel 6 Series/C200 Series Chipset Family High Definition Audio Controller | 5 | 7.46% |
| Intel 200 Series PCH HD Audio | 4 | 5.97% |
| Intel 82801JI (ICH10 Family) HD Audio Controller | 3 | 4.48% |
| Intel 7 Series/C216 Chipset Family High Definition Audio Controller | 3 | 4.48% |
| AMD FCH Azalia Controller | 3 | 4.48% |
| Nvidia GP108 High Definition Audio Controller | 2 | 2.99% |
| Nvidia GK208 HDMI/DP Audio Controller | 2 | 2.99% |
| Nvidia GK107 HDMI Audio Controller | 2 | 2.99% |
| Intel 82801JD/DO (ICH10 Family) HD Audio Controller | 2 | 2.99% |
| Intel 8 Series/C220 Series Chipset High Definition Audio Controller | 2 | 2.99% |
| AMD Trinity HDMI Audio Controller | 2 | 2.99% |
| AMD Starship/Matisse HD Audio Controller | 2 | 2.99% |
| AMD Raven/Raven2/Fenghuang HDMI/DP Audio Controller | 2 | 2.99% |
| AMD Oland/Hainan/Cape Verde/Pitcairn HDMI Audio [Radeon HD 7000 Series] | 2 | 2.99% |
| AMD Family 17h (Models 10h-1fh) HD Audio Controller | 2 | 2.99% |
| VIA Technologies VX900/VT8xxx High Definition Audio Controller | 1 | 1.49% |
| Texas Instruments PCM2902 Audio Codec | 1 | 1.49% |
| Promethean Limited Audio | 1 | 1.49% |
| Nvidia TU116 High Definition Audio Controller | 1 | 1.49% |
| Nvidia High Definition Audio Controller | 1 | 1.49% |
| Nvidia GP107GL High Definition Audio Controller | 1 | 1.49% |
| Nvidia GP106 High Definition Audio Controller | 1 | 1.49% |
| Nvidia GF108 High Definition Audio Controller | 1 | 1.49% |
| Nvidia CK804 AC'97 Audio Controller | 1 | 1.49% |
| Kingston Technology HyperX 7.1 Audio | 1 | 1.49% |
| Intel Xeon E3-1200 v3/4th Gen Core Processor HD Audio Controller | 1 | 1.49% |
| Intel C600/X79 series chipset High Definition Audio Controller | 1 | 1.49% |
| Intel 82801I (ICH9 Family) HD Audio Controller | 1 | 1.49% |
| Intel 100 Series/C230 Series Chipset Family HD Audio Controller | 1 | 1.49% |
| C-Media Electronics CMI8788 [Oxygen HD Audio] | 1 | 1.49% |
| C-Media Electronics CM108 Audio Controller | 1 | 1.49% |
| AMD SBx00 Azalia (Intel HDA) | 1 | 1.49% |
| AMD RV770 HDMI Audio [Radeon HD 4850/4870] | 1 | 1.49% |
| AMD RV630 HDMI Audio [Radeon HD 2600 PRO/XT / HD 3610] | 1 | 1.49% |
| AMD Redwood HDMI Audio [Radeon HD 5000 Series] | 1 | 1.49% |
| AMD Kabini HDMI/DP Audio | 1 | 1.49% |
| AMD Cypress HDMI Audio [Radeon HD 5830/5850/5870 / 6850/6870 Rebrand] | 1 | 1.49% |
| AMD Cedar HDMI Audio [Radeon HD 5400/6300/7300 Series] | 1 | 1.49% |
| AMD Caicos HDMI Audio [Radeon HD 6450 / 7450/8450/8490 OEM / R5 230/235/235X OEM] | 1 | 1.49% |
Memory
Memory Vendor
Memory module vendors


| Vendor | Desktops | Percent |
|---|---|---|
| Unknown | 12 | 27.27% |
| Kingston | 11 | 25% |
| Samsung Electronics | 5 | 11.36% |
| SK Hynix | 4 | 9.09% |
| Kingmax | 4 | 9.09% |
| Corsair | 3 | 6.82% |
| Crucial | 2 | 4.55% |
| Patriot | 1 | 2.27% |
| Micron Technology | 1 | 2.27% |
| Intersil | 1 | 2.27% |
Memory Model
Memory module models


| Model | Desktops | Percent |
|---|---|---|
| Kingmax RAM GLAG42F-18--------- 8192MB DIMM DDR4 2400MT/s | 3 | 5.88% |
| Kingmax RAM GLAF62F-D8--------- 4096MB DIMM DDR4 2400MT/s | 3 | 5.88% |
| Unknown RAM Module 2048MB DIMM SDRAM | 2 | 3.92% |
| Unknown RAM Module 2048MB DIMM 800MT/s | 2 | 3.92% |
| Unknown RAM Module 2048MB DIMM 400MT/s | 2 | 3.92% |
| Kingston RAM KHX3200C16D4/8GX 8GB DIMM DDR4 3533MT/s | 2 | 3.92% |
| Unknown RAM V02L3L84GB52852816 4096MB DIMM DDR3 1333MT/s | 1 | 1.96% |
| Unknown RAM Module 8192MB DIMM 1333MT/s | 1 | 1.96% |
| Unknown RAM Module 4096MB DIMM DDR3 800MT/s | 1 | 1.96% |
| Unknown RAM Module 2048MB DIMM 1333MT/s | 1 | 1.96% |
| Unknown RAM Module 1024MB DIMM DDR2 667MT/s | 1 | 1.96% |
| Unknown RAM Module 1024MB DIMM 800MT/s | 1 | 1.96% |
| Unknown RAM Module 1024MB DIMM 400MT/s | 1 | 1.96% |
| SK Hynix RAM HMT451U6AFR8C 4096MB DIMM DDR3 1600MT/s | 1 | 1.96% |
| SK Hynix RAM HMT41GU6AFR8A-PB 8GB DIMM DDR3 1600MT/s | 1 | 1.96% |
| SK Hynix RAM HMT41GR7BFR4A-PB 8192MB DIMM DDR3 1333MT/s | 1 | 1.96% |
| SK Hynix RAM HMT41GR7AFR4A-PB 8192MB DIMM DDR3 1600MT/s | 1 | 1.96% |
| SK Hynix RAM HMT151R7BFR4C-H9 4096MB DIMM DDR3 1333MT/s | 1 | 1.96% |
| SK Hynix RAM DMT451E6AFR8C-PB 4096MB DIMM DDR3 1600MT/s | 1 | 1.96% |
| Samsung RAM M378B5773CH0-CH9 2048MB DIMM DDR3 1867MT/s | 1 | 1.96% |
| Samsung RAM M378B5273DH0-CH9 4GB DIMM DDR3 2133MT/s | 1 | 1.96% |
| Samsung RAM M378B5273CH0-CK0 4096MB DIMM DDR3 2000MT/s | 1 | 1.96% |
| Samsung RAM M378B5173QH0-CK0 4GB DIMM DDR3 1866MT/s | 1 | 1.96% |
| Samsung RAM M3 78T5663QZ3-CF7 2048MB DIMM DDR2 1639MT/s | 1 | 1.96% |
| Patriot RAM PSD34G13332 4096MB DIMM DDR3 1333MT/s | 1 | 1.96% |
| Micron RAM 8JTF25664AZ-1G4M1 2048MB DIMM DDR3 1333MT/s | 1 | 1.96% |
| Micron RAM 16JTF51264AZ-1G6M1 4096MB DIMM DDR3 1600MT/s | 1 | 1.96% |
| Kingston RAM KP382H-ELC 4096MB DIMM DDR3 1333MT/s | 1 | 1.96% |
| Kingston RAM KHX1600C10D3/4G 4096MB DIMM DDR3 1866MT/s | 1 | 1.96% |
| Kingston RAM KCM633-ELC 1024MB DIMM DDR2 2048MT/s | 1 | 1.96% |
| Kingston RAM 99U5595-002.A00LF 2048MB DIMM DDR3 1400MT/s | 1 | 1.96% |
| Kingston RAM 99U5584-001.A00LF 4096MB DIMM DDR3 1333MT/s | 1 | 1.96% |
| Kingston RAM 99U5474-026.A00LF 4096MB DIMM DDR3 1333MT/s | 1 | 1.96% |
| Kingston RAM 99U5429-007.A00LF 2048MB DIMM DDR2 800MT/s | 1 | 1.96% |
| Kingston RAM 9905702-012.A00G 8192MB DIMM DDR4 2133MT/s | 1 | 1.96% |
| Kingston RAM 9905471-001.A01LF 2GB DIMM DDR3 1600MT/s | 1 | 1.96% |
| Kingmax RAM FLGF65F-D8KQB 4096MB DIMM DDR3 1600MT/s | 1 | 1.96% |
| Intersil RAM NT2GC64B88B0NF-CG 2048MB DIMM DDR3 1067MT/s | 1 | 1.96% |
| Crucial RAM CT8G4DFS824A.M8FD 8192MB DIMM DDR4 2400MT/s | 1 | 1.96% |
| Crucial RAM BL8G32C16U4B.M8FE 8GB DIMM DDR4 3600MT/s | 1 | 1.96% |
| Corsair RAM VS2GB1333D3 2048MB DIMM DDR3 1333MT/s | 1 | 1.96% |
| Corsair RAM CMV8GX4M1A2400C16 8192MB DIMM DDR4 2400MT/s | 1 | 1.96% |
| Corsair RAM CMK16GX4M2D3000C16 8192MB DIMM DDR4 3200MT/s | 1 | 1.96% |
Memory Kind
Memory module kinds


| Kind | Desktops | Percent |
|---|---|---|
| DDR3 | 17 | 43.59% |
| DDR4 | 9 | 23.08% |
| Unknown | 7 | 17.95% |
| SDRAM | 4 | 10.26% |
| DDR2 | 2 | 5.13% |
Memory Form Factor
Physical design of the memory module


| Name | Desktops | Percent |
|---|---|---|
| DIMM | 38 | 100% |
Memory Size
Memory module size


| Size | Desktops | Percent |
|---|---|---|
| 4096 | 16 | 34.78% |
| 2048 | 14 | 30.43% |
| 8192 | 12 | 26.09% |
| 1024 | 4 | 8.7% |
Memory Speed
Memory module speed


| Speed | Desktops | Percent |
|---|---|---|
| 1333 | 9 | 19.57% |
| 1600 | 8 | 17.39% |
| 2400 | 5 | 10.87% |
| 800 | 4 | 8.7% |
| 400 | 3 | 6.52% |
| 3533 | 2 | 4.35% |
| 2133 | 2 | 4.35% |
| 1866 | 2 | 4.35% |
| Unknown | 2 | 4.35% |
| 3600 | 1 | 2.17% |
| 3200 | 1 | 2.17% |
| 2048 | 1 | 2.17% |
| 2000 | 1 | 2.17% |
| 1867 | 1 | 2.17% |
| 1639 | 1 | 2.17% |
| 1400 | 1 | 2.17% |
| 1067 | 1 | 2.17% |
| 667 | 1 | 2.17% |
Printers & scanners
Printer Vendor
Printer device vendors


| Vendor | Desktops | Percent |
|---|---|---|
| Hewlett-Packard | 6 | 85.71% |
| QinHeng Electronics | 1 | 14.29% |
Printer Model
Printer device models


| Model | Desktops | Percent |
|---|---|---|
| HP DeskJet 2600 series | 3 | 42.86% |
| QinHeng CH340S | 1 | 14.29% |
| HP LaserJet 1020 | 1 | 14.29% |
| HP DeskJet 959c | 1 | 14.29% |
| HP Deskjet 1050 J410 | 1 | 14.29% |
Scanner Vendor
Scanner device vendors
Zero info for selected period =(
Scanner Model
Scanner device models
Zero info for selected period =(
Camera
Camera Vendor
Camera device vendors


| Vendor | Desktops | Percent |
|---|---|---|
| Microdia | 5 | 71.43% |
| KYE Systems (Mouse Systems) | 1 | 14.29% |
| Cubeternet | 1 | 14.29% |
Camera Model
Camera device models


| Model | Desktops | Percent |
|---|---|---|
| Microdia Camera | 5 | 71.43% |
| KYE Systems (Mouse Systems) iSlim 321R | 1 | 14.29% |
| Cubeternet USB2.0 Camera | 1 | 14.29% |
Security
Fingerprint Vendor
Fingerprint sensor vendors
Zero info for selected period =(
Fingerprint Model
Fingerprint sensor models
Zero info for selected period =(
Chipcard Vendor
Chipcard module vendors
Zero info for selected period =(
Chipcard Model
Chipcard module models
Zero info for selected period =(
Unsupported
Unsupported Devices
Total unsupported devices on board

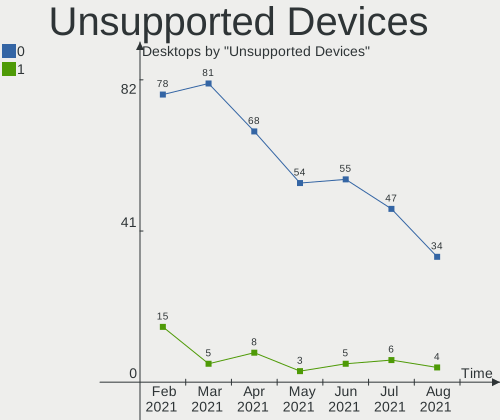
| Total | Desktops | Percent |
|---|---|---|
| 0 | 34 | 89.47% |
| 1 | 4 | 10.53% |
Unsupported Device Types
Types of unsupported devices


| Type | Desktops | Percent |
|---|---|---|
| Net/wireless | 3 | 75% |
| Graphics card | 1 | 25% |