Linux Hardware Trends
A project to identify most popular hardware characteristics and track their change over time based on data collected by Linux users at https://Linux-Hardware.org.
Anyone can contribute to the study by uploading probes of their computers by the hw-probe tool:
sudo -E hw-probe -all -uploadThis is a report for all computer types. See also reports for desktops and notebooks.
Full-feature report is available here: https://linux-hardware.org/?view=trends
Distribution-specific reports: Ubuntu, ROSA, Mint, Pop!_OS, Fedora, BlackPanther, Arch, Manjaro, Debian, Endless, Zorin, Gentoo, Clear Linux, openSUSE, KDE neon, Xubuntu, Kubuntu, ArcoLinux, OpenMandriva.
Period: Apr, 2021.
Contents
- OS
- OS Family
- Kernel
- Kernel Family
- Kernel Major Ver.
- Arch
- DE
- Display Server
- Display Manager
- OS Lang
- Boot Mode
- Filesystem
- Part. scheme
- Dual Boot with Linux/BSD
- Dual Boot (Win)
- Country
- City
- Vendor
- Model
- Model Family
- MFG Year
- Form Factor
- Secure Boot
- Coreboot
- RAM Size
- RAM Used
- Has CD-ROM
- Total Drives
- Has Ethernet
- Has WiFi
- Has Bluetooth
- Drive Vendor
- Drive Model
- HDD Vendor
- SSD Vendor
- Drive Kind
- Drive Connector
- Drive Size
- Space Total
- Space Used
- Malfunc. Drives
- Malfunc. Drive Vendor
- Malfunc. HDD Vendor
- Malfunc. Drive Kind
- Failed Drives
- Failed Drive Vendor
- Drive Status
- Storage Vendor
- Storage Model
- Storage Kind
- CPU Vendor
- CPU Model
- CPU Model Family
- CPU Cores
- CPU Sockets
- CPU Threads
- CPU Op-Modes
- CPU Microcode
- CPU Microarch
- GPU Vendor
- GPU Model
- GPU Combo
- GPU Driver
- GPU Memory
- Monitor Vendor
- Monitor Model
- Monitor Resolution
- Monitor Diagonal
- Monitor Width
- Aspect Ratio
- Monitor Area
- Pixel Density
- Multiple Monitors
- Net Controller Vendor
- Net Controller Model
- Wireless Vendor
- Wireless Model
- Ethernet Vendor
- Ethernet Model
- Net Controller Kind
- Used Controller
- NICs
- IPv6
- Memory Vendor
- Memory Model
- Memory Kind
- Memory Form Factor
- Memory Size
- Memory Speed
- Sound Vendor
- Sound Model
- Camera Vendor
- Camera Model
- Fingerprint Vendor
- Fingerprint Model
- Chipcard Vendor
- Chipcard Model
- Printer Vendor
- Printer Model
- Scanner Vendor
- Scanner Model
- Bluetooth Vendor
- Bluetooth Model
- Unsupported Devices
- Unsupported Device Types
OS
Installed operating systems


| Name | Computers | Percent |
|---|---|---|
| Ubuntu 20.04 | 995 | 20.13% |
| OpenMandriva 4.2 | 373 | 7.55% |
| Mint 20.1 | 364 | 7.36% |
| Ubuntu 20.10 | 263 | 5.32% |
| Pop!_OS 20.10 | 216 | 4.37% |
| Fedora 33 | 190 | 3.84% |
| KDE neon 20.04 | 166 | 3.36% |
| Fedora 34 | 156 | 3.16% |
| ROSA R11.1 | 153 | 3.1% |
| BlackPanther 18.1 | 152 | 3.08% |
| Ubuntu 18.04 | 127 | 2.57% |
| Arch | 97 | 1.96% |
| Debian 10 | 92 | 1.86% |
| Manjaro | 87 | 1.76% |
| Xubuntu 20.04 | 83 | 1.68% |
| Ubuntu 21.04 | 81 | 1.64% |
| Kubuntu 20.04 | 66 | 1.34% |
| Mint 19.3 | 63 | 1.27% |
| Zorin 15 | 54 | 1.09% |
| Mint 20 | 54 | 1.09% |
| Arch Rolling | 50 | 1.01% |
| ArcoLinux Rolling | 48 | 0.97% |
| Endless 3.9.3 | 45 | 0.91% |
| Pop!_OS 20.04 | 43 | 0.87% |
| Kali 2021.1 | 36 | 0.73% |
| Debian | 36 | 0.73% |
| Manjaro 21.0.2 | 34 | 0.69% |
| Manjaro 21.0.1 | 33 | 0.67% |
| Manjaro 21.0 | 33 | 0.67% |
| Debian Testing | 32 | 0.65% |
| LMDE 4 | 28 | 0.57% |
| Gentoo | 27 | 0.55% |
| Kubuntu 20.10 | 23 | 0.47% |
| Xubuntu 18.04 | 22 | 0.45% |
| ROSA R11 | 21 | 0.42% |
| Elementary 5.1.7 | 18 | 0.36% |
| Lubuntu 20.04 | 17 | 0.34% |
| openSUSE Leap-15.2 | 15 | 0.3% |
| Fedora 32 | 15 | 0.3% |
| Ubuntu MATE 20.04 | 14 | 0.28% |
| ROSA R12 | 14 | 0.28% |
| Mint 19.1 | 14 | 0.28% |
| Xubuntu 20.10 | 12 | 0.24% |
| EndeavourOS Rolling | 12 | 0.24% |
| Debian 11 | 12 | 0.24% |
| CentOS 8 | 12 | 0.24% |
| Mageia 8 | 11 | 0.22% |
| Gentoo 2.7 | 11 | 0.22% |
| Endless 3.9.4 | 11 | 0.22% |
| Zorin 16 | 10 | 0.2% |
| Manjaro 21.0.3 | 10 | 0.2% |
| RHEL 8.3 | 9 | 0.18% |
| EndeavourOS | 9 | 0.18% |
| Ubuntu Budgie 20.04 | 8 | 0.16% |
| Peppermint 10 | 8 | 0.16% |
| Kubuntu 21.04 | 8 | 0.16% |
| Ubuntu MATE 20.10 | 7 | 0.14% |
| Raspbian 10 | 7 | 0.14% |
| Mint 19 | 7 | 0.14% |
| Mint 18.3 | 7 | 0.14% |
OS Family
OS without a version


| Name | Computers | Percent |
|---|---|---|
| Ubuntu | 1485 | 30.04% |
| Mint | 515 | 10.42% |
| OpenMandriva | 380 | 7.69% |
| Fedora | 366 | 7.4% |
| Pop!_OS | 261 | 5.28% |
| Manjaro | 199 | 4.03% |
| ROSA | 193 | 3.9% |
| Debian | 189 | 3.82% |
| KDE neon | 167 | 3.38% |
| BlackPanther | 156 | 3.16% |
| Arch | 147 | 2.97% |
| Xubuntu | 123 | 2.49% |
| Kubuntu | 106 | 2.14% |
| Endless | 69 | 1.4% |
| Zorin | 67 | 1.36% |
| ArcoLinux | 53 | 1.07% |
| openSUSE | 40 | 0.81% |
| Kali | 40 | 0.81% |
| Gentoo | 38 | 0.77% |
| Lubuntu | 34 | 0.69% |
| Ubuntu MATE | 31 | 0.63% |
| LMDE | 28 | 0.57% |
| EndeavourOS | 21 | 0.42% |
| Clear Linux | 19 | 0.38% |
| Elementary | 18 | 0.36% |
| Ubuntu Budgie | 17 | 0.34% |
| CentOS | 17 | 0.34% |
| MX | 12 | 0.24% |
| Mageia | 11 | 0.22% |
| Garuda | 11 | 0.22% |
| RHEL | 10 | 0.2% |
| Raspbian | 8 | 0.16% |
| Peppermint | 8 | 0.16% |
| Devuan | 8 | 0.16% |
| Solus | 6 | 0.12% |
| Artix | 6 | 0.12% |
| PCLinuxOS | 5 | 0.1% |
| ALT Linux | 5 | 0.1% |
| RELS | 4 | 0.08% |
| Red OS | 4 | 0.08% |
| Parrot | 4 | 0.08% |
| Deepin | 4 | 0.08% |
| ClearOS | 4 | 0.08% |
| Android | 4 | 0.08% |
| Void | 3 | 0.06% |
| RED | 3 | 0.06% |
| Reborn OS | 3 | 0.06% |
| GNOME OS | 3 | 0.06% |
| Scientific | 2 | 0.04% |
| PostmarketOS | 2 | 0.04% |
| Obarun | 2 | 0.04% |
| Manjaro-ARM | 2 | 0.04% |
| Kaisen | 2 | 0.04% |
| BlackArch | 2 | 0.04% |
| Xero | 1 | 0.02% |
| Sparky | 1 | 0.02% |
| Siduction | 1 | 0.02% |
| Regataos | 1 | 0.02% |
| Redcore | 1 | 0.02% |
| PureOS | 1 | 0.02% |
Kernel
Version of the Linux kernel


| Version | Computers | Percent |
|---|---|---|
| 5.8.0-48-generic | 480 | 9.71% |
| 5.8.0-50-generic | 404 | 8.17% |
| 5.4.0-70-generic | 404 | 8.17% |
| 5.10.14-desktop-1omv4002 | 362 | 7.32% |
| 5.4.0-72-generic | 350 | 7.08% |
| 5.11.0-7612-generic | 181 | 3.66% |
| 5.8.0-49-generic | 145 | 2.93% |
| 5.6.14-desktop-2bP | 98 | 1.98% |
| 5.4.0-71-generic | 93 | 1.88% |
| 5.11.11-200.fc33.x86_64 | 71 | 1.44% |
| 4.19.0-16-amd64 | 70 | 1.42% |
| 5.11.0-16-generic | 65 | 1.31% |
| 5.8.0-14-generic | 60 | 1.21% |
| 4.18.16-desktop-1bP | 54 | 1.09% |
| 5.4.32-generic-2rosa-x86_64 | 51 | 1.03% |
| 5.8.0-43-generic | 50 | 1.01% |
| 5.11.11-arch1-1 | 47 | 0.95% |
| 5.4.0-58-generic | 42 | 0.85% |
| 5.11.11-300.fc34.x86_64 | 39 | 0.79% |
| 5.11.0-7614-generic | 39 | 0.79% |
| 5.4.83-generic-2rosa-x86_64 | 38 | 0.77% |
| 5.11.14-200.fc33.x86_64 | 37 | 0.75% |
| 5.11.15-arch1-2 | 32 | 0.65% |
| 4.15.0-142-generic | 32 | 0.65% |
| 4.15.0-140-generic | 31 | 0.63% |
| 5.11.16-arch1-1 | 26 | 0.53% |
| 5.10.0-5-amd64 | 26 | 0.53% |
| 5.10.23-1-MANJARO | 25 | 0.51% |
| 4.15.0-desktop-122.124.1rosa-x86_64 | 25 | 0.51% |
| 5.11.12-300.fc34.x86_64 | 24 | 0.49% |
| 5.10.30-1-MANJARO | 24 | 0.49% |
| 5.10.0-2-amd64 | 24 | 0.49% |
| 5.8.0-7642-generic | 23 | 0.47% |
| 5.11.16-300.fc34.x86_64 | 23 | 0.47% |
| 5.9.16-1-MANJARO | 22 | 0.45% |
| 5.11.15-300.fc34.x86_64 | 20 | 0.4% |
| 5.11.10-1-MANJARO | 20 | 0.4% |
| 5.10.0-6-amd64 | 20 | 0.4% |
| 5.10.26-1-MANJARO | 19 | 0.38% |
| 4.15.0-desktop-45.1rosa-x86_64 | 19 | 0.38% |
| 5.8.0-45-generic | 18 | 0.36% |
| 5.4.0-26-generic | 18 | 0.36% |
| 5.11.12-arch1-1 | 18 | 0.36% |
| 5.4.0-66-generic | 17 | 0.34% |
| 5.4.0-42-generic | 17 | 0.34% |
| 5.11.0-13-generic | 17 | 0.34% |
| 5.12.0-1-MANJARO | 16 | 0.32% |
| 5.11.6-1-MANJARO | 16 | 0.32% |
| 5.8.0-25-generic | 15 | 0.3% |
| 5.11.15-200.fc33.x86_64 | 15 | 0.3% |
| 5.4.32-generic-2rosa-i586 | 14 | 0.28% |
| 5.11.14-1-MANJARO | 14 | 0.28% |
| 5.8.0-44-generic | 13 | 0.26% |
| 5.11.16-zen1-1-zen | 13 | 0.26% |
| 5.8.0-1021-raspi | 12 | 0.24% |
| 5.4.0-70-lowlatency | 12 | 0.24% |
| 5.4.0-65-generic | 12 | 0.24% |
| 5.11.3-300.fc34.x86_64 | 12 | 0.24% |
| 5.11.13-arch1-1 | 12 | 0.24% |
| 5.11.10-200.fc33.x86_64 | 12 | 0.24% |
Kernel Family
Linux kernel without a distro release


| Version | Computers | Percent |
|---|---|---|
| 5.8.0 | 1292 | 26.14% |
| 5.4.0 | 1042 | 21.08% |
| 5.10.14 | 362 | 7.32% |
| 5.11.0 | 338 | 6.84% |
| 5.11.11 | 209 | 4.23% |
| 4.15.0 | 165 | 3.34% |
| 5.10.0 | 135 | 2.73% |
| 4.19.0 | 103 | 2.08% |
| 5.6.14 | 99 | 2% |
| 5.11.16 | 95 | 1.92% |
| 5.11.15 | 84 | 1.7% |
| 5.11.12 | 84 | 1.7% |
| 5.11.14 | 83 | 1.68% |
| 5.4.32 | 65 | 1.31% |
| 5.11.10 | 54 | 1.09% |
| 4.18.16 | 54 | 1.09% |
| 5.4.83 | 45 | 0.91% |
| 5.12.0 | 43 | 0.87% |
| 5.11.13 | 43 | 0.87% |
| 5.10.30 | 30 | 0.61% |
| 5.10.27 | 30 | 0.61% |
| 5.11.6 | 28 | 0.57% |
| 5.10.23 | 27 | 0.55% |
| 4.18.0 | 25 | 0.51% |
| 5.9.16 | 23 | 0.47% |
| 5.10.26 | 23 | 0.47% |
| 5.3.0 | 19 | 0.38% |
| 5.0.0 | 18 | 0.36% |
| 5.3.18 | 15 | 0.3% |
| 5.10.19 | 15 | 0.3% |
| 3.10.0 | 13 | 0.26% |
| 5.8.15 | 12 | 0.24% |
| 5.11.3 | 12 | 0.24% |
| 5.10.32 | 12 | 0.24% |
| 5.10.28 | 11 | 0.22% |
| 5.10.17 | 10 | 0.2% |
| 5.6.0 | 8 | 0.16% |
| 5.4.97 | 7 | 0.14% |
| 5.11.8 | 7 | 0.14% |
| 5.10.29 | 7 | 0.14% |
| 5.4.106 | 6 | 0.12% |
| 5.4.105 | 6 | 0.12% |
| 5.10.31 | 6 | 0.12% |
| 5.10.25 | 6 | 0.12% |
| 4.9.0 | 6 | 0.12% |
| 5.9.0 | 5 | 0.1% |
| 5.10.18 | 5 | 0.1% |
| 4.9.20 | 5 | 0.1% |
| 5.4.108 | 4 | 0.08% |
| 5.11.9 | 4 | 0.08% |
| 5.11.2 | 4 | 0.08% |
| 5.10.11 | 4 | 0.08% |
| 5.9.1 | 3 | 0.06% |
| 5.7.0 | 3 | 0.06% |
| 5.4.111 | 3 | 0.06% |
| 5.4.101 | 3 | 0.06% |
| 5.11.7 | 3 | 0.06% |
| 5.10.33 | 3 | 0.06% |
| 5.10.24 | 3 | 0.06% |
| 5.10.22 | 3 | 0.06% |
Kernel Major Ver.
Linux kernel major version


| Version | Computers | Percent |
|---|---|---|
| 5.8 | 1312 | 26.54% |
| 5.4 | 1202 | 24.32% |
| 5.11 | 1050 | 21.24% |
| 5.10 | 701 | 14.18% |
| 4.15 | 166 | 3.36% |
| 5.6 | 113 | 2.29% |
| 4.19 | 110 | 2.23% |
| 4.18 | 80 | 1.62% |
| 5.12 | 43 | 0.87% |
| 5.9 | 35 | 0.71% |
| 5.3 | 34 | 0.69% |
| 4.9 | 23 | 0.47% |
| 5.0 | 19 | 0.38% |
| 3.10 | 14 | 0.28% |
| 5.7 | 7 | 0.14% |
| 4.4 | 7 | 0.14% |
| 5.5 | 3 | 0.06% |
| 4.16 | 3 | 0.06% |
| Unknown | 3 | 0.06% |
| 5.2 | 2 | 0.04% |
| 4.14 | 2 | 0.04% |
| 4.10 | 2 | 0.04% |
| 3.16 | 2 | 0.04% |
| 5.4.104 | 1 | 0.02% |
| 5 | 1 | 0.02% |
| 4.8 | 1 | 0.02% |
| 4.2 | 1 | 0.02% |
| 4.17 | 1 | 0.02% |
| 4.12 | 1 | 0.02% |
| 4.1 | 1 | 0.02% |
| 3.18 | 1 | 0.02% |
| 3.13 | 1 | 0.02% |
| 3.0 | 1 | 0.02% |
Arch
OS architecture (x86_64, i586, etc.)


| Name | Computers | Percent |
|---|---|---|
| x86_64 | 4738 | 95.85% |
| i686 | 132 | 2.67% |
| aarch64 | 55 | 1.11% |
| armv7l | 13 | 0.26% |
| armv8l | 2 | 0.04% |
| armv6l | 1 | 0.02% |
| armv5tel | 1 | 0.02% |
| Unknown | 1 | 0.02% |
DE
Desktop Environment


| Name | Computers | Percent |
|---|---|---|
| GNOME | 2162 | 43.74% |
| KDE5 | 846 | 17.12% |
| X-Cinnamon | 413 | 8.36% |
| XFCE | 360 | 7.28% |
| KDE | 320 | 6.47% |
| Unknown | 317 | 6.41% |
| MATE | 133 | 2.69% |
| KDE4 | 121 | 2.45% |
| Cinnamon | 45 | 0.91% |
| LXQt | 43 | 0.87% |
| i3 | 30 | 0.61% |
| Budgie | 29 | 0.59% |
| LXDE | 25 | 0.51% |
| Unity | 18 | 0.36% |
| Pantheon | 14 | 0.28% |
| Deepin | 11 | 0.22% |
| GNOME Flashback | 10 | 0.2% |
| awesome | 8 | 0.16% |
| dwm | 6 | 0.12% |
| bspwm | 6 | 0.12% |
| GNOME Classic | 5 | 0.1% |
| Openbox | 3 | 0.06% |
| xmonad | 2 | 0.04% |
| lightdm-xsession | 2 | 0.04% |
| i3-with-shmlog | 2 | 0.04% |
| GNUstep | 2 | 0.04% |
| Enlightenment | 2 | 0.04% |
| UKUI | 1 | 0.02% |
| sway | 1 | 0.02% |
| qtile | 1 | 0.02% |
| ICEWM | 1 | 0.02% |
| herbstluftwm | 1 | 0.02% |
| fluxbox | 1 | 0.02% |
| default | 1 | 0.02% |
| /usr/bin/startxfce4 | 1 | 0.02% |
Display Server
X11 or Wayland


| Name | Computers | Percent |
|---|---|---|
| X11 | 4238 | 85.74% |
| Wayland | 446 | 9.02% |
| Unknown | 166 | 3.36% |
| Tty | 92 | 1.86% |
| Unspecified | 1 | 0.02% |
Display Manager
SDDM, LightDM, etc.


| Name | Computers | Percent |
|---|---|---|
| Unknown | 2857 | 57.8% |
| SDDM | 880 | 17.8% |
| GDM | 588 | 11.9% |
| TDM | 378 | 7.65% |
| KDM | 123 | 2.49% |
| LightDM | 86 | 1.74% |
| XDM | 13 | 0.26% |
| SLiM | 6 | 0.12% |
| Ly | 4 | 0.08% |
| LXDM | 3 | 0.06% |
| GDM3 | 3 | 0.06% |
| MDM | 2 | 0.04% |
OS Lang
Language


| Lang | Computers | Percent |
|---|---|---|
| en_US | 1826 | 36.94% |
| de_DE | 407 | 8.23% |
| ru_RU | 372 | 7.53% |
| pt_BR | 264 | 5.34% |
| fr_FR | 259 | 5.24% |
| Unknown | 246 | 4.98% |
| en_GB | 232 | 4.69% |
| es_ES | 132 | 2.67% |
| it_IT | 120 | 2.43% |
| pl_PL | 108 | 2.18% |
| en_CA | 93 | 1.88% |
| en_AU | 80 | 1.62% |
| C | 77 | 1.56% |
| en_IN | 65 | 1.31% |
| nl_NL | 34 | 0.69% |
| sv_SE | 31 | 0.63% |
| es_MX | 31 | 0.63% |
| cs_CZ | 30 | 0.61% |
| hu_HU | 29 | 0.59% |
| es_AR | 29 | 0.59% |
| pt_PT | 28 | 0.57% |
| ru_UA | 21 | 0.42% |
| es_CL | 21 | 0.42% |
| de_AT | 20 | 0.4% |
| ja_JP | 19 | 0.38% |
| en_ZA | 18 | 0.36% |
| de_CH | 18 | 0.36% |
| tr_TR | 17 | 0.34% |
| fi_FI | 17 | 0.34% |
| zh_CN | 16 | 0.32% |
| nl_BE | 16 | 0.32% |
| ro_RO | 14 | 0.28% |
| fr_CA | 12 | 0.24% |
| fr_BE | 12 | 0.24% |
| uk_UA | 11 | 0.22% |
| en_IE | 11 | 0.22% |
| sk_SK | 10 | 0.2% |
| es_UY | 10 | 0.2% |
| ko_KR | 9 | 0.18% |
| es_CO | 9 | 0.18% |
| en_IL | 9 | 0.18% |
| el_GR | 9 | 0.18% |
| ca_ES | 9 | 0.18% |
| hr_HR | 7 | 0.14% |
| fr_CH | 7 | 0.14% |
| en_NZ | 7 | 0.14% |
| da_DK | 7 | 0.14% |
| id_ID | 6 | 0.12% |
| C.UTF8 | 6 | 0.12% |
| bg_BG | 6 | 0.12% |
| sl_SI | 5 | 0.1% |
| nb_NO | 5 | 0.1% |
| es_PE | 5 | 0.1% |
| en_PH | 5 | 0.1% |
| zh_TW | 4 | 0.08% |
| es_VE | 4 | 0.08% |
| es_CR | 4 | 0.08% |
| en_DK | 4 | 0.08% |
| es_SV | 3 | 0.06% |
| es_EC | 3 | 0.06% |
Boot Mode
EFI or BIOS


| Mode | Computers | Percent |
|---|---|---|
| BIOS | 2731 | 55.25% |
| EFI | 2212 | 44.75% |
Filesystem
Type of filesystem


| Type | Computers | Percent |
|---|---|---|
| Ext4 | 3871 | 78.31% |
| Overlay | 533 | 10.78% |
| Btrfs | 374 | 7.57% |
| Xfs | 82 | 1.66% |
| Zfs | 34 | 0.69% |
| F2fs | 15 | 0.3% |
| Ext3 | 13 | 0.26% |
| Unknown | 8 | 0.16% |
| Ext2 | 5 | 0.1% |
| Tmpfs | 2 | 0.04% |
| Reiserfs | 2 | 0.04% |
| Aufs | 2 | 0.04% |
| XXXXXXX | 1 | 0.02% |
| Fuse.fuse-overlayfs | 1 | 0.02% |
Part. scheme
Scheme of partitioning


| Type | Computers | Percent |
|---|---|---|
| Unknown | 2726 | 55.15% |
| GPT | 1463 | 29.6% |
| MBR | 754 | 15.25% |
Dual Boot with Linux/BSD
Hosting more than one Linux/BSD


| Dual boot | Computers | Percent |
|---|---|---|
| No | 4177 | 84.5% |
| Yes | 766 | 15.5% |
Dual Boot (Win)
Hosting Linux and Windows


| Dual boot | Computers | Percent |
|---|---|---|
| No | 3477 | 70.34% |
| Yes | 1466 | 29.66% |
Country
Geographic location (country)


| Country | Computers | Percent |
|---|---|---|
| USA | 750 | 15.17% |
| Germany | 535 | 10.82% |
| Russia | 450 | 9.1% |
| Brazil | 354 | 7.16% |
| France | 287 | 5.81% |
| UK | 186 | 3.76% |
| Italy | 171 | 3.46% |
| Spain | 170 | 3.44% |
| Poland | 159 | 3.22% |
| Hungary | 152 | 3.08% |
| Canada | 135 | 2.73% |
| Netherlands | 108 | 2.18% |
| India | 101 | 2.04% |
| Australia | 91 | 1.84% |
| Ukraine | 79 | 1.6% |
| Sweden | 62 | 1.25% |
| Czechia | 54 | 1.09% |
| Belgium | 54 | 1.09% |
| Switzerland | 53 | 1.07% |
| Mexico | 51 | 1.03% |
| Turkey | 47 | 0.95% |
| Austria | 47 | 0.95% |
| Argentina | 44 | 0.89% |
| Romania | 39 | 0.79% |
| Portugal | 36 | 0.73% |
| Chile | 35 | 0.71% |
| Indonesia | 32 | 0.65% |
| Finland | 32 | 0.65% |
| Japan | 31 | 0.63% |
| Greece | 27 | 0.55% |
| Norway | 25 | 0.51% |
| China | 25 | 0.51% |
| Bulgaria | 25 | 0.51% |
| Denmark | 24 | 0.49% |
| South Africa | 23 | 0.47% |
| Slovakia | 22 | 0.45% |
| Iran | 21 | 0.42% |
| New Zealand | 19 | 0.38% |
| Colombia | 19 | 0.38% |
| Belarus | 18 | 0.36% |
| Vietnam | 17 | 0.34% |
| Israel | 15 | 0.3% |
| Croatia | 15 | 0.3% |
| Egypt | 14 | 0.28% |
| Uruguay | 13 | 0.26% |
| South Korea | 13 | 0.26% |
| Slovenia | 12 | 0.24% |
| Philippines | 11 | 0.22% |
| Ireland | 11 | 0.22% |
| Serbia | 10 | 0.2% |
| Algeria | 10 | 0.2% |
| Peru | 9 | 0.18% |
| Pakistan | 9 | 0.18% |
| Lithuania | 9 | 0.18% |
| Malaysia | 8 | 0.16% |
| Costa Rica | 8 | 0.16% |
| Estonia | 7 | 0.14% |
| Ecuador | 7 | 0.14% |
| Taiwan | 6 | 0.12% |
| Singapore | 6 | 0.12% |
City
Geographic location (city)


| City | Computers | Percent |
|---|---|---|
| Moscow | 101 | 2.04% |
| Budapest | 47 | 0.95% |
| Berlin | 46 | 0.93% |
| St Petersburg | 45 | 0.91% |
| São Paulo | 42 | 0.85% |
| Warsaw | 38 | 0.77% |
| Hamburg | 31 | 0.63% |
| Voronezh | 26 | 0.53% |
| Vienna | 26 | 0.53% |
| Milan | 26 | 0.53% |
| Rome | 25 | 0.51% |
| Paris | 25 | 0.51% |
| London | 24 | 0.49% |
| Kyiv | 24 | 0.49% |
| Prague | 22 | 0.45% |
| Madrid | 22 | 0.45% |
| Barcelona | 21 | 0.42% |
| Montreal | 19 | 0.38% |
| Amsterdam | 19 | 0.38% |
| Rio de Janeiro | 18 | 0.36% |
| Cologne | 18 | 0.36% |
| Istanbul | 17 | 0.34% |
| Athens | 17 | 0.34% |
| Tehran | 16 | 0.32% |
| Sydney | 16 | 0.32% |
| Munich | 16 | 0.32% |
| Zurich | 14 | 0.28% |
| Wroclaw | 14 | 0.28% |
| Toronto | 14 | 0.28% |
| Perm | 14 | 0.28% |
| Krasnodar | 14 | 0.28% |
| Krakow | 14 | 0.28% |
| Frankfurt am Main | 14 | 0.28% |
| Brisbane | 14 | 0.28% |
| Belo Horizonte | 14 | 0.28% |
| Sofia | 13 | 0.26% |
| Yekaterinburg | 12 | 0.24% |
| The Hague | 12 | 0.24% |
| Santiago | 12 | 0.24% |
| Rostov-on-Don | 12 | 0.24% |
| Chipping Norton | 12 | 0.24% |
| Zagreb | 11 | 0.22% |
| New York | 11 | 0.22% |
| Montevideo | 11 | 0.22% |
| Minsk | 11 | 0.22% |
| Edmonton | 11 | 0.22% |
| Curitiba | 11 | 0.22% |
| Brasília | 11 | 0.22% |
| Lisbon | 10 | 0.2% |
| Leipzig | 10 | 0.2% |
| Bucharest | 10 | 0.2% |
| Ankara | 10 | 0.2% |
| Wooster | 9 | 0.18% |
| Tel Aviv | 9 | 0.18% |
| Saratov | 9 | 0.18% |
| Novosibirsk | 9 | 0.18% |
| Miami | 9 | 0.18% |
| Los Angeles | 9 | 0.18% |
| Kazan’ | 9 | 0.18% |
| Ho Chi Minh City | 9 | 0.18% |
Vendor
Motherboard manufacturer


| Name | Computers | Percent |
|---|---|---|
| ASUSTek Computer | 801 | 16.2% |
| Lenovo | 684 | 13.84% |
| Hewlett-Packard | 665 | 13.45% |
| Dell | 633 | 12.81% |
| Gigabyte Technology | 374 | 7.57% |
| Acer | 298 | 6.03% |
| MSI | 285 | 5.77% |
| ASRock | 216 | 4.37% |
| Apple | 96 | 1.94% |
| Intel | 86 | 1.74% |
| Toshiba | 81 | 1.64% |
| Unknown | 68 | 1.38% |
| Samsung Electronics | 60 | 1.21% |
| Fujitsu | 35 | 0.71% |
| Sony | 33 | 0.67% |
| Pegatron | 30 | 0.61% |
| Medion | 30 | 0.61% |
| Raspberry Pi Foundation | 27 | 0.55% |
| Packard Bell | 22 | 0.45% |
| Notebook | 22 | 0.45% |
| Positivo | 21 | 0.42% |
| HUAWEI | 19 | 0.38% |
| ECS | 18 | 0.36% |
| Fujitsu Siemens | 17 | 0.34% |
| Biostar | 16 | 0.32% |
| System76 | 15 | 0.3% |
| Foxconn | 15 | 0.3% |
| Supermicro | 11 | 0.22% |
| Alienware | 11 | 0.22% |
| TUXEDO | 10 | 0.2% |
| Semp Toshiba | 10 | 0.2% |
| LG Electronics | 10 | 0.2% |
| 10 | 0.2% | |
| Microsoft | 8 | 0.16% |
| Panasonic | 7 | 0.14% |
| Huanan | 7 | 0.14% |
| Gateway | 7 | 0.14% |
| Chuwi | 7 | 0.14% |
| IBM | 6 | 0.12% |
| eMachines | 6 | 0.12% |
| AMI | 6 | 0.12% |
| TrekStor | 5 | 0.1% |
| Pine Microsystems | 5 | 0.1% |
| NEC Computers | 4 | 0.08% |
| Jumper | 4 | 0.08% |
| ZOTAC | 3 | 0.06% |
| Timi | 3 | 0.06% |
| SLIMBOOK | 3 | 0.06% |
| Shuttle | 3 | 0.06% |
| Schenker | 3 | 0.06% |
| Quanta | 3 | 0.06% |
| Nvidia | 3 | 0.06% |
| Itautec | 3 | 0.06% |
| Clevo | 3 | 0.06% |
| BESSTAR Tech | 3 | 0.06% |
| Wortmann AG | 2 | 0.04% |
| whyopencomputing | 2 | 0.04% |
| Teclast | 2 | 0.04% |
| Sun Microsystems | 2 | 0.04% |
| Standard | 2 | 0.04% |
Model
Motherboard model


| Name | Computers | Percent |
|---|---|---|
| Unknown | 83 | 1.68% |
| ASUS All Series | 44 | 0.89% |
| HP Notebook | 17 | 0.34% |
| Gigabyte B450M DS3H | 14 | 0.28% |
| ASUS PRIME A320M-K | 14 | 0.28% |
| HP Pavilion g6 | 13 | 0.26% |
| Dell OptiPlex 7010 | 12 | 0.24% |
| HP Pavilion dv7 | 11 | 0.22% |
| ASUS ROG STRIX B450-F GAMING | 11 | 0.22% |
| HP Pavilion dv6 | 10 | 0.2% |
| Gigabyte A320M-S2H | 10 | 0.2% |
| ASUS TUF GAMING X570-PLUS | 10 | 0.2% |
| Dell Latitude E6420 | 9 | 0.18% |
| MSI MS-7C91 | 8 | 0.16% |
| MSI MS-7C37 | 8 | 0.16% |
| MSI MS-7C02 | 8 | 0.16% |
| HP Compaq Pro 6300 SFF | 8 | 0.16% |
| Dell XPS 15 7590 | 8 | 0.16% |
| Dell OptiPlex 9020 | 8 | 0.16% |
| Dell Latitude E7440 | 8 | 0.16% |
| Dell Inspiron 15-3567 | 8 | 0.16% |
| Apple MacBookPro8,1 | 8 | 0.16% |
| RPi Raspberry Pi 4 Model B Rev 1.4 | 7 | 0.14% |
| MSI MS-7A34 | 7 | 0.14% |
| MSI MS-7817 | 7 | 0.14% |
| MSI MS-7693 | 7 | 0.14% |
| HP Pavilion Gaming Laptop 15-ec1xxx | 7 | 0.14% |
| HP Pavilion 15 | 7 | 0.14% |
| HP EliteBook 8470p | 7 | 0.14% |
| HP EliteBook 8460p | 7 | 0.14% |
| HP 15 | 7 | 0.14% |
| Gigabyte GA-78LMT-USB3 6.0 | 7 | 0.14% |
| Dell XPS 15 9570 | 7 | 0.14% |
| Dell XPS 15 9500 | 7 | 0.14% |
| Dell XPS 13 7390 | 7 | 0.14% |
| Dell OptiPlex 790 | 7 | 0.14% |
| Dell OptiPlex 755 | 7 | 0.14% |
| Dell OptiPlex 390 | 7 | 0.14% |
| ASRock A320M-HDV R4.0 | 7 | 0.14% |
| Samsung 300E4A/300E5A/300E7A/3430EA/3530EA | 6 | 0.12% |
| MSI MS-7B89 | 6 | 0.12% |
| MSI MS-7A38 | 6 | 0.12% |
| HP Pavilion Notebook | 6 | 0.12% |
| HP Laptop 15-da0xxx | 6 | 0.12% |
| HP EliteBook 8440p | 6 | 0.12% |
| HP EliteBook 840 G2 | 6 | 0.12% |
| HP 250 G6 Notebook PC | 6 | 0.12% |
| Dell XPS 13 9360 | 6 | 0.12% |
| Dell OptiPlex 990 | 6 | 0.12% |
| Dell OptiPlex 780 | 6 | 0.12% |
| Dell OptiPlex 760 | 6 | 0.12% |
| Dell OptiPlex 3020 | 6 | 0.12% |
| Dell Latitude E6540 | 6 | 0.12% |
| Dell Latitude 5480 | 6 | 0.12% |
| Dell Inspiron N5110 | 6 | 0.12% |
| Dell Inspiron 5570 | 6 | 0.12% |
| ASUS ROG STRIX X570-E GAMING | 6 | 0.12% |
| ASUS PRIME B450M-A | 6 | 0.12% |
| ASRock AB350 Pro4 | 6 | 0.12% |
| System76 Lemur Pro | 5 | 0.1% |
Model Family
Motherboard model prefix


| Name | Computers | Percent |
|---|---|---|
| Lenovo ThinkPad | 300 | 6.07% |
| Acer Aspire | 207 | 4.19% |
| Dell Inspiron | 168 | 3.4% |
| Dell Latitude | 148 | 2.99% |
| Lenovo IdeaPad | 141 | 2.85% |
| HP Pavilion | 126 | 2.55% |
| Dell OptiPlex | 104 | 2.1% |
| ASUS PRIME | 96 | 1.94% |
| HP EliteBook | 95 | 1.92% |
| Unknown | 83 | 1.68% |
| Dell XPS | 82 | 1.66% |
| ASUS ROG | 73 | 1.48% |
| HP Compaq | 70 | 1.42% |
| Toshiba Satellite | 69 | 1.4% |
| HP ProBook | 59 | 1.19% |
| HP Laptop | 55 | 1.11% |
| Dell Precision | 51 | 1.03% |
| Lenovo ThinkCentre | 46 | 0.93% |
| ASUS VivoBook | 46 | 0.93% |
| ASUS TUF | 46 | 0.93% |
| ASUS All | 44 | 0.89% |
| Dell Vostro | 38 | 0.77% |
| Lenovo Yoga | 35 | 0.71% |
| HP ENVY | 31 | 0.63% |
| RPi Raspberry | 27 | 0.55% |
| Acer Nitro | 24 | 0.49% |
| Gigabyte B450M | 23 | 0.47% |
| ASUS M5A78L-M | 21 | 0.42% |
| Lenovo Legion | 17 | 0.34% |
| HP Notebook | 17 | 0.34% |
| Gigabyte B450 | 16 | 0.32% |
| Fujitsu ESPRIMO | 16 | 0.32% |
| Packard Bell EasyNote | 15 | 0.3% |
| Lenovo IdeaCentre | 15 | 0.3% |
| Fujitsu LIFEBOOK | 15 | 0.3% |
| HP Spectre | 14 | 0.28% |
| HP 250 | 14 | 0.28% |
| Gigabyte X570 | 14 | 0.28% |
| ASUS P8H61-M | 14 | 0.28% |
| Acer Swift | 14 | 0.28% |
| HP ProDesk | 13 | 0.26% |
| Gigabyte A320M-S2H | 13 | 0.26% |
| ASUS ZenBook | 13 | 0.26% |
| Gigabyte GA-78LMT-USB3 | 12 | 0.24% |
| Gigabyte B550 | 12 | 0.24% |
| HP ZBook | 11 | 0.22% |
| HP 255 | 11 | 0.22% |
| ASRock B450M | 11 | 0.22% |
| ASRock B450 | 11 | 0.22% |
| HP ProLiant | 10 | 0.2% |
| HP OMEN | 10 | 0.2% |
| Dell G3 | 10 | 0.2% |
| ASUS P5Q | 10 | 0.2% |
| ASUS ASUS | 10 | 0.2% |
| Apple MacBookPro8 | 10 | 0.2% |
| Acer Extensa | 10 | 0.2% |
| HP EliteDesk | 9 | 0.18% |
| HP 15 | 9 | 0.18% |
| Gigabyte Z390 | 9 | 0.18% |
| Fujitsu Siemens ESPRIMO | 9 | 0.18% |
MFG Year
Motherboard manufacture year


| Year | Computers | Percent |
|---|---|---|
| 2020 | 1023 | 20.7% |
| 2019 | 576 | 11.65% |
| 2018 | 416 | 8.42% |
| 2013 | 348 | 7.04% |
| 2012 | 304 | 6.15% |
| 2014 | 281 | 5.68% |
| 2011 | 279 | 5.64% |
| 2021 | 275 | 5.56% |
| 2016 | 230 | 4.65% |
| 2015 | 226 | 4.57% |
| 2010 | 219 | 4.43% |
| 2017 | 204 | 4.13% |
| 2009 | 201 | 4.07% |
| 2008 | 144 | 2.91% |
| 2007 | 91 | 1.84% |
| Unknown | 73 | 1.48% |
| 2006 | 37 | 0.75% |
| 2005 | 10 | 0.2% |
| 2003 | 3 | 0.06% |
| 2004 | 2 | 0.04% |
| 2002 | 1 | 0.02% |
Form Factor
Physical design of the computer


| Name | Computers | Percent |
|---|---|---|
| Notebook | 2557 | 51.73% |
| Desktop | 2025 | 40.97% |
| Convertible | 120 | 2.43% |
| All in one | 72 | 1.46% |
| System on chip | 54 | 1.09% |
| Mini pc | 54 | 1.09% |
| Server | 30 | 0.61% |
| Tablet | 23 | 0.47% |
| Phone | 7 | 0.14% |
| Other | 1 | 0.02% |
Secure Boot
Enabled or disabled


| State | Computers | Percent |
|---|---|---|
| Disabled | 4637 | 93.81% |
| Enabled | 306 | 6.19% |
Coreboot
Have coreboot on board


| Used | Computers | Percent |
|---|---|---|
| No | 4922 | 99.58% |
| Yes | 21 | 0.42% |
RAM Size
Total RAM memory


| Size in GB | Computers | Percent |
|---|---|---|
| 4.01-8.0 | 1131 | 22.88% |
| 3.01-4.0 | 1032 | 20.88% |
| 16.01-24.0 | 918 | 18.57% |
| 8.01-16.0 | 900 | 18.21% |
| 32.01-64.0 | 426 | 8.62% |
| 1.01-2.0 | 220 | 4.45% |
| 64.01-256.0 | 114 | 2.31% |
| 2.01-3.0 | 76 | 1.54% |
| 24.01-32.0 | 69 | 1.4% |
| 0.51-1.0 | 45 | 0.91% |
| More than 256.0 | 6 | 0.12% |
| 0.01-0.5 | 5 | 0.1% |
| Unknown | 1 | 0.02% |
RAM Used
Used RAM memory


| Used GB | Computers | Percent |
|---|---|---|
| 1.01-2.0 | 1851 | 37.45% |
| 2.01-3.0 | 1123 | 22.72% |
| 4.01-8.0 | 658 | 13.31% |
| 3.01-4.0 | 539 | 10.9% |
| 0.51-1.0 | 454 | 9.18% |
| 8.01-16.0 | 154 | 3.12% |
| 0.01-0.5 | 117 | 2.37% |
| 16.01-24.0 | 26 | 0.53% |
| 32.01-64.0 | 9 | 0.18% |
| 24.01-32.0 | 5 | 0.1% |
| Unknown | 4 | 0.08% |
| 64.01-256.0 | 2 | 0.04% |
| More than 256.0 | 1 | 0.02% |
Has CD-ROM
Has CD-ROM on board


| Presented | Computers | Percent |
|---|---|---|
| No | 2845 | 57.56% |
| Yes | 2098 | 42.44% |
Total Drives
Number of drives on board


| Drives | Computers | Percent |
|---|---|---|
| 1 | 2868 | 58.02% |
| 2 | 1252 | 25.33% |
| 3 | 397 | 8.03% |
| 4 | 196 | 3.97% |
| 5 | 97 | 1.96% |
| 0 | 52 | 1.05% |
| 6 | 47 | 0.95% |
| 7 | 17 | 0.34% |
| 8 | 6 | 0.12% |
| 9 | 5 | 0.1% |
| 36 | 1 | 0.02% |
| 23 | 1 | 0.02% |
| 16 | 1 | 0.02% |
| 14 | 1 | 0.02% |
| 13 | 1 | 0.02% |
| 12 | 1 | 0.02% |
Has Ethernet
Has Ethernet on board


| Presented | Computers | Percent |
|---|---|---|
| Yes | 4399 | 88.99% |
| No | 544 | 11.01% |
Has WiFi
Has WiFi module


| Presented | Computers | Percent |
|---|---|---|
| Yes | 3602 | 72.87% |
| No | 1341 | 27.13% |
Has Bluetooth
Has Bluetooth module


| Presented | Computers | Percent |
|---|---|---|
| Yes | 2732 | 55.27% |
| No | 2211 | 44.73% |
Drive Vendor
Hard drive vendors


| Vendor | Computers | Drives | Percent |
|---|---|---|---|
| WDC | 1232 | 1537 | 17.28% |
| Seagate | 1114 | 1358 | 15.62% |
| Samsung Electronics | 1072 | 1365 | 15.03% |
| Toshiba | 492 | 526 | 6.9% |
| Kingston | 413 | 449 | 5.79% |
| SanDisk | 302 | 316 | 4.24% |
| Unknown | 300 | 339 | 4.21% |
| Hitachi | 255 | 270 | 3.58% |
| Crucial | 234 | 261 | 3.28% |
| Intel | 175 | 204 | 2.45% |
| SK Hynix | 157 | 163 | 2.2% |
| HGST | 124 | 128 | 1.74% |
| A-DATA Technology | 98 | 105 | 1.37% |
| Micron Technology | 75 | 81 | 1.05% |
| Phison | 64 | 79 | 0.9% |
| China | 52 | 54 | 0.73% |
| PNY | 49 | 53 | 0.69% |
| Apple | 47 | 54 | 0.66% |
| Maxtor | 40 | 43 | 0.56% |
| Fujitsu | 40 | 41 | 0.56% |
| SPCC | 39 | 41 | 0.55% |
| Transcend | 35 | 35 | 0.49% |
| GOODRAM | 33 | 34 | 0.46% |
| LITEON | 32 | 32 | 0.45% |
| Silicon Motion | 30 | 39 | 0.42% |
| OCZ | 29 | 33 | 0.41% |
| Patriot | 28 | 29 | 0.39% |
| XPG | 26 | 28 | 0.36% |
| KIOXIA | 26 | 26 | 0.36% |
| Corsair | 26 | 27 | 0.36% |
| JMicron | 23 | 24 | 0.32% |
| Micron/Crucial Technology | 21 | 23 | 0.29% |
| Apacer | 21 | 21 | 0.29% |
| Team | 19 | 20 | 0.27% |
| Intenso | 18 | 18 | 0.25% |
| Hewlett-Packard | 17 | 18 | 0.24% |
| ASMT | 17 | 22 | 0.24% |
| LITEONIT | 16 | 16 | 0.22% |
| KingSpec | 14 | 14 | 0.2% |
| PLEXTOR | 12 | 13 | 0.17% |
| Gigabyte Technology | 12 | 15 | 0.17% |
| Sabrent | 11 | 14 | 0.15% |
| Union Memory | 10 | 10 | 0.14% |
| KingDian | 10 | 10 | 0.14% |
| FORESEE | 9 | 9 | 0.13% |
| Union Memory (Shenzhen) | 8 | 8 | 0.11% |
| Smartbuy | 8 | 9 | 0.11% |
| Realtek Semiconductor | 8 | 8 | 0.11% |
| Lexar | 8 | 8 | 0.11% |
| LaCie | 8 | 8 | 0.11% |
| Phison Electronics | 6 | 7 | 0.08% |
| Lenovo | 6 | 6 | 0.08% |
| AMD | 6 | 6 | 0.08% |
| ADATA Technology | 6 | 6 | 0.08% |
| XrayDisk | 5 | 5 | 0.07% |
| Mushkin | 5 | 5 | 0.07% |
| DOGFISH | 5 | 5 | 0.07% |
| Vaseky | 4 | 4 | 0.06% |
| USB30 | 4 | 4 | 0.06% |
| PNY USB | 4 | 4 | 0.06% |
Drive Model
Hard drive models


| Model | Computers | Percent |
|---|---|---|
| Kingston SA400S37240G 240GB SSD | 97 | 1.22% |
| Samsung SSD 860 EVO 500GB | 72 | 0.91% |
| Seagate ST500DM002-1BD142 500GB | 69 | 0.87% |
| Seagate ST1000LM035-1RK172 1TB | 67 | 0.85% |
| Kingston SA400S37120G 120GB SSD | 64 | 0.81% |
| Samsung SSD 850 EVO 250GB | 58 | 0.73% |
| Samsung NVMe SSD Drive 500GB | 56 | 0.71% |
| Seagate ST1000DM010-2EP102 1TB | 54 | 0.68% |
| Seagate ST1000LM024 HN-M101MBB 1TB | 52 | 0.66% |
| Unknown MMC Card 32GB | 50 | 0.63% |
| WDC WD10EZEX-08WN4A0 1TB | 45 | 0.57% |
| Toshiba DT01ACA100 1TB | 45 | 0.57% |
| Samsung NVMe SSD Drive 512GB | 45 | 0.57% |
| Toshiba MQ01ABD100 1TB | 43 | 0.54% |
| Samsung SSD 850 EVO 500GB | 43 | 0.54% |
| Samsung SSD 860 EVO 1TB | 42 | 0.53% |
| Unknown MMC Card 64GB | 41 | 0.52% |
| Samsung NVMe SSD Drive 1TB | 37 | 0.47% |
| WDC WDS240G2G0A-00JH30 240GB SSD | 36 | 0.45% |
| Samsung SSD 860 EVO 250GB | 36 | 0.45% |
| Seagate ST500LT012-1DG142 500GB | 35 | 0.44% |
| Kingston SV300S37A120G 120GB SSD | 35 | 0.44% |
| Crucial CT240BX500SSD1 240GB | 34 | 0.43% |
| Toshiba MQ04ABF100 1TB | 33 | 0.42% |
| Samsung NVMe SSD Drive 256GB | 33 | 0.42% |
| Kingston SA400S37480G 480GB SSD | 33 | 0.42% |
| Toshiba MQ01ABF050 500GB | 32 | 0.4% |
| Seagate ST2000DM008-2FR102 2TB | 32 | 0.4% |
| Seagate ST1000DM003-1ER162 1TB | 27 | 0.34% |
| Seagate Expansion 4TB | 27 | 0.34% |
| Samsung NVMe SSD Drive 250GB | 27 | 0.34% |
| Intel NVMe SSD Drive 512GB | 27 | 0.34% |
| Crucial CT500MX500SSD1 500GB | 27 | 0.34% |
| Crucial CT1000MX500SSD1 1TB | 27 | 0.34% |
| Unknown SD/MMC/MS PRO 32GB | 26 | 0.33% |
| Seagate ST500LM012 HN-M500MBB 500GB | 26 | 0.33% |
| HGST HTS721010A9E630 1TB | 26 | 0.33% |
| WDC WDS500G2B0A-00SM50 500GB SSD | 25 | 0.32% |
| Seagate ST3500418AS 500GB | 25 | 0.32% |
| Samsung NVMe SSD Drive 1024GB | 25 | 0.32% |
| Unknown MMC Card 128GB | 24 | 0.3% |
| Seagate ST4000DM004-2CV104 4TB | 24 | 0.3% |
| Seagate ST1000DM003-1CH162 1TB | 24 | 0.3% |
| Sandisk NVMe SSD Drive 512GB | 24 | 0.3% |
| WDC WD10JPVX-22JC3T0 1TB | 23 | 0.29% |
| SK Hynix NVMe SSD Drive 512GB | 23 | 0.29% |
| SK Hynix NVMe SSD Drive 256GB | 23 | 0.29% |
| Seagate ST9500325AS 500GB | 23 | 0.29% |
| Samsung SSD 970 EVO Plus 1TB | 23 | 0.29% |
| WDC WDS120G2G0A-00JH30 120GB SSD | 22 | 0.28% |
| WDC WD10SPZX-21Z10T0 1TB | 22 | 0.28% |
| SanDisk SSD PLUS 240GB | 22 | 0.28% |
| HGST HTS541010A9E680 1TB | 22 | 0.28% |
| Toshiba NVMe SSD Drive 512GB | 21 | 0.26% |
| Toshiba HDWD110 1TB | 20 | 0.25% |
| Kingston SUV400S37240G 240GB SSD | 20 | 0.25% |
| Samsung SSD 970 EVO Plus 500GB | 19 | 0.24% |
| Kingston SV300S37A240G 240GB SSD | 19 | 0.24% |
| Samsung SSD 970 EVO 1TB | 18 | 0.23% |
| Samsung SSD 840 EVO 250GB | 18 | 0.23% |
HDD Vendor
Hard disk drive vendors


| Vendor | Computers | Drives | Percent |
|---|---|---|---|
| Seagate | 1091 | 1319 | 34.91% |
| WDC | 987 | 1219 | 31.58% |
| Toshiba | 376 | 396 | 12.03% |
| Hitachi | 255 | 270 | 8.16% |
| Samsung Electronics | 140 | 161 | 4.48% |
| HGST | 124 | 128 | 3.97% |
| Fujitsu | 40 | 41 | 1.28% |
| Maxtor | 38 | 41 | 1.22% |
| Apple | 21 | 22 | 0.67% |
| ASMT | 15 | 20 | 0.48% |
| Sabrent | 4 | 6 | 0.13% |
| TO Exter | 3 | 3 | 0.1% |
| Intenso | 3 | 3 | 0.1% |
| Asmedia | 3 | 3 | 0.1% |
| Unknown | 2 | 2 | 0.06% |
| Maxone | 2 | 2 | 0.06% |
| KESU | 2 | 2 | 0.06% |
| IBM/Hitachi | 2 | 2 | 0.06% |
| Hewlett-Packard | 2 | 3 | 0.06% |
| ExcelStor | 2 | 2 | 0.06% |
| WD MediaMax | 1 | 2 | 0.03% |
| USB3.0 | 1 | 1 | 0.03% |
| SYNOLOGY | 1 | 1 | 0.03% |
| PHD 3.0 | 1 | 1 | 0.03% |
| OEM | 1 | 1 | 0.03% |
| MARSHAL | 1 | 1 | 0.03% |
| LIO-ORG | 1 | 9 | 0.03% |
| LaCie | 1 | 1 | 0.03% |
| JMicron | 1 | 1 | 0.03% |
| Generic- | 1 | 1 | 0.03% |
| China | 1 | 1 | 0.03% |
| ASMT109x | 1 | 1 | 0.03% |
| ACASIS | 1 | 1 | 0.03% |
SSD Vendor
Solid state drive vendors


| Vendor | Computers | Drives | Percent |
|---|---|---|---|
| Samsung Electronics | 580 | 675 | 23.63% |
| Kingston | 351 | 378 | 14.3% |
| SanDisk | 221 | 228 | 9.01% |
| Crucial | 218 | 242 | 8.88% |
| WDC | 184 | 199 | 7.5% |
| A-DATA Technology | 87 | 92 | 3.55% |
| Intel | 65 | 70 | 2.65% |
| China | 50 | 52 | 2.04% |
| PNY | 47 | 51 | 1.92% |
| Toshiba | 43 | 44 | 1.75% |
| SK Hynix | 39 | 39 | 1.59% |
| Micron Technology | 39 | 45 | 1.59% |
| SPCC | 36 | 38 | 1.47% |
| Transcend | 33 | 33 | 1.34% |
| GOODRAM | 33 | 34 | 1.34% |
| OCZ | 29 | 33 | 1.18% |
| Patriot | 27 | 28 | 1.1% |
| LITEON | 27 | 27 | 1.1% |
| Apple | 19 | 19 | 0.77% |
| Apacer | 19 | 19 | 0.77% |
| Unknown | 17 | 18 | 0.69% |
| Team | 16 | 17 | 0.65% |
| LITEONIT | 16 | 16 | 0.65% |
| JMicron | 13 | 14 | 0.53% |
| Corsair | 13 | 13 | 0.53% |
| KingSpec | 12 | 12 | 0.49% |
| Intenso | 11 | 11 | 0.45% |
| KingDian | 10 | 10 | 0.41% |
| Hewlett-Packard | 10 | 10 | 0.41% |
| Seagate | 9 | 9 | 0.37% |
| PLEXTOR | 9 | 10 | 0.37% |
| FORESEE | 9 | 9 | 0.37% |
| Smartbuy | 8 | 9 | 0.33% |
| Gigabyte Technology | 8 | 8 | 0.33% |
| SABRENT | 7 | 7 | 0.29% |
| Lexar | 7 | 7 | 0.29% |
| AMD | 6 | 6 | 0.24% |
| Mushkin | 5 | 5 | 0.2% |
| Dogfish | 5 | 5 | 0.2% |
| USB30 | 4 | 4 | 0.16% |
| PNY USB | 4 | 4 | 0.16% |
| OWC | 4 | 4 | 0.16% |
| Netac | 4 | 4 | 0.16% |
| Hoodisk | 4 | 4 | 0.16% |
| DREVO | 4 | 4 | 0.16% |
| WDC WDS | 3 | 3 | 0.12% |
| Vaseky | 3 | 3 | 0.12% |
| Leven | 3 | 3 | 0.12% |
| LDLC | 3 | 3 | 0.12% |
| KIOXIA-EXCERIA | 3 | 3 | 0.12% |
| External | 3 | 3 | 0.12% |
| Colorful | 3 | 3 | 0.12% |
| XrayDisk | 2 | 2 | 0.08% |
| W800S | 2 | 2 | 0.08% |
| Verbatim | 2 | 2 | 0.08% |
| Union Memory | 2 | 2 | 0.08% |
| Radeon | 2 | 2 | 0.08% |
| MyDigitalSSD | 2 | 2 | 0.08% |
| Maxtor | 2 | 2 | 0.08% |
| KingFast | 2 | 2 | 0.08% |
Drive Kind
HDD or SSD


| Kind | Computers | Drives | Percent |
|---|---|---|---|
| HDD | 2657 | 3667 | 41% |
| SSD | 2166 | 2685 | 33.42% |
| NVMe | 1281 | 1526 | 19.77% |
| MMC | 244 | 276 | 3.76% |
| Unknown | 133 | 146 | 2.05% |
Drive Connector
SATA, SAS, NVMe, etc.


| Type | Computers | Drives | Percent |
|---|---|---|---|
| SATA | 3924 | 6161 | 68.57% |
| NVMe | 1278 | 1521 | 22.33% |
| SAS | 277 | 342 | 4.84% |
| MMC | 244 | 276 | 4.26% |
Drive Size
Size of hard drive


| Size in TB | Computers | Drives | Percent |
|---|---|---|---|
| 0.01-0.5 | 2981 | 3871 | 59.48% |
| 0.51-1.0 | 1394 | 1653 | 27.81% |
| 1.01-2.0 | 355 | 437 | 7.08% |
| 3.01-4.0 | 135 | 176 | 2.69% |
| 2.01-3.0 | 77 | 98 | 1.54% |
| 4.01-10.0 | 64 | 87 | 1.28% |
| 10.01-20.0 | 5 | 29 | 0.1% |
| 0 | 1 | 1 | 0.02% |
Space Total
Amount of disk space available on the file system


| Size in GB | Computers | Percent |
|---|---|---|
| 101-250 | 1267 | 25.63% |
| 251-500 | 1046 | 21.16% |
| 501-1000 | 722 | 14.61% |
| 1-20 | 392 | 7.93% |
| 1001-2000 | 367 | 7.42% |
| Unknown | 304 | 6.15% |
| 51-100 | 295 | 5.97% |
| More than 3000 | 221 | 4.47% |
| 21-50 | 189 | 3.82% |
| 2001-3000 | 140 | 2.83% |
Space Used
Amount of used disk space


| Used GB | Computers | Percent |
|---|---|---|
| 1-20 | 1875 | 37.93% |
| 21-50 | 747 | 15.11% |
| 101-250 | 609 | 12.32% |
| 51-100 | 500 | 10.12% |
| 251-500 | 371 | 7.51% |
| Unknown | 304 | 6.15% |
| 501-1000 | 253 | 5.12% |
| 1001-2000 | 168 | 3.4% |
| More than 3000 | 62 | 1.25% |
| 2001-3000 | 54 | 1.09% |
Malfunc. Drives
Drive models with a malfunction


| Model | Computers | Drives | Percent |
|---|---|---|---|
| Seagate ST500DM002-1BD142 500GB | 16 | 17 | 2.87% |
| Seagate ST9500325AS 500GB | 9 | 9 | 1.62% |
| Seagate ST1000LM024 HN-M101MBB 1TB | 8 | 8 | 1.44% |
| Seagate ST500LT012-1DG142 500GB | 5 | 5 | 0.9% |
| Seagate ST3500418AS 500GB | 5 | 5 | 0.9% |
| Seagate ST3160815AS 160GB | 5 | 5 | 0.9% |
| WDC WD20EARX-00PASB0 2TB | 4 | 4 | 0.72% |
| Toshiba MQ01ABF050 500GB | 4 | 4 | 0.72% |
| Seagate ST9320325AS 320GB | 4 | 4 | 0.72% |
| Seagate ST500LT012-9WS142 500GB | 4 | 4 | 0.72% |
| Seagate ST3250310AS 250GB | 4 | 4 | 0.72% |
| Seagate ST31000524AS 1TB | 4 | 4 | 0.72% |
| Samsung Electronics HD501LJ 500GB | 4 | 4 | 0.72% |
| Hitachi HTS547550A9E384 500GB | 4 | 4 | 0.72% |
| HGST HTS721010A9E630 1TB | 4 | 4 | 0.72% |
| HGST HTS541010A9E680 1TB | 4 | 4 | 0.72% |
| WDC WD6400AAKS-22A7B2 640GB | 3 | 3 | 0.54% |
| WDC WD5000AAKX-003CA0 500GB | 3 | 3 | 0.54% |
| WDC WD10JPVX-22JC3T0 1TB | 3 | 3 | 0.54% |
| Toshiba MQ01ABD100 1TB | 3 | 3 | 0.54% |
| Toshiba DT01ACA200 2TB | 3 | 3 | 0.54% |
| Seagate ST9120822AS 120GB | 3 | 3 | 0.54% |
| Seagate ST320LT020-9YG142 320GB | 3 | 3 | 0.54% |
| Seagate ST320LT007-9ZV142 320GB | 3 | 3 | 0.54% |
| Seagate ST31500341AS 1TB | 3 | 3 | 0.54% |
| Seagate ST2000LM007-1R8174 2TB | 3 | 3 | 0.54% |
| Seagate ST1000LM035-1RK172 1TB | 3 | 3 | 0.54% |
| Seagate ST1000DX001-1CM162 1TB | 3 | 3 | 0.54% |
| SanDisk SD9SN8W-128G-1006 128GB SSD | 3 | 3 | 0.54% |
| Samsung Electronics HD502HI 500GB | 3 | 4 | 0.54% |
| Kingston SV300S37A120G 120GB SSD | 3 | 3 | 0.54% |
| Hitachi HTS547575A9E384 752GB | 3 | 3 | 0.54% |
| Hitachi HTS545050A7E380 500GB | 3 | 3 | 0.54% |
| Hitachi HTS545032B9A300 320GB | 3 | 3 | 0.54% |
| HGST HTS545050A7E380 500GB | 3 | 3 | 0.54% |
| WDC WDS240G2G0A-00JH30 240GB SSD | 2 | 2 | 0.36% |
| WDC WD5000AAKX-75U6AA0 500GB | 2 | 2 | 0.36% |
| WDC WD5000AAKX-00ERMA0 500GB | 2 | 2 | 0.36% |
| WDC WD5000AAKS-00V6A0 500GB | 2 | 2 | 0.36% |
| WDC WD5000AAKS-00D2B0 500GB | 2 | 2 | 0.36% |
| WDC WD40EFRX-68N32N0 4TB | 2 | 2 | 0.36% |
| WDC WD3200BPVT-22ZEST0 320GB | 2 | 2 | 0.36% |
| WDC WD30EZRX-00DC0B0 3TB | 2 | 2 | 0.36% |
| WDC WD2500BEVT-80A23T0 250GB | 2 | 2 | 0.36% |
| WDC WD10EZEX-60ZF5A0 1TB | 2 | 2 | 0.36% |
| WDC WD10EZEX-00RKKA0 1TB | 2 | 2 | 0.36% |
| WDC WD10EZEX-00MFCA0 1TB | 2 | 2 | 0.36% |
| WDC WD10EARS-00Y5B1 1TB | 2 | 2 | 0.36% |
| WDC WD10EARS-00MVWB0 1TB | 2 | 2 | 0.36% |
| WDC WD10EADS-22M2B0 1TB | 2 | 2 | 0.36% |
| WDC WD10EADS-00M2B0 1TB | 2 | 2 | 0.36% |
| WDC WD1003FZEX-00MK2A0 1TB | 2 | 3 | 0.36% |
| Toshiba MQ01ABD075 752GB | 2 | 2 | 0.36% |
| Toshiba MQ01ABD050 500GB | 2 | 2 | 0.36% |
| Toshiba MK7559GSXP 752GB | 2 | 2 | 0.36% |
| Toshiba MK3259GSXP 320GB | 2 | 2 | 0.36% |
| Toshiba MK1652GSX 160GB | 2 | 2 | 0.36% |
| Toshiba DT01ACA300 3TB | 2 | 2 | 0.36% |
| Seagate ST9500420AS 500GB | 2 | 3 | 0.36% |
| Seagate ST750LM022 HN-M750MBB 752GB | 2 | 2 | 0.36% |
Malfunc. Drive Vendor
Vendors of faulty drives


| Vendor | Computers | Drives | Percent |
|---|---|---|---|
| Seagate | 162 | 170 | 30.06% |
| WDC | 127 | 140 | 23.56% |
| Hitachi | 53 | 53 | 9.83% |
| Toshiba | 47 | 47 | 8.72% |
| Samsung Electronics | 38 | 45 | 7.05% |
| HGST | 15 | 15 | 2.78% |
| Kingston | 12 | 12 | 2.23% |
| Fujitsu | 11 | 11 | 2.04% |
| SanDisk | 9 | 9 | 1.67% |
| Maxtor | 9 | 9 | 1.67% |
| Intel | 8 | 8 | 1.48% |
| Crucial | 8 | 8 | 1.48% |
| SK Hynix | 6 | 6 | 1.11% |
| Micron Technology | 5 | 5 | 0.93% |
| China | 5 | 5 | 0.93% |
| A-DATA Technology | 4 | 4 | 0.74% |
| Unknown | 3 | 3 | 0.56% |
| OCZ | 3 | 3 | 0.56% |
| SPCC | 2 | 2 | 0.37% |
| ASMT | 2 | 2 | 0.37% |
| Apple | 2 | 2 | 0.37% |
| Zheino | 1 | 1 | 0.19% |
| Silicon Motion | 1 | 1 | 0.19% |
| MARSHAL | 1 | 1 | 0.19% |
| LITEON | 1 | 1 | 0.19% |
| KingSpec | 1 | 1 | 0.19% |
| KingDian | 1 | 1 | 0.19% |
| Corsair | 1 | 1 | 0.19% |
| Colorful | 1 | 1 | 0.19% |
Malfunc. HDD Vendor
Vendors of faulty HDD drives


| Vendor | Computers | Drives | Percent |
|---|---|---|---|
| Seagate | 162 | 170 | 35.84% |
| WDC | 120 | 133 | 26.55% |
| Hitachi | 53 | 53 | 11.73% |
| Toshiba | 45 | 45 | 9.96% |
| Samsung Electronics | 30 | 37 | 6.64% |
| HGST | 15 | 15 | 3.32% |
| Fujitsu | 11 | 11 | 2.43% |
| Maxtor | 9 | 9 | 1.99% |
| ASMT | 2 | 2 | 0.44% |
| Apple | 2 | 2 | 0.44% |
| Unknown | 1 | 1 | 0.22% |
| MARSHAL | 1 | 1 | 0.22% |
| China | 1 | 1 | 0.22% |
Malfunc. Drive Kind
Kinds of faulty drives


| Kind | Computers | Drives | Percent |
|---|---|---|---|
| HDD | 410 | 480 | 82.49% |
| SSD | 84 | 84 | 16.9% |
| NVMe | 3 | 3 | 0.6% |
Failed Drives
Failed drive models


| Model | Computers | Drives | Percent |
|---|---|---|---|
| Hitachi HDS721010DLE630 1TB | 2 | 3 | 16.67% |
| WDC WD5000M22K-24Z1LT0-SSHD-16GB | 1 | 1 | 8.33% |
| WDC WD5000BEVT-60ZAT1 500GB | 1 | 1 | 8.33% |
| WDC WD1600JB-00REA0 160GB | 1 | 1 | 8.33% |
| Toshiba MK6475GSX 640GB | 1 | 1 | 8.33% |
| Seagate ST3500830AS 500GB | 1 | 1 | 8.33% |
| Samsung Electronics MZNTY128HDHP-000L1 128GB SSD | 1 | 1 | 8.33% |
| Samsung Electronics MZNTY128HDHP-000H1 128GB SSD | 1 | 1 | 8.33% |
| Hitachi HDS721075CLA332 752GB | 1 | 1 | 8.33% |
| Hitachi HDS721010CLA332 1TB | 1 | 1 | 8.33% |
| Hewlett-Packard SSD EX900 250GB | 1 | 1 | 8.33% |
Failed Drive Vendor
Failed drive vendors

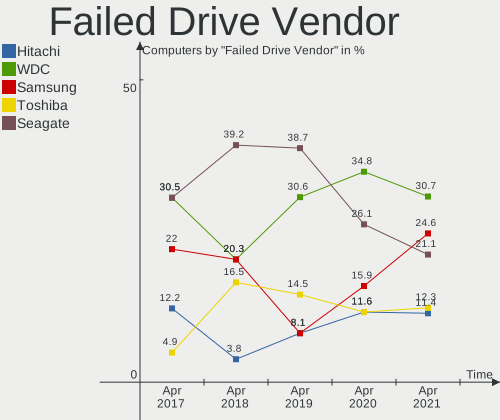
| Vendor | Computers | Drives | Percent |
|---|---|---|---|
| Hitachi | 4 | 5 | 33.33% |
| WDC | 3 | 3 | 25% |
| Samsung Electronics | 2 | 2 | 16.67% |
| Toshiba | 1 | 1 | 8.33% |
| Seagate | 1 | 1 | 8.33% |
| Hewlett-Packard | 1 | 1 | 8.33% |
Drive Status
Number of failed and malfunc. drives


| Status | Computers | Drives | Percent |
|---|---|---|---|
| Detected | 2879 | 4712 | 54.7% |
| Works | 1889 | 3008 | 35.89% |
| Malfunc | 483 | 567 | 9.18% |
| Failed | 12 | 13 | 0.23% |
Storage Vendor
Storage controller vendors


| Vendor | Computers | Percent |
|---|---|---|
| Intel | 3264 | 54.13% |
| AMD | 1052 | 17.45% |
| Samsung Electronics | 464 | 7.69% |
| Sandisk | 187 | 3.1% |
| SK Hynix | 113 | 1.87% |
| Nvidia | 106 | 1.76% |
| ASMedia Technology | 94 | 1.56% |
| Phison Electronics | 92 | 1.53% |
| Marvell Technology Group | 81 | 1.34% |
| Toshiba America Info Systems | 75 | 1.24% |
| JMicron Technology | 71 | 1.18% |
| Kingston Technology Company | 67 | 1.11% |
| Silicon Motion | 43 | 0.71% |
| ADATA Technology | 39 | 0.65% |
| Micron/Crucial Technology | 37 | 0.61% |
| Micron Technology | 36 | 0.6% |
| KIOXIA | 30 | 0.5% |
| VIA Technologies | 28 | 0.46% |
| Broadcom / LSI | 21 | 0.35% |
| LSI Logic / Symbios Logic | 15 | 0.25% |
| Union Memory (Shenzhen) | 14 | 0.23% |
| Silicon Integrated Systems [SiS] | 14 | 0.23% |
| Silicon Image | 14 | 0.23% |
| Realtek Semiconductor | 11 | 0.18% |
| Lite-On Technology | 11 | 0.18% |
| Seagate Technology | 9 | 0.15% |
| Hewlett-Packard | 8 | 0.13% |
| Apple | 8 | 0.13% |
| Solid State Storage Technology | 6 | 0.1% |
| Adaptec | 5 | 0.08% |
| Lenovo | 4 | 0.07% |
| Shenzhen Longsys Electronics | 3 | 0.05% |
| Integrated Technology Express | 2 | 0.03% |
| ULi Electronics | 1 | 0.02% |
| Promise Technology | 1 | 0.02% |
| OCZ Technology Group | 1 | 0.02% |
| Broadcom | 1 | 0.02% |
| Areca Technology | 1 | 0.02% |
| 3ware | 1 | 0.02% |
Storage Model
Storage controller models


| Model | Computers | Percent |
|---|---|---|
| AMD FCH SATA Controller [AHCI mode] | 711 | 10% |
| Samsung NVMe SSD Controller SM981/PM981/PM983 | 309 | 4.34% |
| Intel 8 Series/C220 Series Chipset Family 6-port SATA Controller 1 [AHCI mode] | 235 | 3.3% |
| Intel Sunrise Point-LP SATA Controller [AHCI mode] | 231 | 3.25% |
| Intel 7 Series Chipset Family 6-port SATA Controller [AHCI mode] | 215 | 3.02% |
| Intel 6 Series/C200 Series Chipset Family 6 port Mobile SATA AHCI Controller | 198 | 2.78% |
| Intel 82801 Mobile SATA Controller [RAID mode] | 189 | 2.66% |
| AMD 400 Series Chipset SATA Controller | 156 | 2.19% |
| AMD SB7x0/SB8x0/SB9x0 SATA Controller [AHCI mode] | 124 | 1.74% |
| Intel 6 Series/C200 Series Chipset Family 6 port Desktop SATA AHCI Controller | 122 | 1.72% |
| AMD SB7x0/SB8x0/SB9x0 IDE Controller | 122 | 1.72% |
| Intel NM10/ICH7 Family SATA Controller [IDE mode] | 119 | 1.67% |
| Intel 8 Series SATA Controller 1 [AHCI mode] | 113 | 1.59% |
| Intel 82801G (ICH7 Family) IDE Controller | 111 | 1.56% |
| Intel Q170/Q150/B150/H170/H110/Z170/CM236 Chipset SATA Controller [AHCI Mode] | 103 | 1.45% |
| Intel 82801IBM/IEM (ICH9M/ICH9M-E) 4 port SATA Controller [AHCI mode] | 95 | 1.34% |
| Intel 200 Series PCH SATA controller [AHCI mode] | 94 | 1.32% |
| ASMedia ASM1062 Serial ATA Controller | 92 | 1.29% |
| Intel 7 Series/C210 Series Chipset Family 6-port SATA Controller [AHCI mode] | 84 | 1.18% |
| Intel SATA Controller [RAID mode] | 82 | 1.15% |
| Intel Cannon Lake Mobile PCH SATA AHCI Controller | 78 | 1.1% |
| AMD SB7x0/SB8x0/SB9x0 SATA Controller [IDE mode] | 78 | 1.1% |
| Intel Wildcat Point-LP SATA Controller [AHCI Mode] | 77 | 1.08% |
| Intel Comet Lake SATA AHCI Controller | 71 | 1% |
| Intel Cannon Lake PCH SATA AHCI Controller | 70 | 0.98% |
| AMD Starship/Matisse Chipset SATA Controller [AHCI mode] | 69 | 0.97% |
| Intel 5 Series/3400 Series Chipset 4 port SATA AHCI Controller | 68 | 0.96% |
| Intel 82801HM/HEM (ICH8M/ICH8M-E) IDE Controller | 60 | 0.84% |
| Intel 6 Series/C200 Series Chipset Family Desktop SATA Controller (IDE mode, ports 4-5) | 60 | 0.84% |
| Intel 6 Series/C200 Series Chipset Family Desktop SATA Controller (IDE mode, ports 0-3) | 60 | 0.84% |
| Intel 5 Series/3400 Series Chipset 6 port SATA AHCI Controller | 60 | 0.84% |
| Sandisk WD Black SN750 / PC SN730 NVMe SSD | 56 | 0.79% |
| Intel Celeron/Pentium Silver Processor SATA Controller | 56 | 0.79% |
| Intel 82801HM/HEM (ICH8M/ICH8M-E) SATA Controller [AHCI mode] | 53 | 0.75% |
| Samsung NVMe Controller | 52 | 0.73% |
| Intel SSD 660P Series | 52 | 0.73% |
| Intel HM170/QM170 Chipset SATA Controller [AHCI Mode] | 51 | 0.72% |
| Sandisk WD Blue SN550 NVMe SSD | 49 | 0.69% |
| Intel 400 Series Chipset Family SATA AHCI Controller | 49 | 0.69% |
| Samsung NVMe SSD Controller SM961/PM961/SM963 | 48 | 0.67% |
| Phison E12 NVMe Controller | 45 | 0.63% |
| AMD FCH SATA Controller D | 45 | 0.63% |
| AMD 300 Series Chipset SATA Controller | 45 | 0.63% |
| Nvidia MCP61 SATA Controller | 40 | 0.56% |
| Intel 9 Series Chipset Family SATA Controller [AHCI Mode] | 40 | 0.56% |
| Intel Atom Processor E3800 Series SATA AHCI Controller | 39 | 0.55% |
| SK Hynix BC511 | 36 | 0.51% |
| Micron Non-Volatile memory controller | 36 | 0.51% |
| Intel Cannon Point-LP SATA Controller [AHCI Mode] | 36 | 0.51% |
| Silicon Motion SM2263EN/SM2263XT SSD Controller | 35 | 0.49% |
| Intel Volume Management Device NVMe RAID Controller | 35 | 0.49% |
| Nvidia MCP61 IDE | 34 | 0.48% |
| Intel Celeron N3350/Pentium N4200/Atom E3900 Series SATA AHCI Controller | 33 | 0.46% |
| Intel Atom/Celeron/Pentium Processor x5-E8000/J3xxx/N3xxx Series SATA Controller | 33 | 0.46% |
| Kingston Company A2000 NVMe SSD | 32 | 0.45% |
| Intel 82801JI (ICH10 Family) 4 port SATA IDE Controller #1 | 32 | 0.45% |
| JMicron JMB363 SATA/IDE Controller | 31 | 0.44% |
| Intel 82801JI (ICH10 Family) 2 port SATA IDE Controller #2 | 31 | 0.44% |
| Toshiba America Info Systems XG6 NVMe SSD Controller | 30 | 0.42% |
| SK Hynix BC501 NVMe Solid State Drive 512GB | 30 | 0.42% |
Storage Kind
Kind of storage controller (IDE, SATA, NVMe, SAS, ...)


| Kind | Computers | Percent |
|---|---|---|
| SATA | 3602 | 58.92% |
| NVMe | 1278 | 20.91% |
| IDE | 837 | 13.69% |
| RAID | 362 | 5.92% |
| SAS | 17 | 0.28% |
| SCSI | 17 | 0.28% |
CPU Vendor
Processor vendors


| Vendor | Computers | Percent |
|---|---|---|
| Intel | 3636 | 73.56% |
| AMD | 1233 | 24.94% |
| ARM | 63 | 1.27% |
| QUALCOMM | 4 | 0.08% |
| Unknown | 3 | 0.06% |
| Marvell Semiconductor | 2 | 0.04% |
| CentaurHauls | 2 | 0.04% |
CPU Model
Processor models


| Model | Computers | Percent |
|---|---|---|
| AMD Ryzen 5 3600 6-Core Processor | 56 | 1.13% |
| Intel Core i5-8250U CPU @ 1.60GHz | 55 | 1.11% |
| Intel Core i5-7200U CPU @ 2.50GHz | 52 | 1.05% |
| ARM Processor | 48 | 0.97% |
| Intel Core i7-8550U CPU @ 1.80GHz | 47 | 0.95% |
| Intel Core i7-10510U CPU @ 1.80GHz | 46 | 0.93% |
| Intel Core i5-2520M CPU @ 2.50GHz | 40 | 0.81% |
| Intel Core i7-8565U CPU @ 1.80GHz | 39 | 0.79% |
| AMD Ryzen 5 3500U with Radeon Vega Mobile Gfx | 39 | 0.79% |
| Intel Core i7-9750H CPU @ 2.60GHz | 36 | 0.73% |
| Intel Core i7-10750H CPU @ 2.60GHz | 36 | 0.73% |
| Intel Core i5-10210U CPU @ 1.60GHz | 36 | 0.73% |
| Intel Core 2 Duo CPU E8400 @ 3.00GHz | 36 | 0.73% |
| Intel Core i5-6200U CPU @ 2.30GHz | 34 | 0.69% |
| AMD Ryzen 7 3700X 8-Core Processor | 34 | 0.69% |
| Intel 11th Gen Core i7-1165G7 @ 2.80GHz | 32 | 0.65% |
| Intel Core i7-7700HQ CPU @ 2.80GHz | 31 | 0.63% |
| AMD Ryzen 7 4700U with Radeon Graphics | 31 | 0.63% |
| Intel Core i7-2600 CPU @ 3.40GHz | 30 | 0.61% |
| AMD Ryzen 7 4800H with Radeon Graphics | 29 | 0.59% |
| Intel Core i5-3320M CPU @ 2.60GHz | 28 | 0.57% |
| Intel Core i5-5200U CPU @ 2.20GHz | 27 | 0.55% |
| Intel Core i5-3470 CPU @ 3.20GHz | 27 | 0.55% |
| Intel Core i5-3210M CPU @ 2.50GHz | 25 | 0.51% |
| Intel Core i5-1035G1 CPU @ 1.00GHz | 25 | 0.51% |
| Intel Core 2 Quad CPU Q6600 @ 2.40GHz | 25 | 0.51% |
| AMD Ryzen 9 3900X 12-Core Processor | 25 | 0.51% |
| AMD Ryzen 5 2600 Six-Core Processor | 25 | 0.51% |
| AMD Ryzen 5 2500U with Radeon Vega Mobile Gfx | 25 | 0.51% |
| Intel Core i7-4790 CPU @ 3.60GHz | 24 | 0.49% |
| Intel Core i7-2670QM CPU @ 2.20GHz | 24 | 0.49% |
| AMD Ryzen 5 1600 Six-Core Processor | 24 | 0.49% |
| AMD FX-8350 Eight-Core Processor | 24 | 0.49% |
| Intel Core i7-6700HQ CPU @ 2.60GHz | 23 | 0.47% |
| Intel Core i5-8265U CPU @ 1.60GHz | 23 | 0.47% |
| Intel Atom x5-Z8350 CPU @ 1.44GHz | 23 | 0.47% |
| AMD Ryzen 5 3400G with Radeon Vega Graphics | 23 | 0.47% |
| AMD Ryzen 5 4500U with Radeon Graphics | 22 | 0.45% |
| Intel Core i7-7500U CPU @ 2.70GHz | 21 | 0.42% |
| Intel Core i5-2450M CPU @ 2.50GHz | 21 | 0.42% |
| Intel Core i7-8750H CPU @ 2.20GHz | 20 | 0.4% |
| Intel Core i7-1065G7 CPU @ 1.30GHz | 20 | 0.4% |
| Intel 11th Gen Core i5-1135G7 @ 2.40GHz | 20 | 0.4% |
| Intel Core i5-2400 CPU @ 3.10GHz | 19 | 0.38% |
| Intel Core i3-2120 CPU @ 3.30GHz | 19 | 0.38% |
| AMD Ryzen 5 5600X 6-Core Processor | 19 | 0.38% |
| Intel Core i3-2350M CPU @ 2.30GHz | 18 | 0.36% |
| Intel Core i3-2100 CPU @ 3.10GHz | 18 | 0.36% |
| Intel Celeron N4000 CPU @ 1.10GHz | 18 | 0.36% |
| AMD FX-6300 Six-Core Processor | 18 | 0.36% |
| Intel Core i7-3630QM CPU @ 2.40GHz | 17 | 0.34% |
| Intel Core i5-9300H CPU @ 2.40GHz | 17 | 0.34% |
| Intel Core i5-4590 CPU @ 3.30GHz | 17 | 0.34% |
| Intel Core i5-3230M CPU @ 2.60GHz | 17 | 0.34% |
| Intel Core i7-5500U CPU @ 2.40GHz | 16 | 0.32% |
| Intel Core i7-4790K CPU @ 4.00GHz | 16 | 0.32% |
| Intel Core i5-8300H CPU @ 2.30GHz | 16 | 0.32% |
| Intel Core i5-6300U CPU @ 2.40GHz | 16 | 0.32% |
| Intel Core i5-2410M CPU @ 2.30GHz | 16 | 0.32% |
| Intel Core i3-2310M CPU @ 2.10GHz | 16 | 0.32% |
CPU Model Family
Processor model prefix


| Model | Computers | Percent |
|---|---|---|
| Intel Core i5 | 1088 | 22.01% |
| Intel Core i7 | 936 | 18.94% |
| Intel Core i3 | 402 | 8.13% |
| AMD Ryzen 5 | 314 | 6.35% |
| Intel Core 2 Duo | 229 | 4.63% |
| Intel Celeron | 203 | 4.11% |
| AMD Ryzen 7 | 189 | 3.82% |
| Other | 146 | 2.95% |
| Intel Pentium | 143 | 2.89% |
| Intel Xeon | 120 | 2.43% |
| AMD FX | 95 | 1.92% |
| Intel Atom | 90 | 1.82% |
| Intel Core 2 Quad | 70 | 1.42% |
| Intel Pentium Dual-Core | 66 | 1.34% |
| AMD Ryzen 3 | 57 | 1.15% |
| AMD Ryzen 9 | 56 | 1.13% |
| AMD A4 | 45 | 0.91% |
| AMD A6 | 42 | 0.85% |
| Intel Pentium Dual | 41 | 0.83% |
| AMD A8 | 39 | 0.79% |
| Intel Core 2 | 37 | 0.75% |
| Intel Core i9 | 36 | 0.73% |
| AMD Athlon II X2 | 31 | 0.63% |
| AMD A10 | 31 | 0.63% |
| AMD Athlon 64 X2 | 29 | 0.59% |
| AMD E1 | 24 | 0.49% |
| AMD Ryzen 7 PRO | 23 | 0.47% |
| AMD Phenom II X4 | 21 | 0.42% |
| AMD E | 21 | 0.42% |
| AMD Athlon II X4 | 18 | 0.36% |
| AMD Athlon | 18 | 0.36% |
| Intel Pentium Silver | 17 | 0.34% |
| Intel Pentium 4 | 17 | 0.34% |
| AMD Ryzen 5 PRO | 16 | 0.32% |
| AMD Ryzen Threadripper | 14 | 0.28% |
| Intel Genuine | 13 | 0.26% |
| AMD E2 | 13 | 0.26% |
| AMD Turion 64 X2 Mobile | 10 | 0.2% |
| AMD Phenom II X6 | 10 | 0.2% |
| Intel Core m3 | 9 | 0.18% |
| Intel Celeron M | 9 | 0.18% |
| AMD Phenom | 9 | 0.18% |
| AMD Athlon 64 | 9 | 0.18% |
| ARM BCM | 8 | 0.16% |
| Intel Pentium Gold | 7 | 0.14% |
| AMD Turion X2 Dual-Core Mobile | 7 | 0.14% |
| AMD Sempron | 7 | 0.14% |
| AMD Athlon II X3 | 7 | 0.14% |
| AMD GX | 6 | 0.12% |
| AMD A12 | 5 | 0.1% |
| QUALCOMM AArch64 | 4 | 0.08% |
| Intel Pentium D | 4 | 0.08% |
| Intel Core m7 | 4 | 0.08% |
| Intel Core m5 | 4 | 0.08% |
| AMD Turion II Dual-Core | 4 | 0.08% |
| AMD Athlon II Dual-Core | 4 | 0.08% |
| Intel Pentium M | 3 | 0.06% |
| Intel Core Duo | 3 | 0.06% |
| Intel Celeron Dual-Core | 3 | 0.06% |
| AMD Phenom II X2 | 3 | 0.06% |
CPU Cores
Number of processor cores


| Number | Computers | Percent |
|---|---|---|
| 2 | 2066 | 41.8% |
| 4 | 1824 | 36.9% |
| 6 | 479 | 9.69% |
| 8 | 296 | 5.99% |
| 1 | 141 | 2.85% |
| 12 | 55 | 1.11% |
| 3 | 35 | 0.71% |
| 16 | 23 | 0.47% |
| 10 | 8 | 0.16% |
| 24 | 5 | 0.1% |
| 40 | 2 | 0.04% |
| 32 | 2 | 0.04% |
| 20 | 2 | 0.04% |
| 128 | 1 | 0.02% |
| 96 | 1 | 0.02% |
| 64 | 1 | 0.02% |
| 18 | 1 | 0.02% |
| Unknown | 1 | 0.02% |
CPU Sockets
Number of sockets


| Number | Computers | Percent |
|---|---|---|
| 1 | 4892 | 98.97% |
| 2 | 46 | 0.93% |
| 4 | 2 | 0.04% |
| 3 | 2 | 0.04% |
| Unknown | 1 | 0.02% |
CPU Threads
Threads per core (Hyper-Threading)


| Number | Computers | Percent |
|---|---|---|
| 2 | 3093 | 62.57% |
| 1 | 1849 | 37.41% |
| Unknown | 1 | 0.02% |
CPU Op-Modes
CPU Operation Modes (32-bit, 64-bit)


| Op mode | Computers | Percent |
|---|---|---|
| 32-bit, 64-bit | 4836 | 97.84% |
| Unknown | 52 | 1.05% |
| 32-bit | 48 | 0.97% |
| 64-bit | 7 | 0.14% |
CPU Microcode
Microcode number


| Number | Computers | Percent |
|---|---|---|
| Unknown | 1069 | 21.63% |
| 0x206a7 | 328 | 6.64% |
| 0x306a9 | 282 | 5.71% |
| 0x306c3 | 229 | 4.63% |
| 0x1067a | 189 | 3.82% |
| 0x906ea | 138 | 2.79% |
| 0x806ec | 133 | 2.69% |
| 0x506e3 | 101 | 2.04% |
| 0x40651 | 97 | 1.96% |
| 0x08701021 | 95 | 1.92% |
| 0x806ea | 90 | 1.82% |
| 0x806e9 | 86 | 1.74% |
| 0x406e3 | 82 | 1.66% |
| 0x906e9 | 81 | 1.64% |
| 0x6fd | 76 | 1.54% |
| 0x306d4 | 74 | 1.5% |
| 0x20655 | 74 | 1.5% |
| 0x08108109 | 73 | 1.48% |
| 0x10676 | 59 | 1.19% |
| 0x806c1 | 58 | 1.17% |
| 0xa0652 | 54 | 1.09% |
| 0x06001119 | 53 | 1.07% |
| 0x06000852 | 52 | 1.05% |
| 0x08600106 | 49 | 0.99% |
| 0x706e5 | 47 | 0.95% |
| 0x0800820d | 46 | 0.93% |
| 0x906ed | 45 | 0.91% |
| 0x6fb | 45 | 0.91% |
| 0x30678 | 43 | 0.87% |
| 0x010000c8 | 42 | 0.85% |
| 0x406c4 | 39 | 0.79% |
| 0x706a1 | 35 | 0.71% |
| 0x20652 | 34 | 0.69% |
| 0x08600104 | 33 | 0.67% |
| 0x0a201009 | 31 | 0.63% |
| 0x08108102 | 30 | 0.61% |
| 0x08600103 | 28 | 0.57% |
| 0x6f6 | 27 | 0.55% |
| 0x506c9 | 27 | 0.55% |
| 0x406c3 | 26 | 0.53% |
| 0x05000119 | 26 | 0.53% |
| 0x806eb | 24 | 0.49% |
| 0x106e5 | 24 | 0.49% |
| 0xa0653 | 23 | 0.47% |
| 0x0810100b | 23 | 0.47% |
| 0x08701013 | 22 | 0.45% |
| 0x08001138 | 22 | 0.45% |
| 0x06006705 | 22 | 0.45% |
| 0x08101016 | 19 | 0.38% |
| 0x08001137 | 19 | 0.38% |
| 0x0700010f | 19 | 0.38% |
| 0x07030105 | 18 | 0.36% |
| 0xa0655 | 16 | 0.32% |
| 0x906eb | 16 | 0.32% |
| 0x206d7 | 16 | 0.32% |
| 0x206c2 | 16 | 0.32% |
| 0x106ca | 15 | 0.3% |
| 0x106a5 | 15 | 0.3% |
| 0x706a8 | 13 | 0.26% |
| 0x106c2 | 13 | 0.26% |
CPU Microarch
Microarchitecture


| Name | Computers | Percent |
|---|---|---|
| KabyLake | 794 | 16.06% |
| Haswell | 440 | 8.9% |
| SandyBridge | 431 | 8.72% |
| IvyBridge | 359 | 7.26% |
| Penryn | 300 | 6.07% |
| Zen 2 | 299 | 6.05% |
| Skylake | 239 | 4.84% |
| Zen+ | 205 | 4.15% |
| Core | 191 | 3.86% |
| Westmere | 153 | 3.1% |
| Piledriver | 145 | 2.93% |
| CometLake | 134 | 2.71% |
| Zen | 132 | 2.67% |
| Silvermont | 132 | 2.67% |
| K10 | 120 | 2.43% |
| Broadwell | 98 | 1.98% |
| Unknown | 82 | 1.66% |
| TigerLake | 67 | 1.36% |
| Excavator | 61 | 1.23% |
| IceLake | 58 | 1.17% |
| Goldmont plus | 58 | 1.17% |
| K8 Hammer | 55 | 1.11% |
| Zen 3 | 51 | 1.03% |
| Nehalem | 51 | 1.03% |
| Bonnell | 40 | 0.81% |
| Bobcat | 39 | 0.79% |
| Goldmont | 37 | 0.75% |
| Puma | 32 | 0.65% |
| Jaguar | 32 | 0.65% |
| NetBurst | 26 | 0.53% |
| P6 | 21 | 0.42% |
| Steamroller | 19 | 0.38% |
| K10 Llano | 16 | 0.32% |
| K8 & K10 hybrid | 14 | 0.28% |
| Bulldozer | 12 | 0.24% |
GPU Vendor
Vendors of graphics cards


| Vendor | Computers | Percent |
|---|---|---|
| Intel | 2712 | 47.35% |
| Nvidia | 1646 | 28.74% |
| AMD | 1320 | 23.05% |
| Matrox Electronics Systems | 19 | 0.33% |
| ASPEED Technology | 12 | 0.21% |
| VIA Technologies | 9 | 0.16% |
| Silicon Integrated Systems [SiS] | 8 | 0.14% |
| ATI Technologies | 1 | 0.02% |
GPU Model
Graphics card models


| Model | Computers | Percent |
|---|---|---|
| Intel 2nd Generation Core Processor Family Integrated Graphics Controller | 310 | 5.25% |
| Intel 3rd Gen Core processor Graphics Controller | 206 | 3.49% |
| AMD Renoir | 136 | 2.3% |
| AMD Picasso | 127 | 2.15% |
| Intel Haswell-ULT Integrated Graphics Controller | 124 | 2.1% |
| Intel UHD Graphics 620 | 114 | 1.93% |
| Intel Xeon E3-1200 v3/4th Gen Core Processor Integrated Graphics Controller | 105 | 1.78% |
| Intel CometLake-U GT2 [UHD Graphics] | 104 | 1.76% |
| AMD Ellesmere [Radeon RX 470/480/570/570X/580/580X/590] | 103 | 1.74% |
| Intel CoffeeLake-H GT2 [UHD Graphics 630] | 98 | 1.66% |
| Intel HD Graphics 620 | 96 | 1.63% |
| Intel Core Processor Integrated Graphics Controller | 95 | 1.61% |
| Intel WhiskeyLake-U GT2 [UHD Graphics 620] | 89 | 1.51% |
| Intel Skylake GT2 [HD Graphics 520] | 89 | 1.51% |
| Intel HD Graphics 5500 | 79 | 1.34% |
| Intel Xeon E3-1200 v2/3rd Gen Core processor Graphics Controller | 78 | 1.32% |
| Intel Mobile 4 Series Chipset Integrated Graphics Controller | 78 | 1.32% |
| Intel Atom/Celeron/Pentium Processor x5-E8000/J3xxx/N3xxx Integrated Graphics Controller | 75 | 1.27% |
| Intel 4th Gen Core Processor Integrated Graphics Controller | 75 | 1.27% |
| Intel CometLake-H GT2 [UHD Graphics] | 70 | 1.19% |
| Nvidia GK208B [GeForce GT 710] | 67 | 1.13% |
| Intel TigerLake-LP GT2 [Iris Xe Graphics] | 66 | 1.12% |
| Intel HD Graphics 630 | 65 | 1.1% |
| AMD Raven Ridge [Radeon Vega Series / Radeon Vega Mobile Series] | 63 | 1.07% |
| Intel CometLake-S GT2 [UHD Graphics 630] | 58 | 0.98% |
| Intel HD Graphics 530 | 55 | 0.93% |
| Intel Atom Processor Z36xxx/Z37xxx Series Graphics & Display | 55 | 0.93% |
| Nvidia GP107 [GeForce GTX 1050 Ti] | 53 | 0.9% |
| Intel 4 Series Chipset Integrated Graphics Controller | 49 | 0.83% |
| Intel GeminiLake [UHD Graphics 600] | 42 | 0.71% |
| Intel Mobile GM965/GL960 Integrated Graphics Controller (secondary) | 39 | 0.66% |
| Intel Mobile GM965/GL960 Integrated Graphics Controller (primary) | 39 | 0.66% |
| Nvidia GP107M [GeForce GTX 1050 Mobile] | 37 | 0.63% |
| Nvidia GF117M [GeForce 610M/710M/810M/820M / GT 620M/625M/630M/720M] | 36 | 0.61% |
| Intel Iris Plus Graphics G1 (Ice Lake) | 36 | 0.61% |
| AMD Stoney [Radeon R2/R3/R4/R5 Graphics] | 36 | 0.61% |
| Nvidia TU117M [GeForce GTX 1650 Mobile / Max-Q] | 35 | 0.59% |
| AMD Cedar [Radeon HD 5000/6000/7350/8350 Series] | 34 | 0.58% |
| Intel Mobile 945GM/GMS/GME, 943/940GML Express Integrated Graphics Controller | 32 | 0.54% |
| AMD Topaz XT [Radeon R7 M260/M265 / M340/M360 / M440/M445 / 530/535 / 620/625 Mobile] | 31 | 0.52% |
| AMD Navi 10 [Radeon RX 5600 OEM/5600 XT / 5700/5700 XT] | 31 | 0.52% |
| Nvidia GP106 [GeForce GTX 1060 6GB] | 30 | 0.51% |
| Nvidia GT218 [GeForce 210] | 29 | 0.49% |
| Intel CoffeeLake-S GT2 [UHD Graphics 630] | 28 | 0.47% |
| Nvidia GM206 [GeForce GTX 960] | 27 | 0.46% |
| Intel HD Graphics 500 | 26 | 0.44% |
| AMD Baffin [Radeon RX 460/560D / Pro 450/455/460/555/555X/560/560X] | 26 | 0.44% |
| Nvidia TU116M [GeForce GTX 1660 Ti Mobile] | 25 | 0.42% |
| Intel 4th Generation Core Processor Family Integrated Graphics Controller | 25 | 0.42% |
| AMD Lexa PRO [Radeon 540/540X/550/550X / RX 540X/550/550X] | 25 | 0.42% |
| Nvidia TU117M [GeForce GTX 1650 Ti Mobile] | 24 | 0.41% |
| Nvidia GP108M [GeForce MX150] | 24 | 0.41% |
| Nvidia TU117M | 22 | 0.37% |
| Intel Mobile 945GM/GMS, 943/940GML Express Integrated Graphics Controller | 22 | 0.37% |
| Nvidia GP108 [GeForce GT 1030] | 21 | 0.36% |
| Nvidia GM107 [GeForce GTX 750 Ti] | 21 | 0.36% |
| AMD Wani [Radeon R5/R6/R7 Graphics] | 21 | 0.36% |
| Nvidia TU106M [GeForce RTX 2060 Mobile] | 20 | 0.34% |
| Nvidia GP107M [GeForce GTX 1050 Ti Mobile] | 20 | 0.34% |
| Nvidia GM204 [GeForce GTX 970] | 20 | 0.34% |
GPU Combo
Combinations of graphics cards


| Name | Computers | Percent |
|---|---|---|
| 1 x Intel | 1928 | 39% |
| 1 x AMD | 1050 | 21.24% |
| 1 x Nvidia | 957 | 19.36% |
| Intel + Nvidia | 599 | 12.12% |
| Intel + AMD | 117 | 2.37% |
| 2 x AMD | 85 | 1.72% |
| Other | 76 | 1.54% |
| AMD + Nvidia | 63 | 1.27% |
| 1 x Matrox | 16 | 0.32% |
| 2 x Nvidia | 14 | 0.28% |
| 1 x VIA | 9 | 0.18% |
| 1 x ASPEED | 9 | 0.18% |
| 1 x SiS | 8 | 0.16% |
| Intel + 2 x Nvidia | 3 | 0.06% |
| Nvidia + Matrox | 2 | 0.04% |
| Nvidia + ASPEED | 2 | 0.04% |
| 3 x AMD | 1 | 0.02% |
| Intel + AMD + 1 x Nvidia | 1 | 0.02% |
| AMD + 2 x Nvidia | 1 | 0.02% |
| AMD + Matrox | 1 | 0.02% |
| AMD + ASPEED | 1 | 0.02% |
GPU Driver
Free vs proprietary


| Driver | Computers | Percent |
|---|---|---|
| Free | 3842 | 77.73% |
| Proprietary | 842 | 17.03% |
| Unknown | 259 | 5.24% |
GPU Memory
Total video memory


| Size in GB | Computers | Percent |
|---|---|---|
| Unknown | 2702 | 54.66% |
| 1.01-2.0 | 572 | 11.57% |
| 0.01-0.5 | 536 | 10.84% |
| 0.51-1.0 | 448 | 9.06% |
| 3.01-4.0 | 321 | 6.49% |
| 7.01-8.0 | 171 | 3.46% |
| 5.01-6.0 | 114 | 2.31% |
| 2.01-3.0 | 38 | 0.77% |
| 8.01-16.0 | 36 | 0.73% |
| 16.01-24.0 | 3 | 0.06% |
| 4.01-5.0 | 2 | 0.04% |
Monitor Vendor
Monitor vendors


| Vendor | Computers | Percent |
|---|---|---|
| Samsung Electronics | 690 | 13.17% |
| AU Optronics | 608 | 11.6% |
| LG Display | 458 | 8.74% |
| Chimei Innolux | 393 | 7.5% |
| BOE | 368 | 7.02% |
| Goldstar | 295 | 5.63% |
| Dell | 283 | 5.4% |
| Hewlett-Packard | 190 | 3.63% |
| Acer | 181 | 3.45% |
| BenQ | 145 | 2.77% |
| Philips | 143 | 2.73% |
| AOC | 134 | 2.56% |
| Ancor Communications | 121 | 2.31% |
| Sharp | 99 | 1.89% |
| Lenovo | 95 | 1.81% |
| Chi Mei Optoelectronics | 88 | 1.68% |
| Apple | 82 | 1.56% |
| Iiyama | 51 | 0.97% |
| ViewSonic | 48 | 0.92% |
| Sony | 46 | 0.88% |
| PANDA | 41 | 0.78% |
| LG Philips | 39 | 0.74% |
| LG Electronics | 38 | 0.73% |
| Unknown | 37 | 0.71% |
| ASUSTek Computer | 37 | 0.71% |
| InfoVision | 36 | 0.69% |
| NEC Computers | 30 | 0.57% |
| HannStar | 29 | 0.55% |
| Eizo | 22 | 0.42% |
| Fujitsu Siemens | 20 | 0.38% |
| Toshiba | 18 | 0.34% |
| Vizio | 16 | 0.31% |
| Sceptre Tech | 15 | 0.29% |
| Panasonic | 15 | 0.29% |
| MSI | 13 | 0.25% |
| Vestel Elektronik | 11 | 0.21% |
| Medion | 11 | 0.21% |
| CPT | 10 | 0.19% |
| Hitachi | 9 | 0.17% |
| CSO | 9 | 0.17% |
| Packard Bell | 7 | 0.13% |
| Insignia | 7 | 0.13% |
| Idek Iiyama | 7 | 0.13% |
| Lenovo Group Limited | 6 | 0.11% |
| Belinea | 6 | 0.11% |
| ONN | 5 | 0.1% |
| OEM | 5 | 0.1% |
| LGD | 5 | 0.1% |
| InnoLux Display | 5 | 0.1% |
| Gigabyte Technology | 5 | 0.1% |
| SKY | 4 | 0.08% |
| Microstep | 4 | 0.08% |
| Hyundai ImageQuest | 4 | 0.08% |
| HPN | 4 | 0.08% |
| eMachines | 4 | 0.08% |
| Element | 4 | 0.08% |
| AUS | 4 | 0.08% |
| Unknown (XXX) | 3 | 0.06% |
| Positivo | 3 | 0.06% |
| Pixio | 3 | 0.06% |
Monitor Model
Monitor models


| Model | Computers | Percent |
|---|---|---|
| Samsung Electronics LCD Monitor SEC5441 1366x768 344x194mm 15.5-inch | 28 | 0.52% |
| AU Optronics LCD Monitor AUO38ED 1920x1080 340x190mm 15.3-inch | 27 | 0.5% |
| LG Display LCD Monitor LGD02DC 1366x768 344x194mm 15.5-inch | 24 | 0.45% |
| AU Optronics LCD Monitor AUO61ED 1920x1080 340x190mm 15.3-inch | 23 | 0.43% |
| Chimei Innolux LCD Monitor CMN15DB 1366x768 344x193mm 15.5-inch | 22 | 0.41% |
| Goldstar FULL HD GSM5B55 1920x1080 480x270mm 21.7-inch | 21 | 0.39% |
| AU Optronics LCD Monitor AUO22EC 1366x768 344x193mm 15.5-inch | 18 | 0.34% |
| AU Optronics LCD Monitor AUO21ED 1920x1080 344x194mm 15.5-inch | 18 | 0.34% |
| Chimei Innolux LCD Monitor CMN15F5 1920x1080 344x193mm 15.5-inch | 17 | 0.32% |
| Samsung Electronics S24F350 SAM0D20 1920x1080 521x293mm 23.5-inch | 16 | 0.3% |
| LG Display LCD Monitor LGD033A 1366x768 340x190mm 15.3-inch | 16 | 0.3% |
| Samsung Electronics C27F390 SAM0D32 1920x1080 600x340mm 27.2-inch | 15 | 0.28% |
| Chimei Innolux LCD Monitor CMN15E8 1920x1080 344x193mm 15.5-inch | 15 | 0.28% |
| AU Optronics LCD Monitor AUO71EC 1366x768 340x190mm 15.3-inch | 15 | 0.28% |
| LG Display LCD Monitor LGD046F 1920x1080 344x194mm 15.5-inch | 13 | 0.24% |
| Chimei Innolux LCD Monitor CMN14D4 1920x1080 309x173mm 13.9-inch | 13 | 0.24% |
| AU Optronics LCD Monitor AUO403D 1920x1080 309x173mm 13.9-inch | 13 | 0.24% |
| Goldstar LG ULTRAWIDE GSM59F1 1920x1080 580x240mm 24.7-inch | 12 | 0.22% |
| Chimei Innolux LCD Monitor CMN15E6 1366x768 344x193mm 15.5-inch | 12 | 0.22% |
| Chimei Innolux LCD Monitor CMN14D5 1920x1080 309x173mm 13.9-inch | 12 | 0.22% |
| AU Optronics LCD Monitor AUO26EC 1366x768 344x193mm 15.5-inch | 12 | 0.22% |
| Vestel Elektronik 50UHD_LCD_TV VES3700 3840x2160 1872x1053mm 84.6-inch | 11 | 0.2% |
| LG Display LCD Monitor LGD0395 1366x768 344x194mm 15.5-inch | 11 | 0.2% |
| Chi Mei Optoelectronics LCD Monitor CMO15A7 1366x768 350x190mm 15.7-inch | 11 | 0.2% |
| BOE LCD Monitor BOE0812 1920x1080 344x194mm 15.5-inch | 11 | 0.2% |
| AU Optronics LCD Monitor AUO313C 1366x768 310x170mm 13.9-inch | 11 | 0.2% |
| LG Display LCD Monitor LGD02D8 1366x768 277x156mm 12.5-inch | 10 | 0.19% |
| Goldstar HDR WFHD GSM7714 2560x1080 798x334mm 34.1-inch | 10 | 0.19% |
| Dell U2412M DELA07A 1920x1200 518x324mm 24.1-inch | 10 | 0.19% |
| Chimei Innolux LCD Monitor CMN15E7 1920x1080 344x193mm 15.5-inch | 10 | 0.19% |
| Chi Mei Optoelectronics LCD Monitor CMO15A3 1366x768 344x193mm 15.5-inch | 10 | 0.19% |
| BOE LCD Monitor BOE06A4 1366x768 344x194mm 15.5-inch | 10 | 0.19% |
| AU Optronics LCD Monitor AUO573D 1920x1080 309x174mm 14.0-inch | 10 | 0.19% |
| Philips PHL 243V7 PHLC155 1920x1080 530x300mm 24.0-inch | 9 | 0.17% |
| LG Display LCD Monitor LGD0563 1920x1080 344x194mm 15.5-inch | 9 | 0.17% |
| Chimei Innolux LCD Monitor CMN1734 1600x900 382x214mm 17.2-inch | 9 | 0.17% |
| Chimei Innolux LCD Monitor CMN14C3 1366x768 309x173mm 13.9-inch | 9 | 0.17% |
| AU Optronics LCD Monitor AUO5B2D 1920x1080 293x162mm 13.2-inch | 9 | 0.17% |
| AU Optronics LCD Monitor AUO21EC 1366x768 340x190mm 15.3-inch | 9 | 0.17% |
| AU Optronics LCD Monitor AUO183C 1366x768 309x173mm 13.9-inch | 9 | 0.17% |
| Sharp LCD Monitor SHP149A 1920x1080 344x194mm 15.5-inch | 8 | 0.15% |
| Samsung Electronics S24D330 SAM0D92 1920x1080 531x299mm 24.0-inch | 8 | 0.15% |
| PANDA LCD Monitor NCP004D 1920x1080 344x194mm 15.5-inch | 8 | 0.15% |
| Lenovo LCD Monitor LEN40BA 1920x1080 344x194mm 15.5-inch | 8 | 0.15% |
| Goldstar HDR 4K GSM7707 3840x2160 600x340mm 27.2-inch | 8 | 0.15% |
| Chimei Innolux LCD Monitor CMN1728 1600x900 382x215mm 17.3-inch | 8 | 0.15% |
| Chimei Innolux LCD Monitor CMN15D5 1920x1080 340x190mm 15.3-inch | 8 | 0.15% |
| Chimei Innolux LCD Monitor CMN14D6 1366x768 309x173mm 13.9-inch | 8 | 0.15% |
| Chi Mei Optoelectronics LCD Monitor CMO1720 1920x1080 382x215mm 17.3-inch | 8 | 0.15% |
| Chi Mei Optoelectronics LCD Monitor CMO1592 1366x768 344x193mm 15.5-inch | 8 | 0.15% |
| BOE LCD Monitor BOE0700 1920x1080 344x194mm 15.5-inch | 8 | 0.15% |
| AU Optronics LCD Monitor AUO139E 1600x900 382x214mm 17.2-inch | 8 | 0.15% |
| AU Optronics LCD Monitor AUO106C 1366x768 277x156mm 12.5-inch | 8 | 0.15% |
| Ancor Communications ASUS VS247 ACI249A 1920x1080 521x293mm 23.5-inch | 8 | 0.15% |
| Sharp LCD Monitor SHP144A 3200x1800 294x165mm 13.3-inch | 7 | 0.13% |
| Samsung Electronics LCD Monitor SEC324A 1366x768 344x194mm 15.5-inch | 7 | 0.13% |
| Samsung Electronics Color LCD SDCA029 2160x1440 252x168mm 11.9-inch | 7 | 0.13% |
| Samsung Electronics C24F390 SAM0D2C 1920x1080 520x290mm 23.4-inch | 7 | 0.13% |
| Hewlett-Packard 27fw HPN354A 1920x1080 598x336mm 27.0-inch | 7 | 0.13% |
| Goldstar 27GL850 GSM5B7F 2560x1440 597x336mm 27.0-inch | 7 | 0.13% |
Monitor Resolution
Monitor screen resolution


| Resolution | Computers | Percent |
|---|---|---|
| 1920x1080 (FHD) | 2124 | 42.18% |
| 1366x768 (WXGA) | 1015 | 20.16% |
| 3840x2160 (4K) | 290 | 5.76% |
| 1600x900 (HD+) | 228 | 4.53% |
| 1280x1024 (SXGA) | 221 | 4.39% |
| 2560x1440 (QHD) | 176 | 3.5% |
| 1280x800 (WXGA) | 140 | 2.78% |
| 1440x900 (WXGA+) | 133 | 2.64% |
| 1680x1050 (WSXGA+) | 132 | 2.62% |
| 1920x1200 (WUXGA) | 105 | 2.09% |
| Unknown | 73 | 1.45% |
| 2560x1080 | 49 | 0.97% |
| 1360x768 | 49 | 0.97% |
| 3440x1440 | 30 | 0.6% |
| 1024x600 | 24 | 0.48% |
| 3840x1080 | 19 | 0.38% |
| 1920x540 | 18 | 0.36% |
| 1024x768 (XGA) | 18 | 0.36% |
| 2560x1600 | 16 | 0.32% |
| 3200x1800 (QHD+) | 14 | 0.28% |
| 3840x2400 | 13 | 0.26% |
| 2160x1440 | 11 | 0.22% |
| 1600x1200 | 11 | 0.22% |
| 1280x720 (HD) | 11 | 0.22% |
| 2880x1800 | 8 | 0.16% |
| 4480x1440 | 6 | 0.12% |
| 3840x1600 | 5 | 0.1% |
| 2736x1824 | 5 | 0.1% |
| 1920x1280 | 5 | 0.1% |
| 1400x1050 | 5 | 0.1% |
| 5760x1080 | 4 | 0.08% |
| 3600x1080 | 4 | 0.08% |
| 3000x2000 | 4 | 0.08% |
| 7680x2160 | 3 | 0.06% |
| 7680x1440 | 3 | 0.06% |
| 5760x2160 | 3 | 0.06% |
| 3520x1080 | 3 | 0.06% |
| 2288x1287 | 3 | 0.06% |
| 1680x945 | 3 | 0.06% |
| 1080x2160 | 3 | 0.06% |
| 800x480 | 2 | 0.04% |
| 6400x2160 | 2 | 0.04% |
| 5120x1440 | 2 | 0.04% |
| 3200x1080 | 2 | 0.04% |
| 3072x1920 | 2 | 0.04% |
| 2256x1504 | 2 | 0.04% |
| 1440x2560 | 2 | 0.04% |
| 8246x2160 | 1 | 0.02% |
| 7920x1440 | 1 | 0.02% |
| 5760x1600 | 1 | 0.02% |
| 5760x1200 | 1 | 0.02% |
| 5360x1440 | 1 | 0.02% |
| 5120x1080 | 1 | 0.02% |
| 4240x1440 | 1 | 0.02% |
| 4000x1440 | 1 | 0.02% |
| 3926x1440 | 1 | 0.02% |
| 3920x1440 | 1 | 0.02% |
| 3840x1200 | 1 | 0.02% |
| 3840x1100 | 1 | 0.02% |
| 3840x1024 | 1 | 0.02% |
Monitor Diagonal
Diagonal size in inches


| Inches | Computers | Percent |
|---|---|---|
| 15 | 1341 | 25.71% |
| 13 | 420 | 8.05% |
| 14 | 376 | 7.21% |
| 27 | 355 | 6.81% |
| 23 | 348 | 6.67% |
| 24 | 335 | 6.42% |
| 21 | 332 | 6.37% |
| 17 | 314 | 6.02% |
| Unknown | 284 | 5.45% |
| 19 | 212 | 4.07% |
| 18 | 121 | 2.32% |
| 31 | 95 | 1.82% |
| 22 | 82 | 1.57% |
| 20 | 82 | 1.57% |
| 12 | 82 | 1.57% |
| 34 | 68 | 1.3% |
| 11 | 52 | 1% |
| 84 | 38 | 0.73% |
| 72 | 31 | 0.59% |
| 32 | 29 | 0.56% |
| 10 | 26 | 0.5% |
| 40 | 24 | 0.46% |
| 26 | 18 | 0.35% |
| 54 | 17 | 0.33% |
| 25 | 17 | 0.33% |
| 16 | 13 | 0.25% |
| 49 | 11 | 0.21% |
| 37 | 9 | 0.17% |
| 28 | 8 | 0.15% |
| 36 | 7 | 0.13% |
| 43 | 6 | 0.12% |
| 42 | 6 | 0.12% |
| 52 | 5 | 0.1% |
| 48 | 5 | 0.1% |
| 47 | 5 | 0.1% |
| 29 | 5 | 0.1% |
| 8 | 5 | 0.1% |
| 33 | 4 | 0.08% |
| 55 | 3 | 0.06% |
| 46 | 3 | 0.06% |
| 39 | 3 | 0.06% |
| 5 | 3 | 0.06% |
| 69 | 2 | 0.04% |
| 41 | 2 | 0.04% |
| 38 | 2 | 0.04% |
| 74 | 1 | 0.02% |
| 65 | 1 | 0.02% |
| 63 | 1 | 0.02% |
| 61 | 1 | 0.02% |
| 57 | 1 | 0.02% |
| 50 | 1 | 0.02% |
| 44 | 1 | 0.02% |
| 35 | 1 | 0.02% |
| 9 | 1 | 0.02% |
Monitor Width
Physical width


| Width in mm | Computers | Percent |
|---|---|---|
| 301-350 | 1979 | 38.46% |
| 501-600 | 969 | 18.83% |
| 401-500 | 694 | 13.49% |
| 351-400 | 416 | 8.09% |
| 201-300 | 353 | 6.86% |
| Unknown | 284 | 5.52% |
| 601-700 | 153 | 2.97% |
| 701-800 | 108 | 2.1% |
| 1501-2000 | 72 | 1.4% |
| 1001-1500 | 55 | 1.07% |
| 801-900 | 39 | 0.76% |
| 901-1000 | 14 | 0.27% |
| 101-200 | 6 | 0.12% |
| 1-100 | 3 | 0.06% |
Aspect Ratio
Proportional relationship between the width and the height


| Ratio | Computers | Percent |
|---|---|---|
| 16/9 | 3587 | 75.66% |
| 16/10 | 513 | 10.82% |
| Unknown | 233 | 4.91% |
| 5/4 | 209 | 4.41% |
| 21/9 | 75 | 1.58% |
| 4/3 | 45 | 0.95% |
| 3/2 | 43 | 0.91% |
| 32/9 | 17 | 0.36% |
| 6/5 | 8 | 0.17% |
| 0.46 | 3 | 0.06% |
| 1.96 | 2 | 0.04% |
| 0.62 | 2 | 0.04% |
| 3.88 | 1 | 0.02% |
| 3.76 | 1 | 0.02% |
| 3.40 | 1 | 0.02% |
| 1.00 | 1 | 0.02% |
Monitor Area
Area in inch²

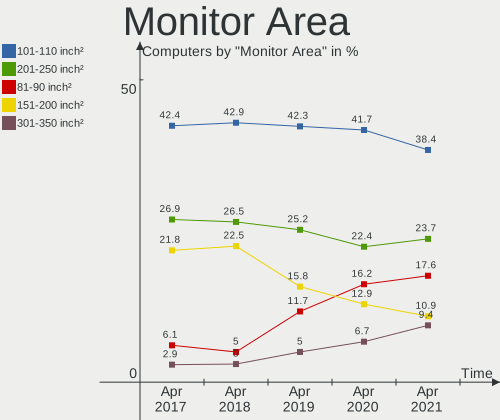
| Area in inch² | Computers | Percent |
|---|---|---|
| 101-110 | 1329 | 25.69% |
| 201-250 | 858 | 16.59% |
| 81-90 | 630 | 12.18% |
| 151-200 | 421 | 8.14% |
| 301-350 | 365 | 7.06% |
| Unknown | 284 | 5.49% |
| 351-500 | 206 | 3.98% |
| 121-130 | 198 | 3.83% |
| 141-150 | 179 | 3.46% |
| 71-80 | 166 | 3.21% |
| 251-300 | 124 | 2.4% |
| More than 1000 | 107 | 2.07% |
| 501-1000 | 79 | 1.53% |
| 61-70 | 73 | 1.41% |
| 51-60 | 52 | 1.01% |
| 131-140 | 39 | 0.75% |
| 41-50 | 26 | 0.5% |
| 111-120 | 14 | 0.27% |
| 91-100 | 13 | 0.25% |
| 1-40 | 10 | 0.19% |
Pixel Density
Pixels per inch


| Density | Computers | Percent |
|---|---|---|
| 51-100 | 1765 | 35% |
| 101-120 | 1386 | 27.48% |
| 121-160 | 1201 | 23.82% |
| Unknown | 284 | 5.63% |
| 161-240 | 199 | 3.95% |
| More than 240 | 104 | 2.06% |
| 1-50 | 104 | 2.06% |
Multiple Monitors
Total monitors connected


| Total | Computers | Percent |
|---|---|---|
| 1 | 3939 | 79.69% |
| 2 | 714 | 14.44% |
| 0 | 221 | 4.47% |
| 3 | 64 | 1.29% |
| 5 | 2 | 0.04% |
| 4 | 2 | 0.04% |
| 6 | 1 | 0.02% |
Net Controller Vendor
Controller vendors


| Vendor | Computers | Percent |
|---|---|---|
| Realtek Semiconductor | 2735 | 36.97% |
| Intel | 2183 | 29.51% |
| Qualcomm Atheros | 959 | 12.96% |
| Broadcom | 415 | 5.61% |
| Broadcom Limited | 106 | 1.43% |
| Ralink Technology | 96 | 1.3% |
| Ralink | 87 | 1.18% |
| Nvidia | 87 | 1.18% |
| Marvell Technology Group | 85 | 1.15% |
| TP-Link | 67 | 0.91% |
| Samsung Electronics | 33 | 0.45% |
| Qualcomm Atheros Communications | 31 | 0.42% |
| ASIX Electronics | 29 | 0.39% |
| D-Link | 25 | 0.34% |
| Dell | 24 | 0.32% |
| Huawei Technologies | 22 | 0.3% |
| Ericsson Business Mobile Networks | 22 | 0.3% |
| NetGear | 21 | 0.28% |
| D-Link System | 20 | 0.27% |
| Xiaomi | 19 | 0.26% |
| Sierra Wireless | 18 | 0.24% |
| JMicron Technology | 18 | 0.24% |
| ASUSTek Computer | 18 | 0.24% |
| DisplayLink | 16 | 0.22% |
| VIA Technologies | 15 | 0.2% |
| Microsoft | 14 | 0.19% |
| MediaTek | 14 | 0.19% |
| Lenovo | 14 | 0.19% |
| Aquantia | 14 | 0.19% |
| Silicon Integrated Systems [SiS] | 13 | 0.18% |
| Qualcomm | 10 | 0.14% |
| Hewlett-Packard | 10 | 0.14% |
| Motorola PCS | 9 | 0.12% |
| Microchip Technology | 7 | 0.09% |
| Linksys | 7 | 0.09% |
| IMC Networks | 6 | 0.08% |
| Edimax Technology | 6 | 0.08% |
| Belkin Components | 6 | 0.08% |
| ZTE WCDMA Technologies MSM | 5 | 0.07% |
| IBM | 5 | 0.07% |
| Fibocom | 4 | 0.05% |
| Attansic Technology | 4 | 0.05% |
| Apple | 4 | 0.05% |
| OPPO Electronics | 3 | 0.04% |
| NetXen Incorporated | 3 | 0.04% |
| InterBiometrics | 3 | 0.04% |
| HMD Global | 3 | 0.04% |
| 3 | 0.04% | |
| Gemtek | 3 | 0.04% |
| AVM | 3 | 0.04% |
| Arduino SA | 3 | 0.04% |
| 3Com | 3 | 0.04% |
| U-Blox | 2 | 0.03% |
| Texas Instruments | 2 | 0.03% |
| T & A Mobile Phones | 2 | 0.03% |
| Sundance Technology Inc / IC Plus | 2 | 0.03% |
| Standard Microsystems | 2 | 0.03% |
| Sitecom Europe | 2 | 0.03% |
| SEGGER | 2 | 0.03% |
| OnePlus Technology (Shenzhen) | 2 | 0.03% |
Net Controller Model
Controller models


| Model | Computers | Percent |
|---|---|---|
| Realtek RTL8111/8168/8411 PCI Express Gigabit Ethernet Controller | 1922 | 22.2% |
| Realtek RTL810xE PCI Express Fast Ethernet controller | 371 | 4.28% |
| Intel Wi-Fi 6 AX200 | 286 | 3.3% |
| Intel 82579LM Gigabit Network Connection (Lewisville) | 220 | 2.54% |
| Qualcomm Atheros QCA9377 802.11ac Wireless Network Adapter | 169 | 1.95% |
| Intel I211 Gigabit Network Connection | 117 | 1.35% |
| Qualcomm Atheros QCA9565 / AR9565 Wireless Network Adapter | 116 | 1.34% |
| Qualcomm Atheros AR9485 Wireless Network Adapter | 115 | 1.33% |
| Realtek RTL8153 Gigabit Ethernet Adapter | 111 | 1.28% |
| Intel Wireless 8265 / 8275 | 106 | 1.22% |
| Intel Wireless 7260 | 97 | 1.12% |
| Qualcomm Atheros AR9285 Wireless Network Adapter (PCI-Express) | 95 | 1.1% |
| Realtek RTL8821CE 802.11ac PCIe Wireless Network Adapter | 93 | 1.07% |
| Qualcomm Atheros QCA6174 802.11ac Wireless Network Adapter | 88 | 1.02% |
| Intel Wireless 7265 | 87 | 1% |
| Intel Centrino Advanced-N 6205 [Taylor Peak] | 86 | 0.99% |
| Intel Comet Lake PCH-LP CNVi WiFi | 85 | 0.98% |
| Intel Ethernet Connection (2) I219-V | 84 | 0.97% |
| Intel Comet Lake PCH CNVi WiFi | 75 | 0.87% |
| Intel Wireless 8260 | 72 | 0.83% |
| Intel Wireless-AC 9560 [Jefferson Peak] | 68 | 0.79% |
| Realtek RTL8723BE PCIe Wireless Network Adapter | 65 | 0.75% |
| Realtek RTL8822CE 802.11ac PCIe Wireless Network Adapter | 62 | 0.72% |
| Realtek RTL8125 2.5GbE Controller | 61 | 0.7% |
| Intel Ethernet Connection I217-LM | 61 | 0.7% |
| Intel Wi-Fi 6 AX201 | 60 | 0.69% |
| Broadcom BCM4313 802.11bgn Wireless Network Adapter | 58 | 0.67% |
| Intel Wireless 3165 | 55 | 0.64% |
| Intel Dual Band Wireless-AC 3168NGW [Stone Peak] | 55 | 0.64% |
| Realtek RTL-8100/8101L/8139 PCI Fast Ethernet Adapter | 52 | 0.6% |
| Intel Cannon Point-LP CNVi [Wireless-AC] | 49 | 0.57% |
| Intel Wireless-AC 9260 | 48 | 0.55% |
| Realtek RTL8822BE 802.11a/b/g/n/ac WiFi adapter | 47 | 0.54% |
| Intel 82579V Gigabit Network Connection | 47 | 0.54% |
| Realtek RTL8188EUS 802.11n Wireless Network Adapter | 40 | 0.46% |
| Intel Ethernet Connection (7) I219-V | 39 | 0.45% |
| Realtek RTL8188CE 802.11b/g/n WiFi Adapter | 38 | 0.44% |
| Ralink MT7601U Wireless Adapter | 37 | 0.43% |
| Qualcomm Atheros AR9462 Wireless Network Adapter | 37 | 0.43% |
| Qualcomm Atheros AR8151 v2.0 Gigabit Ethernet | 37 | 0.43% |
| Qualcomm Atheros AR242x / AR542x Wireless Network Adapter (PCI-Express) | 37 | 0.43% |
| Intel Wireless 3160 | 37 | 0.43% |
| Broadcom BCM43142 802.11b/g/n | 37 | 0.43% |
| Intel PRO/Wireless 3945ABG [Golan] Network Connection | 36 | 0.42% |
| Intel Killer Wi-Fi 6 AX1650i 160MHz Wireless Network Adapter (201NGW) | 36 | 0.42% |
| Intel Ethernet Connection I217-V | 34 | 0.39% |
| Qualcomm Atheros QCA8171 Gigabit Ethernet | 33 | 0.38% |
| Nvidia MCP61 Ethernet | 33 | 0.38% |
| Intel 82577LM Gigabit Network Connection | 31 | 0.36% |
| Qualcomm Atheros AR8121/AR8113/AR8114 Gigabit or Fast Ethernet | 30 | 0.35% |
| Intel Centrino Ultimate-N 6300 | 30 | 0.35% |
| Qualcomm Atheros Killer E220x Gigabit Ethernet Controller | 29 | 0.33% |
| Intel Ethernet Connection I218-LM | 29 | 0.33% |
| Ralink RT3290 Wireless 802.11n 1T/1R PCIe | 28 | 0.32% |
| Intel 82567LM-3 Gigabit Network Connection | 28 | 0.32% |
| Qualcomm Atheros AR8131 Gigabit Ethernet | 27 | 0.31% |
| Intel Ethernet Connection (4) I219-LM | 27 | 0.31% |
| Intel Dual Band Wireless-AC 3165 Plus Bluetooth | 26 | 0.3% |
| Realtek RTL88x2bu [AC1200 Techkey] | 25 | 0.29% |
| Qualcomm Atheros AR9271 802.11n | 25 | 0.29% |
Wireless Vendor
Wireless vendors


| Vendor | Computers | Percent |
|---|---|---|
| Intel | 1612 | 42.65% |
| Qualcomm Atheros | 762 | 20.16% |
| Realtek Semiconductor | 617 | 16.32% |
| Broadcom | 272 | 7.2% |
| Ralink Technology | 96 | 2.54% |
| Ralink | 87 | 2.3% |
| Broadcom Limited | 60 | 1.59% |
| TP-Link | 56 | 1.48% |
| Qualcomm Atheros Communications | 31 | 0.82% |
| D-Link | 24 | 0.63% |
| NetGear | 20 | 0.53% |
| Sierra Wireless | 18 | 0.48% |
| ASUSTek Computer | 18 | 0.48% |
| Dell | 14 | 0.37% |
| Microsoft | 13 | 0.34% |
| D-Link System | 12 | 0.32% |
| MediaTek | 7 | 0.19% |
| Linksys | 6 | 0.16% |
| IMC Networks | 6 | 0.16% |
| Edimax Technology | 6 | 0.16% |
| Belkin Components | 6 | 0.16% |
| Marvell Technology Group | 5 | 0.13% |
| Fibocom | 4 | 0.11% |
| AVM | 3 | 0.08% |
| Texas Instruments | 2 | 0.05% |
| Sitecom Europe | 2 | 0.05% |
| Micro Star International | 2 | 0.05% |
| Mercucys | 2 | 0.05% |
| Hewlett-Packard | 2 | 0.05% |
| BUFFALO | 2 | 0.05% |
| 802.11g Adapter [Linksys WUSB54GC v3] | 2 | 0.05% |
| ZyXEL Communications | 1 | 0.03% |
| Wilocity | 1 | 0.03% |
| Wacom | 1 | 0.03% |
| TRENDnet | 1 | 0.03% |
| PLANEX | 1 | 0.03% |
| Panasonic (Matsushita) | 1 | 0.03% |
| Hawking Technologies | 1 | 0.03% |
| Guillemot | 1 | 0.03% |
| Gemtek | 1 | 0.03% |
| Accton Technology | 1 | 0.03% |
| AboCom Systems | 1 | 0.03% |
Wireless Model
Wireless models


| Model | Computers | Percent |
|---|---|---|
| Intel Wi-Fi 6 AX200 | 286 | 7.51% |
| Qualcomm Atheros QCA9377 802.11ac Wireless Network Adapter | 169 | 4.44% |
| Qualcomm Atheros QCA9565 / AR9565 Wireless Network Adapter | 116 | 3.05% |
| Qualcomm Atheros AR9485 Wireless Network Adapter | 115 | 3.02% |
| Intel Wireless 8265 / 8275 | 106 | 2.78% |
| Intel Wireless 7260 | 97 | 2.55% |
| Qualcomm Atheros AR9285 Wireless Network Adapter (PCI-Express) | 95 | 2.5% |
| Realtek RTL8821CE 802.11ac PCIe Wireless Network Adapter | 93 | 2.44% |
| Qualcomm Atheros QCA6174 802.11ac Wireless Network Adapter | 88 | 2.31% |
| Intel Wireless 7265 | 87 | 2.29% |
| Intel Centrino Advanced-N 6205 [Taylor Peak] | 86 | 2.26% |
| Intel Comet Lake PCH-LP CNVi WiFi | 85 | 2.23% |
| Intel Comet Lake PCH CNVi WiFi | 75 | 1.97% |
| Intel Wireless 8260 | 72 | 1.89% |
| Intel Wireless-AC 9560 [Jefferson Peak] | 68 | 1.79% |
| Realtek RTL8723BE PCIe Wireless Network Adapter | 65 | 1.71% |
| Realtek RTL8822CE 802.11ac PCIe Wireless Network Adapter | 62 | 1.63% |
| Intel Wi-Fi 6 AX201 | 60 | 1.58% |
| Broadcom BCM4313 802.11bgn Wireless Network Adapter | 58 | 1.52% |
| Intel Wireless 3165 | 55 | 1.44% |
| Intel Dual Band Wireless-AC 3168NGW [Stone Peak] | 55 | 1.44% |
| Intel Cannon Point-LP CNVi [Wireless-AC] | 49 | 1.29% |
| Intel Wireless-AC 9260 | 48 | 1.26% |
| Realtek RTL8822BE 802.11a/b/g/n/ac WiFi adapter | 47 | 1.23% |
| Realtek RTL8188EUS 802.11n Wireless Network Adapter | 40 | 1.05% |
| Realtek RTL8188CE 802.11b/g/n WiFi Adapter | 38 | 1% |
| Ralink MT7601U Wireless Adapter | 37 | 0.97% |
| Qualcomm Atheros AR9462 Wireless Network Adapter | 37 | 0.97% |
| Qualcomm Atheros AR242x / AR542x Wireless Network Adapter (PCI-Express) | 37 | 0.97% |
| Intel Wireless 3160 | 37 | 0.97% |
| Broadcom BCM43142 802.11b/g/n | 37 | 0.97% |
| Intel PRO/Wireless 3945ABG [Golan] Network Connection | 36 | 0.95% |
| Intel Killer Wi-Fi 6 AX1650i 160MHz Wireless Network Adapter (201NGW) | 36 | 0.95% |
| Intel Centrino Ultimate-N 6300 | 30 | 0.79% |
| Ralink RT3290 Wireless 802.11n 1T/1R PCIe | 28 | 0.74% |
| Intel Dual Band Wireless-AC 3165 Plus Bluetooth | 26 | 0.68% |
| Realtek RTL88x2bu [AC1200 Techkey] | 25 | 0.66% |
| Qualcomm Atheros AR9271 802.11n | 25 | 0.66% |
| Realtek RTL8188EE Wireless Network Adapter | 24 | 0.63% |
| Qualcomm Atheros AR93xx Wireless Network Adapter | 24 | 0.63% |
| Intel Centrino Advanced-N 6235 | 24 | 0.63% |
| Intel Centrino Advanced-N 6200 | 24 | 0.63% |
| Qualcomm Atheros AR9287 Wireless Network Adapter (PCI-Express) | 23 | 0.6% |
| Realtek 802.11ac NIC | 22 | 0.58% |
| Qualcomm Atheros AR928X Wireless Network Adapter (PCI-Express) | 22 | 0.58% |
| Broadcom BCM4312 802.11b/g LP-PHY | 22 | 0.58% |
| Ralink RT2870/RT3070 Wireless Adapter | 21 | 0.55% |
| Intel WiFi Link 5100 | 21 | 0.55% |
| Intel Centrino Wireless-N 1030 [Rainbow Peak] | 21 | 0.55% |
| Realtek RTL8191SEvB Wireless LAN Controller | 20 | 0.53% |
| Realtek RTL8821AE 802.11ac PCIe Wireless Network Adapter | 19 | 0.5% |
| Realtek RTL8723AE PCIe Wireless Network Adapter | 18 | 0.47% |
| Intel Centrino Wireless-N 2230 | 18 | 0.47% |
| Broadcom BCM43228 802.11a/b/g/n | 18 | 0.47% |
| Broadcom BCM4331 802.11a/b/g/n | 17 | 0.45% |
| Ralink RT5370 Wireless Adapter | 16 | 0.42% |
| Intel PRO/Wireless 5100 AGN [Shiloh] Network Connection | 16 | 0.42% |
| Ralink RT3090 Wireless 802.11n 1T/1R PCIe | 15 | 0.39% |
| Intel PRO/Wireless 4965 AG or AGN [Kedron] Network Connection | 15 | 0.39% |
| Broadcom BCM4360 802.11ac Wireless Network Adapter | 15 | 0.39% |
Ethernet Vendor
Ethernet vendors


| Vendor | Computers | Percent |
|---|---|---|
| Realtek Semiconductor | 2523 | 54.22% |
| Intel | 1144 | 24.59% |
| Qualcomm Atheros | 284 | 6.1% |
| Broadcom | 198 | 4.26% |
| Nvidia | 87 | 1.87% |
| Marvell Technology Group | 80 | 1.72% |
| Broadcom Limited | 47 | 1.01% |
| Samsung Electronics | 32 | 0.69% |
| ASIX Electronics | 29 | 0.62% |
| Xiaomi | 19 | 0.41% |
| JMicron Technology | 18 | 0.39% |
| DisplayLink | 16 | 0.34% |
| VIA Technologies | 15 | 0.32% |
| Huawei Technologies | 15 | 0.32% |
| Aquantia | 14 | 0.3% |
| Silicon Integrated Systems [SiS] | 13 | 0.28% |
| Lenovo | 13 | 0.28% |
| TP-LINK | 12 | 0.26% |
| Qualcomm | 10 | 0.21% |
| D-Link System | 8 | 0.17% |
| MediaTek | 7 | 0.15% |
| Microchip Technology | 5 | 0.11% |
| ZTE WCDMA Technologies MSM | 4 | 0.09% |
| IBM | 4 | 0.09% |
| Attansic Technology | 4 | 0.09% |
| Apple | 4 | 0.09% |
| OPPO Electronics | 3 | 0.06% |
| NetXen Incorporated | 3 | 0.06% |
| Motorola PCS | 3 | 0.06% |
| HMD Global | 3 | 0.06% |
| 3 | 0.06% | |
| 3Com | 3 | 0.06% |
| Sundance Technology Inc / IC Plus | 2 | 0.04% |
| Standard Microsystems | 2 | 0.04% |
| OnePlus Technology (Shenzhen) | 2 | 0.04% |
| Mellanox Technologies | 2 | 0.04% |
| ICS Advent | 2 | 0.04% |
| Hewlett-Packard | 2 | 0.04% |
| Gemtek | 2 | 0.04% |
| Tehuti Networks | 1 | 0.02% |
| T & A Mobile Phones | 1 | 0.02% |
| QinHeng Electronics | 1 | 0.02% |
| NetGear | 1 | 0.02% |
| Microsoft | 1 | 0.02% |
| LSI | 1 | 0.02% |
| Linksys | 1 | 0.02% |
| HTC (High Tech Computer) | 1 | 0.02% |
| GCT Semiconductor | 1 | 0.02% |
| Emulex | 1 | 0.02% |
| Digitech Systems | 1 | 0.02% |
| D-Link | 1 | 0.02% |
| Broadcom Inc. and subsidiaries | 1 | 0.02% |
| Android | 1 | 0.02% |
| American Megatrends | 1 | 0.02% |
| Accton Technology | 1 | 0.02% |
Ethernet Model
Ethernet models


| Model | Computers | Percent |
|---|---|---|
| Realtek RTL8111/8168/8411 PCI Express Gigabit Ethernet Controller | 1922 | 40.41% |
| Realtek RTL810xE PCI Express Fast Ethernet controller | 371 | 7.8% |
| Intel 82579LM Gigabit Network Connection (Lewisville) | 220 | 4.63% |
| Intel I211 Gigabit Network Connection | 117 | 2.46% |
| Realtek RTL8153 Gigabit Ethernet Adapter | 111 | 2.33% |
| Intel Ethernet Connection (2) I219-V | 84 | 1.77% |
| Realtek RTL8125 2.5GbE Controller | 61 | 1.28% |
| Intel Ethernet Connection I217-LM | 61 | 1.28% |
| Realtek RTL-8100/8101L/8139 PCI Fast Ethernet Adapter | 52 | 1.09% |
| Intel 82579V Gigabit Network Connection | 47 | 0.99% |
| Intel Ethernet Connection (7) I219-V | 39 | 0.82% |
| Qualcomm Atheros AR8151 v2.0 Gigabit Ethernet | 37 | 0.78% |
| Intel Ethernet Connection I217-V | 34 | 0.71% |
| Qualcomm Atheros QCA8171 Gigabit Ethernet | 33 | 0.69% |
| Nvidia MCP61 Ethernet | 33 | 0.69% |
| Intel 82577LM Gigabit Network Connection | 31 | 0.65% |
| Qualcomm Atheros AR8121/AR8113/AR8114 Gigabit or Fast Ethernet | 30 | 0.63% |
| Qualcomm Atheros Killer E220x Gigabit Ethernet Controller | 29 | 0.61% |
| Intel Ethernet Connection I218-LM | 29 | 0.61% |
| Intel 82567LM-3 Gigabit Network Connection | 28 | 0.59% |
| Qualcomm Atheros AR8131 Gigabit Ethernet | 27 | 0.57% |
| Intel Ethernet Connection (4) I219-LM | 27 | 0.57% |
| Qualcomm Atheros AR8161 Gigabit Ethernet | 25 | 0.53% |
| Intel Ethernet Connection (3) I218-LM | 25 | 0.53% |
| Intel Ethernet Connection (2) I219-LM | 25 | 0.53% |
| Broadcom NetXtreme BCM57765 Gigabit Ethernet PCIe | 24 | 0.5% |
| Samsung Galaxy series, misc. (tethering mode) | 23 | 0.48% |
| Intel Ethernet Connection I219-LM | 23 | 0.48% |
| Intel Ethernet Connection (10) I219-V | 23 | 0.48% |
| Broadcom NetLink BCM57785 Gigabit Ethernet PCIe | 23 | 0.48% |
| Intel I210 Gigabit Network Connection | 22 | 0.46% |
| Intel Ethernet Connection (7) I219-LM | 22 | 0.46% |
| Intel Ethernet Connection (6) I219-V | 21 | 0.44% |
| Intel 82574L Gigabit Network Connection | 21 | 0.44% |
| Qualcomm Atheros AR8152 v2.0 Fast Ethernet | 20 | 0.42% |
| Intel Ethernet Connection (4) I219-V | 20 | 0.42% |
| Intel 82567LM Gigabit Network Connection | 20 | 0.42% |
| Qualcomm Atheros Killer E2500 Gigabit Ethernet Controller | 19 | 0.4% |
| ASIX AX88179 Gigabit Ethernet | 19 | 0.4% |
| Intel Ethernet Controller I225-V | 18 | 0.38% |
| Intel Ethernet Connection (2) I218-V | 18 | 0.38% |
| Broadcom NetXtreme BCM5761 Gigabit Ethernet PCIe | 18 | 0.38% |
| Marvell Group 88E8056 PCI-E Gigabit Ethernet Controller | 17 | 0.36% |
| Intel 82566DM-2 Gigabit Network Connection | 17 | 0.36% |
| Broadcom NetXtreme BCM57766 Gigabit Ethernet PCIe | 17 | 0.36% |
| Xiaomi Mi/Redmi series (RNDIS) | 16 | 0.34% |
| Qualcomm Atheros QCA8172 Fast Ethernet | 16 | 0.34% |
| Realtek RTL8169 PCI Gigabit Ethernet Controller | 15 | 0.32% |
| JMicron JMC250 PCI Express Gigabit Ethernet Controller | 15 | 0.32% |
| Nvidia MCP79 Ethernet | 14 | 0.29% |
| Marvell Group 88E8040 PCI-E Fast Ethernet Controller | 14 | 0.29% |
| Nvidia MCP77 Ethernet | 13 | 0.27% |
| VIA VT6102/VT6103 [Rhine-II] | 12 | 0.25% |
| Silicon Integrated Systems [SiS] 191 Gigabit Ethernet Adapter | 12 | 0.25% |
| Qualcomm Atheros AR8132 Fast Ethernet | 12 | 0.25% |
| Intel Ethernet Connection I219-V | 12 | 0.25% |
| Intel 82578DM Gigabit Network Connection | 11 | 0.23% |
| Broadcom NetXtreme BCM5764M Gigabit Ethernet PCIe | 11 | 0.23% |
| Broadcom NetLink BCM5787M Gigabit Ethernet PCI Express | 11 | 0.23% |
| TP-Link UE300 10/100/1000 LAN (ethernet mode) [Realtek RTL8153] | 10 | 0.21% |
Net Controller Kind
Ethernet, WiFi or modem


| Kind | Computers | Percent |
|---|---|---|
| Ethernet | 4394 | 54.33% |
| WiFi | 3598 | 44.49% |
| Modem | 81 | 1% |
| Unknown | 14 | 0.17% |
Used Controller
Currently used network controller


| Kind | Computers | Percent |
|---|---|---|
| Ethernet | 3052 | 50.74% |
| WiFi | 2956 | 49.14% |
| Modem | 6 | 0.1% |
| Unknown | 1 | 0.02% |
NICs
Total network controllers on board


| Total | Computers | Percent |
|---|---|---|
| 2 | 2711 | 54.85% |
| 1 | 1957 | 39.59% |
| 0 | 132 | 2.67% |
| 3 | 106 | 2.14% |
| 4 | 25 | 0.51% |
| 5 | 4 | 0.08% |
| 8 | 3 | 0.06% |
| 6 | 2 | 0.04% |
| 132 | 1 | 0.02% |
| 11 | 1 | 0.02% |
| 7 | 1 | 0.02% |
IPv6
IPv6 vs IPv4


| Used | Computers | Percent |
|---|---|---|
| No | 3717 | 75.2% |
| Yes | 1226 | 24.8% |
Memory Vendor
Memory module vendors


| Vendor | Computers | Percent |
|---|---|---|
| Samsung Electronics | 610 | 20.76% |
| SK Hynix | 484 | 16.47% |
| Unknown | 404 | 13.75% |
| Kingston | 382 | 13% |
| Micron Technology | 227 | 7.72% |
| Crucial | 174 | 5.92% |
| Corsair | 155 | 5.27% |
| G.Skill | 95 | 3.23% |
| A-DATA Technology | 63 | 2.14% |
| Elpida | 47 | 1.6% |
| Ramaxel Technology | 43 | 1.46% |
| Nanya Technology | 34 | 1.16% |
| Team | 24 | 0.82% |
| Patriot | 22 | 0.75% |
| AMD | 15 | 0.51% |
| GOODRAM | 14 | 0.48% |
| Transcend | 10 | 0.34% |
| Unknown (ABCD) | 9 | 0.31% |
| Apacer | 9 | 0.31% |
| Toshiba | 7 | 0.24% |
| Qimonda | 7 | 0.24% |
| CSX | 7 | 0.24% |
| Smart | 6 | 0.2% |
| Teikon | 4 | 0.14% |
| Silicon Power | 4 | 0.14% |
| Goldkey | 4 | 0.14% |
| ASint Technology | 4 | 0.14% |
| SMART Brazil | 3 | 0.1% |
| PNY | 3 | 0.1% |
| Kllisre | 3 | 0.1% |
| High Bridge | 3 | 0.1% |
| 48spaces | 3 | 0.1% |
| Unknown (08AE) | 2 | 0.07% |
| Unifosa | 2 | 0.07% |
| SHARETRONIC | 2 | 0.07% |
| S | 2 | 0.07% |
| Qumo | 2 | 0.07% |
| Neo Forza | 2 | 0.07% |
| Multilaser | 2 | 0.07% |
| Kingmax | 2 | 0.07% |
| Hewlett-Packard | 2 | 0.07% |
| Foxline | 2 | 0.07% |
| Avant | 2 | 0.07% |
| Unknown (CD04) | 1 | 0.03% |
| Unknown (8C97) | 1 | 0.03% |
| Unknown (0x8C26) | 1 | 0.03% |
| Unknown (0x8551) | 1 | 0.03% |
| Unknown (0x801) | 1 | 0.03% |
| Unknown (0x29E) | 1 | 0.03% |
| Unknown (0B89) | 1 | 0.03% |
| Unknown (09DF) | 1 | 0.03% |
| Unknown (090D) | 1 | 0.03% |
| Unknown (07FB) | 1 | 0.03% |
| Unknown (02B5) | 1 | 0.03% |
| Unknown (00C2) | 1 | 0.03% |
| Unknown (000000000CE80) | 1 | 0.03% |
| Unknown (000000000000947F) | 1 | 0.03% |
| Toshiba-0098 | 1 | 0.03% |
| Thermaltake | 1 | 0.03% |
| Swissbit | 1 | 0.03% |
Memory Model
Memory module models


| Model | Computers | Percent |
|---|---|---|
| Samsung RAM M471B5273DH0-CH9 4GB SODIMM DDR3 1334MT/s | 29 | 0.91% |
| Samsung RAM M471B5273CH0-CH9 4GB SODIMM DDR3 1334MT/s | 24 | 0.75% |
| SK Hynix RAM HMT451S6BFR8A-PB 4096MB SODIMM DDR3 1600MT/s | 23 | 0.72% |
| Samsung RAM M471A5244CB0-CRC 4096MB SODIMM DDR4 2667MT/s | 23 | 0.72% |
| Samsung RAM M471A1K43DB1-CWE 8192MB SODIMM DDR4 3200MT/s | 22 | 0.69% |
| SK Hynix RAM HMT41GS6BFR8A-PB 8GB SODIMM DDR3 1600MT/s | 20 | 0.63% |
| Samsung RAM M471A5244CB0-CTD 4GB SODIMM DDR4 2667MT/s | 20 | 0.63% |
| Corsair RAM CMK16GX4M2B3200C16 8GB DIMM DDR4 3266MT/s | 20 | 0.63% |
| Samsung RAM M471B5173EB0-YK0 4GB SODIMM DDR3 1600MT/s | 19 | 0.59% |
| Samsung RAM M471B5173DB0-YK0 4GB SODIMM DDR3 1600MT/s | 19 | 0.59% |
| Samsung RAM M471B5173QH0-YK0 4096MB SODIMM DDR3 1600MT/s | 18 | 0.56% |
| SK Hynix RAM HMA81GS6AFR8N-UH 8192MB SODIMM DDR4 2667MT/s | 17 | 0.53% |
| Samsung RAM M471A1K43CB1-CTD 8192MB SODIMM DDR4 2667MT/s | 17 | 0.53% |
| Unknown RAM Module 2048MB DIMM DDR2 800MT/s | 15 | 0.47% |
| SK Hynix RAM HMA851S6CJR6N-VK 4096MB SODIMM DDR4 2667MT/s | 15 | 0.47% |
| SK Hynix RAM HMT351S6CFR8C-PB 4096MB SODIMM DDR3 1600MT/s | 13 | 0.41% |
| Samsung RAM M471A1K43DB1-CTD 8GB SODIMM DDR4 2667MT/s | 13 | 0.41% |
| Samsung RAM M471A1G44AB0-CWE 8GB SODIMM DDR4 3200MT/s | 13 | 0.41% |
| Unknown RAM Module 2048MB DIMM 800MT/s | 12 | 0.38% |
| SK Hynix RAM HMA851S6AFR6N-UH 4GB SODIMM DDR4 2667MT/s | 12 | 0.38% |
| SK Hynix RAM HMT451S6AFR8A-PB 4GB SODIMM DDR3 1600MT/s | 11 | 0.34% |
| Samsung RAM M471B1G73DB0-YK0 8192MB SODIMM DDR3 1600MT/s | 11 | 0.34% |
| Samsung RAM M471A2K43DB1-CWE 16384MB SODIMM DDR4 3200MT/s | 11 | 0.34% |
| SK Hynix RAM HMT351S6BFR8C-H9 4GB SODIMM DDR3 1333MT/s | 10 | 0.31% |
| SK Hynix RAM HMA81GS6CJR8N-VK 8192MB SODIMM DDR4 2667MT/s | 10 | 0.31% |
| Samsung RAM M471A1K43BB1-CRC 8GB SODIMM DDR4 2667MT/s | 10 | 0.31% |
| Micron RAM 8ATF1G64HZ-3G2J1 8GB SODIMM DDR4 3200MT/s | 10 | 0.31% |
| Micron RAM 8ATF1G64HZ-2G6E1 8GB SODIMM DDR4 2667MT/s | 10 | 0.31% |
| Kingston RAM KHX1600C10D3/8G 4096MB DIMM DDR3 1867MT/s | 10 | 0.31% |
| Unknown RAM Module 4GB DIMM DDR3 1333MT/s | 9 | 0.28% |
| Unknown RAM Module 2048MB DIMM SDRAM | 9 | 0.28% |
| SK Hynix RAM HMA82GS6AFR8N-UH 16GB SODIMM DDR4 2400MT/s | 9 | 0.28% |
| Samsung RAM M471B5273DH0-CK0 4GB SODIMM DDR3 1600MT/s | 9 | 0.28% |
| Micron RAM 4ATF51264HZ-2G6E1 4096MB SODIMM DDR4 2667MT/s | 9 | 0.28% |
| Micron RAM 4ATF1G64HZ-3G2E1 8192MB SODIMM DDR4 3200MT/s | 9 | 0.28% |
| Kingston RAM KHX3200C16D4/8GX 8GB DIMM DDR4 3533MT/s | 9 | 0.28% |
| Kingston RAM KHX2666C16/8G 8GB DIMM DDR4 3200MT/s | 9 | 0.28% |
| Crucial RAM CT102464BF160B.C16 8GB SODIMM DDR3 1600MT/s | 9 | 0.28% |
| Unknown RAM Module 2GB DIMM 1333MT/s | 8 | 0.25% |
| SK Hynix RAM HMA81GS6DJR8N-XN 8GB SODIMM DDR4 3200MT/s | 8 | 0.25% |
| Samsung RAM M471A1K43CB1-CRC 8GB SODIMM DDR4 2667MT/s | 8 | 0.25% |
| Samsung RAM M471A1G44AB0-CWE 8GB Row Of Chips DDR4 3200MT/s | 8 | 0.25% |
| Kingston RAM KHX1866C10D3/8G 8GB DIMM DDR3 2133MT/s | 8 | 0.25% |
| Kingston RAM 99U5428-018.A00LF 8GB SODIMM DDR3 1600MT/s | 8 | 0.25% |
| Unknown RAM Module 8GB SODIMM DDR3 1600MT/s | 7 | 0.22% |
| Unknown RAM Module 4096MB DIMM 1333MT/s | 7 | 0.22% |
| Unknown (ABCD) RAM 123456789012345678 2GB SODIMM LPDDR4 2400MT/s | 7 | 0.22% |
| SK Hynix RAM HMT451S6MFR8C-PB 4GB SODIMM DDR3 1600MT/s | 7 | 0.22% |
| SK Hynix RAM HMA851S6CJR6N-VK 4GB Row Of Chips DDR4 2667MT/s | 7 | 0.22% |
| SK Hynix RAM HMA82GS6CJR8N-VK 16384MB SODIMM DDR4 2667MT/s | 7 | 0.22% |
| SK Hynix RAM HMA81GS6JJR8N-VK 8GB SODIMM DDR4 2667MT/s | 7 | 0.22% |
| Samsung RAM M471B5273CH0-CK0 4096MB SODIMM DDR3 1600MT/s | 7 | 0.22% |
| Samsung RAM M471A5244CB0-CWE 4096MB SODIMM DDR4 3200MT/s | 7 | 0.22% |
| Samsung RAM M471A2K43DB1-CTD 16384MB SODIMM DDR4 2667MT/s | 7 | 0.22% |
| Samsung RAM M471A2K43CB1-CRC 16384MB SODIMM DDR4 2667MT/s | 7 | 0.22% |
| Nanya RAM NT2GC64B88B0NS-CG 2GB SODIMM DDR3 1334MT/s | 7 | 0.22% |
| Micron RAM 4ATF51264HZ-3G2J1 4096MB SODIMM DDR4 3200MT/s | 7 | 0.22% |
| Kingston RAM KHX1600C9D3/4GX 4096MB DIMM DDR3 2400MT/s | 7 | 0.22% |
| G.Skill RAM F4-3200C16-8GVKB 8GB DIMM DDR4 3200MT/s | 7 | 0.22% |
| G.Skill RAM F4-3200C16-16GVK 16GB DIMM DDR4 3600MT/s | 7 | 0.22% |
Memory Kind
Memory module kinds


| Kind | Computers | Percent |
|---|---|---|
| DDR4 | 1072 | 41.73% |
| DDR3 | 984 | 38.3% |
| DDR2 | 172 | 6.7% |
| Unknown | 109 | 4.24% |
| SDRAM | 75 | 2.92% |
| LPDDR3 | 60 | 2.34% |
| LPDDR4 | 58 | 2.26% |
| DDR | 29 | 1.13% |
| DRAM | 9 | 0.35% |
| RAM | 1 | 0.04% |
Memory Form Factor
Physical design of the memory module


| Name | Computers | Percent |
|---|---|---|
| SODIMM | 1380 | 54.33% |
| DIMM | 1028 | 40.47% |
| Row Of Chips | 112 | 4.41% |
| Chip | 14 | 0.55% |
| Unknown | 3 | 0.12% |
| FB-DIMM | 2 | 0.08% |
| RIMM | 1 | 0.04% |
Memory Size
Memory module size


| Size | Computers | Percent |
|---|---|---|
| 8192 | 923 | 32.98% |
| 4096 | 877 | 31.33% |
| 2048 | 470 | 16.79% |
| 16384 | 307 | 10.97% |
| 1024 | 138 | 4.93% |
| 32768 | 52 | 1.86% |
| 512 | 20 | 0.71% |
| 256 | 6 | 0.21% |
| 65536 | 2 | 0.07% |
| 16 | 2 | 0.07% |
| 32767 | 1 | 0.04% |
| Unknown | 1 | 0.04% |
Memory Speed
Memory module speed


| Speed | Computers | Percent |
|---|---|---|
| 1600 | 613 | 21.94% |
| 2667 | 362 | 12.96% |
| 3200 | 312 | 11.17% |
| 1333 | 264 | 9.45% |
| 2400 | 221 | 7.91% |
| 2133 | 151 | 5.4% |
| 667 | 106 | 3.79% |
| 1334 | 97 | 3.47% |
| 800 | 96 | 3.44% |
| Unknown | 72 | 2.58% |
| 1067 | 47 | 1.68% |
| 1867 | 45 | 1.61% |
| 3600 | 40 | 1.43% |
| 1066 | 38 | 1.36% |
| 2933 | 26 | 0.93% |
| 2666 | 26 | 0.93% |
| 4267 | 25 | 0.89% |
| 3000 | 22 | 0.79% |
| 3266 | 20 | 0.72% |
| 1866 | 20 | 0.72% |
| 400 | 17 | 0.61% |
| 4199 | 15 | 0.54% |
| 2048 | 15 | 0.54% |
| 533 | 13 | 0.47% |
| 3533 | 9 | 0.32% |
| 3466 | 9 | 0.32% |
| 1800 | 9 | 0.32% |
| 975 | 9 | 0.32% |
| 2800 | 8 | 0.29% |
| 3733 | 6 | 0.21% |
| 3334 | 6 | 0.21% |
| 333 | 6 | 0.21% |
| 4266 | 5 | 0.18% |
| 3400 | 5 | 0.18% |
| 3066 | 5 | 0.18% |
| 3800 | 4 | 0.14% |
| 3666 | 4 | 0.14% |
| 2000 | 4 | 0.14% |
| 1639 | 4 | 0.14% |
| 4333 | 3 | 0.11% |
| 3500 | 3 | 0.11% |
| 2733 | 3 | 0.11% |
| 2200 | 3 | 0.11% |
| 1648 | 3 | 0.11% |
| 4000 | 2 | 0.07% |
| 3100 | 2 | 0.07% |
| 2465 | 2 | 0.07% |
| 200 | 2 | 0.07% |
| 49926 | 1 | 0.04% |
| 41632 | 1 | 0.04% |
| 3333 | 1 | 0.04% |
| 3007 | 1 | 0.04% |
| 2802 | 1 | 0.04% |
| 2448 | 1 | 0.04% |
| 2176 | 1 | 0.04% |
| 2134 | 1 | 0.04% |
| 1777 | 1 | 0.04% |
| 1776 | 1 | 0.04% |
| 1400 | 1 | 0.04% |
| 1332 | 1 | 0.04% |
Sound Vendor
Sound card vendors


| Vendor | Computers | Percent |
|---|---|---|
| Intel | 3452 | 51.2% |
| AMD | 1440 | 21.36% |
| Nvidia | 1200 | 17.8% |
| C-Media Electronics | 118 | 1.75% |
| Creative Labs | 55 | 0.82% |
| Logitech | 48 | 0.71% |
| Texas Instruments | 23 | 0.34% |
| Realtek Semiconductor | 22 | 0.33% |
| VIA Technologies | 21 | 0.31% |
| Plantronics | 18 | 0.27% |
| JMTek | 18 | 0.27% |
| Kingston Technology | 17 | 0.25% |
| Generalplus Technology | 17 | 0.25% |
| Creative Technology | 17 | 0.25% |
| Razer USA | 15 | 0.22% |
| GN Netcom | 14 | 0.21% |
| Focusrite-Novation | 14 | 0.21% |
| Silicon Integrated Systems [SiS] | 13 | 0.19% |
| Lenovo | 11 | 0.16% |
| SteelSeries ApS | 8 | 0.12% |
| Dell | 8 | 0.12% |
| Sennheiser Communications | 7 | 0.1% |
| Samson Technologies | 7 | 0.1% |
| Blue Microphones | 7 | 0.1% |
| M-Audio | 6 | 0.09% |
| Hewlett-Packard | 6 | 0.09% |
| Corsair | 6 | 0.09% |
| Apple | 6 | 0.09% |
| Yamaha | 5 | 0.07% |
| XMOS | 5 | 0.07% |
| RODE Microphones | 5 | 0.07% |
| BEHRINGER International | 5 | 0.07% |
| ASUSTek Computer | 5 | 0.07% |
| Asahi Kasei Microsystems | 5 | 0.07% |
| SAVITECH | 4 | 0.06% |
| Astro Gaming | 4 | 0.06% |
| ZOOM | 3 | 0.04% |
| Tenx Technology | 3 | 0.04% |
| Syntek | 3 | 0.04% |
| Native Instruments | 3 | 0.04% |
| GYROCOM C&C | 3 | 0.04% |
| Cambridge Silicon Radio | 3 | 0.04% |
| Bose | 3 | 0.04% |
| Valve Software | 2 | 0.03% |
| Unknown | 2 | 0.03% |
| Turtle Beach | 2 | 0.03% |
| Thesycon Systemsoftware & Consulting | 2 | 0.03% |
| Shenzhen Riitek Technology | 2 | 0.03% |
| PreSonus Audio Electronics | 2 | 0.03% |
| Panasonic (Matsushita) | 2 | 0.03% |
| ONN | 2 | 0.03% |
| Microdia | 2 | 0.03% |
| Licensed by Sony Computer Entertainment America | 2 | 0.03% |
| Giga-Byte Technology | 2 | 0.03% |
| Fry's Electronics | 2 | 0.03% |
| Ensoniq | 2 | 0.03% |
| BY EDIFIER | 2 | 0.03% |
| Audio-Technica | 2 | 0.03% |
| Alesis | 2 | 0.03% |
| AKAI Professional M.I. | 2 | 0.03% |
Sound Model
Sound card models


| Model | Computers | Percent |
|---|---|---|
| Intel 6 Series/C200 Series Chipset Family High Definition Audio Controller | 397 | 4.97% |
| Intel 7 Series/C216 Chipset Family High Definition Audio Controller | 352 | 4.41% |
| Intel Sunrise Point-LP HD Audio | 344 | 4.31% |
| AMD Family 17h (Models 10h-1fh) HD Audio Controller | 343 | 4.3% |
| Intel 8 Series/C220 Series Chipset High Definition Audio Controller | 256 | 3.21% |
| AMD SBx00 Azalia (Intel HDA) | 209 | 2.62% |
| AMD Starship/Matisse HD Audio Controller | 199 | 2.49% |
| Intel Xeon E3-1200 v3/4th Gen Core Processor HD Audio Controller | 190 | 2.38% |
| Intel Cannon Lake PCH cAVS | 188 | 2.36% |
| AMD Raven/Raven2/Fenghuang HDMI/DP Audio Controller | 184 | 2.31% |
| Intel NM10/ICH7 Family High Definition Audio Controller | 177 | 2.22% |
| AMD FCH Azalia Controller | 177 | 2.22% |
| Intel 5 Series/3400 Series Chipset High Definition Audio | 162 | 2.03% |
| Intel 82801I (ICH9 Family) HD Audio Controller | 160 | 2% |
| AMD Family 17h (Models 00h-0fh) HD Audio Controller | 127 | 1.59% |
| Intel Haswell-ULT HD Audio Controller | 126 | 1.58% |
| Intel 8 Series HD Audio Controller | 126 | 1.58% |
| Intel 100 Series/C230 Series Chipset Family HD Audio Controller | 126 | 1.58% |
| AMD Renoir Radeon High Definition Audio Controller | 117 | 1.47% |
| Intel Comet Lake PCH-LP cAVS | 116 | 1.45% |
| Nvidia GF108 High Definition Audio Controller | 108 | 1.35% |
| Nvidia GK208 HDMI/DP Audio Controller | 105 | 1.32% |
| AMD Ellesmere HDMI Audio [Radeon RX 470/480 / 570/580/590] | 104 | 1.3% |
| Intel 200 Series PCH HD Audio | 101 | 1.27% |
| Intel Cannon Point-LP High Definition Audio Controller | 98 | 1.23% |
| Intel Comet Lake PCH cAVS | 97 | 1.22% |
| Nvidia GP107GL High Definition Audio Controller | 95 | 1.19% |
| Intel Wildcat Point-LP High Definition Audio Controller | 90 | 1.13% |
| Intel Broadwell-U Audio Controller | 90 | 1.13% |
| AMD Kabini HDMI/DP Audio | 82 | 1.03% |
| Intel 82801H (ICH8 Family) HD Audio Controller | 78 | 0.98% |
| Nvidia TU106 High Definition Audio Controller | 75 | 0.94% |
| Nvidia TU116 High Definition Audio Controller | 72 | 0.9% |
| Intel Tiger Lake-LP Smart Sound Technology Audio Controller | 67 | 0.84% |
| Nvidia TU107 GeForce GTX 1650 High Definition Audio Controller | 66 | 0.83% |
| AMD Oland/Hainan/Cape Verde/Pitcairn HDMI Audio [Radeon HD 7000 Series] | 62 | 0.78% |
| AMD Family 15h (Models 60h-6fh) Audio Controller | 61 | 0.76% |
| Nvidia GP104 High Definition Audio Controller | 58 | 0.73% |
| Intel Celeron/Pentium Silver Processor High Definition Audio | 58 | 0.73% |
| Intel 82801JI (ICH10 Family) HD Audio Controller | 58 | 0.73% |
| Nvidia GP106 High Definition Audio Controller | 57 | 0.71% |
| Nvidia GM107 High Definition Audio Controller [GeForce 940MX] | 57 | 0.71% |
| Intel Ice Lake-LP Smart Sound Technology Audio Controller | 57 | 0.71% |
| Nvidia High Definition Audio Controller | 55 | 0.69% |
| Intel CM238 HD Audio Controller | 48 | 0.6% |
| AMD Trinity HDMI Audio Controller | 47 | 0.59% |
| AMD Baffin HDMI/DP Audio [Radeon RX 550 640SP / RX 560/560X] | 47 | 0.59% |
| AMD Cedar HDMI Audio [Radeon HD 5400/6300/7300 Series] | 46 | 0.58% |
| Intel Atom Processor Z36xxx/Z37xxx Series High Definition Audio Controller | 43 | 0.54% |
| AMD Navi 10 HDMI Audio | 43 | 0.54% |
| Nvidia GF119 HDMI Audio Controller | 42 | 0.53% |
| Nvidia GK107 HDMI Audio Controller | 41 | 0.51% |
| Nvidia MCP61 High Definition Audio | 40 | 0.5% |
| Intel 9 Series Chipset Family HD Audio Controller | 40 | 0.5% |
| Intel Atom/Celeron/Pentium Processor x5-E8000/J3xxx/N3xxx Series High Definition Audio Controller | 39 | 0.49% |
| AMD High Definition Audio Controller | 36 | 0.45% |
| AMD Caicos HDMI Audio [Radeon HD 6450 / 7450/8450/8490 OEM / R5 230/235/235X OEM] | 36 | 0.45% |
| Intel Celeron N3350/Pentium N4200/Atom E3900 Series Audio Cluster | 35 | 0.44% |
| Nvidia GM204 High Definition Audio Controller | 34 | 0.43% |
| Nvidia GM206 High Definition Audio Controller | 33 | 0.41% |
Camera Vendor
Camera device vendors


| Vendor | Computers | Percent |
|---|---|---|
| Chicony Electronics | 637 | 22.61% |
| IMC Networks | 247 | 8.77% |
| Microdia | 237 | 8.41% |
| Realtek Semiconductor | 231 | 8.2% |
| Acer | 208 | 7.38% |
| Logitech | 159 | 5.64% |
| Sunplus Innovation Technology | 139 | 4.93% |
| Quanta | 125 | 4.44% |
| Cheng Uei Precision Industry (Foxlink) | 95 | 3.37% |
| Suyin | 84 | 2.98% |
| Syntek | 80 | 2.84% |
| Apple | 72 | 2.56% |
| Lite-On Technology | 60 | 2.13% |
| Silicon Motion | 49 | 1.74% |
| Alcor Micro | 43 | 1.53% |
| Ricoh | 36 | 1.28% |
| Microsoft | 32 | 1.14% |
| Samsung Electronics | 30 | 1.06% |
| Z-Star Microelectronics | 27 | 0.96% |
| Luxvisions Innotech Limited | 19 | 0.67% |
| Lenovo | 13 | 0.46% |
| KYE Systems (Mouse Systems) | 12 | 0.43% |
| Generalplus Technology | 12 | 0.43% |
| ALi | 11 | 0.39% |
| ARC International | 10 | 0.35% |
| Primax Electronics | 9 | 0.32% |
| Genesys Logic | 9 | 0.32% |
| Creative Technology | 9 | 0.32% |
| Importek | 8 | 0.28% |
| Aveo Technology | 7 | 0.25% |
| Sonix Technology | 6 | 0.21% |
| Jieli Technology | 6 | 0.21% |
| GEMBIRD | 6 | 0.21% |
| Trust | 5 | 0.18% |
| Pixart Imaging | 5 | 0.18% |
| Huawei Technologies | 5 | 0.18% |
| Arkmicro Technologies | 5 | 0.18% |
| Intel | 4 | 0.14% |
| DigiTech | 4 | 0.14% |
| A4Tech | 4 | 0.14% |
| Unknown | 3 | 0.11% |
| OmniVision Technologies | 3 | 0.11% |
| MacroSilicon | 3 | 0.11% |
| LG Electronics | 3 | 0.11% |
| Cubeternet | 3 | 0.11% |
| Xiongmai | 2 | 0.07% |
| WCM_USB | 2 | 0.07% |
| Valve Software | 2 | 0.07% |
| Tobii Technology AB | 2 | 0.07% |
| SunplusIT | 2 | 0.07% |
| SHENZHEN EMEET TECHNOLOGY | 2 | 0.07% |
| Novatek Microelectronics | 2 | 0.07% |
| Hewlett-Packard | 2 | 0.07% |
| HD WEBCAM | 2 | 0.07% |
| DJHAAA29IE6391 | 2 | 0.07% |
| AVerMedia Technologies | 2 | 0.07% |
| Y Media | 1 | 0.04% |
| USB3.0 HD Audio Capture | 1 | 0.04% |
| Telmax Communications | 1 | 0.04% |
| Sweex | 1 | 0.04% |
Camera Model
Camera device models


| Model | Computers | Percent |
|---|---|---|
| Chicony Integrated Camera | 119 | 4.2% |
| Realtek Integrated_Webcam_HD | 105 | 3.71% |
| Microdia Integrated_Webcam_HD | 90 | 3.18% |
| IMC Networks Integrated Camera | 62 | 2.19% |
| IMC Networks USB2.0 HD UVC WebCam | 59 | 2.08% |
| Chicony HD WebCam | 55 | 1.94% |
| Acer Integrated Camera | 50 | 1.77% |
| Syntek Integrated Camera | 42 | 1.48% |
| Sunplus Integrated_Webcam_HD | 40 | 1.41% |
| Logitech Webcam C270 | 39 | 1.38% |
| Acer Lenovo EasyCamera | 38 | 1.34% |
| IMC Networks USB2.0 VGA UVC WebCam | 37 | 1.31% |
| Samsung Galaxy A5 (MTP) | 30 | 1.06% |
| Quanta VGA WebCam | 27 | 0.95% |
| Logitech HD Pro Webcam C920 | 27 | 0.95% |
| Chicony USB2.0 Camera | 26 | 0.92% |
| Microdia Integrated Webcam | 25 | 0.88% |
| Chicony HP HD Camera | 25 | 0.88% |
| Chicony EasyCamera | 25 | 0.88% |
| Sunplus HD WebCam | 24 | 0.85% |
| Chicony HP Truevision HD | 24 | 0.85% |
| Chicony USB 2.0 Camera | 23 | 0.81% |
| Apple FaceTime HD Camera (Built-in) | 22 | 0.78% |
| Lite-On Integrated Camera | 21 | 0.74% |
| Chicony USB2.0 HD UVC WebCam | 21 | 0.74% |
| Chicony USB2.0 VGA UVC WebCam | 20 | 0.71% |
| Quanta HP TrueVision HD Camera | 19 | 0.67% |
| Quanta HD User Facing | 19 | 0.67% |
| Chicony VGA WebCam | 19 | 0.67% |
| Chicony Integrated Camera (1280x720@30) | 19 | 0.67% |
| Realtek USB Camera | 18 | 0.64% |
| Microdia Webcam Vitade AF | 17 | 0.6% |
| Chicony HD User Facing | 17 | 0.6% |
| Acer EasyCamera | 17 | 0.6% |
| Syntek Lenovo EasyCamera | 16 | 0.56% |
| Chicony HP Truevision HD camera | 16 | 0.56% |
| Acer SunplusIT Integrated Camera | 16 | 0.56% |
| Apple Built-in iSight | 15 | 0.53% |
| Realtek Integrated Webcam | 14 | 0.49% |
| Chicony TOSHIBA Web Camera - HD | 14 | 0.49% |
| Apple iPhone 5/5C/5S/6/SE | 14 | 0.49% |
| Microdia Laptop_Integrated_Webcam_HD | 13 | 0.46% |
| Logitech C922 Pro Stream Webcam | 13 | 0.46% |
| Lite-On HP HD Camera | 13 | 0.46% |
| Chicony HP Wide Vision HD Camera | 13 | 0.46% |
| Syntek EasyCamera | 12 | 0.42% |
| Suyin HP Truevision HD | 12 | 0.42% |
| Quanta HP HD Camera | 12 | 0.42% |
| Chicony HP Webcam | 12 | 0.42% |
| Cheng Uei Precision Industry (Foxlink) HP TrueVision HD Camera | 12 | 0.42% |
| Cheng Uei Precision Industry (Foxlink) HP TrueVision HD | 12 | 0.42% |
| Apple FaceTime HD Camera | 12 | 0.42% |
| Luxvisions Innotech Limited HP TrueVision HD Camera | 11 | 0.39% |
| Logitech Webcam C310 | 11 | 0.39% |
| Logitech HD Webcam C525 | 11 | 0.39% |
| Lite-On HP Wide Vision HD Camera | 11 | 0.39% |
| Generalplus GENERAL WEBCAM | 11 | 0.39% |
| Chicony FJ Camera | 11 | 0.39% |
| Acer HD Webcam | 11 | 0.39% |
| Acer BisonCam,NB Pro | 11 | 0.39% |
Fingerprint Vendor
Fingerprint sensor vendors


| Vendor | Computers | Percent |
|---|---|---|
| Validity Sensors | 180 | 35.16% |
| Synaptics | 163 | 31.84% |
| Shenzhen Goodix Technology | 62 | 12.11% |
| Upek | 33 | 6.45% |
| AuthenTec | 26 | 5.08% |
| LighTuning Technology | 19 | 3.71% |
| Elan Microelectronics | 18 | 3.52% |
| STMicroelectronics | 8 | 1.56% |
| Focal-systems.Corp | 2 | 0.39% |
| Goodix | 1 | 0.2% |
Fingerprint Model
Fingerprint sensor models


| Model | Computers | Percent |
|---|---|---|
| Synaptics Prometheus MIS Touch Fingerprint Reader | 46 | 8.98% |
| Unknown | 40 | 7.81% |
| Validity Sensors VFS495 Fingerprint Reader | 33 | 6.45% |
| Upek Biometric Touchchip/Touchstrip Fingerprint Sensor | 32 | 6.25% |
| Validity Sensors VFS 5011 fingerprint sensor | 29 | 5.66% |
| Shenzhen Goodix Fingerprint Device | 26 | 5.08% |
| Synaptics FS7604 Touch Fingerprint Sensor with PurePrint | 23 | 4.49% |
| Shenzhen Goodix FingerPrint | 19 | 3.71% |
| Elan ELAN:Fingerprint | 18 | 3.52% |
| Shenzhen Goodix Fingerprint Reader | 17 | 3.32% |
| Synaptics WBDI | 16 | 3.13% |
| Validity Sensors VFS5011 Fingerprint Reader | 14 | 2.73% |
| Validity Sensors VFS491 | 14 | 2.73% |
| Validity Sensors VFS451 Fingerprint Reader | 13 | 2.54% |
| LighTuning EgisTec Touch Fingerprint Sensor | 13 | 2.54% |
| Validity Sensors Synaptics WBDI | 12 | 2.34% |
| Synaptics Metallica MIS Touch Fingerprint Reader | 12 | 2.34% |
| Validity Sensors VFS471 Fingerprint Reader | 11 | 2.15% |
| Validity Sensors Fingerprint scanner | 11 | 2.15% |
| Validity Sensors VFS7500 Touch Fingerprint Sensor | 10 | 1.95% |
| Synaptics VFS7552 Touch Fingerprint Sensor with PurePrint | 10 | 1.95% |
| Synaptics Metallica MOH Touch Fingerprint Reader | 9 | 1.76% |
| AuthenTec AES2810 | 9 | 1.76% |
| STMicroelectronics Fingerprint Reader | 8 | 1.56% |
| Validity Sensors VFS101 Fingerprint Reader | 7 | 1.37% |
| Validity Sensors Swipe Fingerprint Sensor | 7 | 1.37% |
| Synaptics WBDI Device | 6 | 1.17% |
| Validity Sensors VFS7552 Touch Fingerprint Sensor | 5 | 0.98% |
| AuthenTec AES2501 Fingerprint Sensor | 5 | 0.98% |
| AuthenTec AES1600 | 5 | 0.98% |
| Validity Sensors VFS301 Fingerprint Reader | 4 | 0.78% |
| Validity Sensors Synaptics VFS7552 Touch Fingerprint Sensor with PurePrint | 4 | 0.78% |
| LighTuning ES603 Swipe Fingerprint Sensor | 4 | 0.78% |
| AuthenTec Fingerprint Sensor | 4 | 0.78% |
| Validity Sensors Synaptics VFS7552 Touch Fingerprint Sensor | 3 | 0.59% |
| Validity Sensors VFS Fingerprint sensor | 2 | 0.39% |
| LighTuning Fingerprint Reader | 2 | 0.39% |
| Focal-systems.Corp FT9201Fingerprint. | 2 | 0.39% |
| AuthenTec AES2550 Fingerprint Sensor | 2 | 0.39% |
| Validity Sensors VFS300 Fingerprint Reader | 1 | 0.2% |
| Upek TCS5B Fingerprint sensor | 1 | 0.2% |
| Synaptics WBDI Fingerprint Reader - USB 052 | 1 | 0.2% |
| Goodix FingerPrint | 1 | 0.2% |
| AuthenTec AES1660 Fingerprint Sensor | 1 | 0.2% |
Chipcard Vendor
Chipcard module vendors


| Vendor | Computers | Percent |
|---|---|---|
| Broadcom | 91 | 41.74% |
| Alcor Micro | 59 | 27.06% |
| Lenovo | 16 | 7.34% |
| O2 Micro | 14 | 6.42% |
| Upek | 13 | 5.96% |
| Gemalto (was Gemplus) | 7 | 3.21% |
| Advanced Card Systems | 3 | 1.38% |
| Aladdin Knowledge Systems | 2 | 0.92% |
| Yubico.com | 1 | 0.46% |
| SCM Microsystems | 1 | 0.46% |
| Realtek Semiconductor | 1 | 0.46% |
| OmniKey | 1 | 0.46% |
| NXP Semiconductors | 1 | 0.46% |
| HID Global | 1 | 0.46% |
| Hewlett-Packard | 1 | 0.46% |
| Giesecke & Devrient | 1 | 0.46% |
| Chicony Electronics | 1 | 0.46% |
| Cherry | 1 | 0.46% |
| C3PO | 1 | 0.46% |
| BIT4ID | 1 | 0.46% |
| Aktiv | 1 | 0.46% |
Chipcard Model
Chipcard module models


| Model | Computers | Percent |
|---|---|---|
| Alcor Micro AU9540 Smartcard Reader | 58 | 26.61% |
| Broadcom BCM5880 Secure Applications Processor | 32 | 14.68% |
| Broadcom 58200 | 22 | 10.09% |
| Broadcom 5880 | 19 | 8.72% |
| Lenovo Integrated Smart Card Reader | 16 | 7.34% |
| Broadcom BCM5880 Secure Applications Processor with fingerprint swipe sensor | 16 | 7.34% |
| Upek TouchChip Fingerprint Coprocessor (WBF advanced mode) | 13 | 5.96% |
| O2 Micro OZ776 CCID Smartcard Reader | 11 | 5.05% |
| Gemalto (was Gemplus) Compact Smart Card Reader Writer | 5 | 2.29% |
| O2 Micro Oz776 SmartCard Reader | 3 | 1.38% |
| Gemalto (was Gemplus) GemPC Twin SmartCard Reader | 2 | 0.92% |
| Broadcom BCM5880 Secure Applications Processor with fingerprint touch sensor | 2 | 0.92% |
| Aladdin Knowledge Systems Token JC | 2 | 0.92% |
| Advanced Card Systems ACR38 SmartCard Reader | 2 | 0.92% |
| Yubico.com Yubikey NEO(-N) OTP+CCID | 1 | 0.46% |
| SCM Microsystems SCR331-LC1 / SCR3310 SmartCard Reader | 1 | 0.46% |
| Realtek Semiconductor Smart Card Reader Interface | 1 | 0.46% |
| OmniKey CardMan 3021 / 3121 | 1 | 0.46% |
| NXP Semiconductors PR533 | 1 | 0.46% |
| HID Global USB Reader V3 | 1 | 0.46% |
| Hewlett-Packard SC Keyboard - Apollo (Liteon) | 1 | 0.46% |
| Giesecke & Devrient StarSign CUT | 1 | 0.46% |
| Chicony Electronics HP Skylab USB Smartcard Keyboard | 1 | 0.46% |
| Cherry SmartTerminal XX1X | 1 | 0.46% |
| C3PO USB SMART CARD READER | 1 | 0.46% |
| BIT4ID miniLector EVO | 1 | 0.46% |
| Alcor Micro Watchdata W 1981 | 1 | 0.46% |
| Aktiv Rutoken lite | 1 | 0.46% |
| Advanced Card Systems ACR122U | 1 | 0.46% |
Printer Vendor
Printer device vendors


| Vendor | Computers | Percent |
|---|---|---|
| Hewlett-Packard | 55 | 36.42% |
| Brother Industries | 31 | 20.53% |
| Canon | 18 | 11.92% |
| Seiko Epson | 16 | 10.6% |
| Samsung Electronics | 11 | 7.28% |
| QinHeng Electronics | 3 | 1.99% |
| Pantum | 3 | 1.99% |
| Ricoh | 2 | 1.32% |
| Panasonic (Matsushita) | 2 | 1.32% |
| Lexmark International | 2 | 1.32% |
| Xerox | 1 | 0.66% |
| TSC Auto ID Technology | 1 | 0.66% |
| STMicroelectronics | 1 | 0.66% |
| Prolific Technology | 1 | 0.66% |
| Kyocera | 1 | 0.66% |
| GODEX INTERNATIONAL | 1 | 0.66% |
| Dymo-CoStar | 1 | 0.66% |
| Apple | 1 | 0.66% |
Printer Model
Printer device models


| Model | Computers | Percent |
|---|---|---|
| HP LaserJet 1020 | 4 | 2.65% |
| Seiko Epson L3150 Series | 3 | 1.99% |
| QinHeng CH340S | 3 | 1.99% |
| HP OfficeJet 6950 | 3 | 1.99% |
| HP DeskJet 2130 series | 3 | 1.99% |
| Seiko Epson Printer | 2 | 1.32% |
| Seiko Epson L120 Series | 2 | 1.32% |
| Samsung ML-1660 Series | 2 | 1.32% |
| Samsung M2020 Series | 2 | 1.32% |
| Pantum P2500W series | 2 | 1.32% |
| HP OfficeJet 5200 series | 2 | 1.32% |
| HP LaserJet M14-M17 | 2 | 1.32% |
| HP ENVY 4520 series | 2 | 1.32% |
| HP DeskJet 2620 All-in-One Printer | 2 | 1.32% |
| Canon PIXMA MP270 All-In-One Printer | 2 | 1.32% |
| Canon PIXMA MG3600 Series | 2 | 1.32% |
| Canon PIXMA MG2500 Series | 2 | 1.32% |
| Brother Printer | 2 | 1.32% |
| Brother MFC-L2710DW series | 2 | 1.32% |
| Brother HL-2130 series | 2 | 1.32% |
| Brother HL-2030 Laser Printer | 2 | 1.32% |
| Xerox Phaser 6000B | 1 | 0.66% |
| TSC Auto ID Printer | 1 | 0.66% |
| STMicroelectronics LED badge -- mini LED display -- 11x44 | 1 | 0.66% |
| Seiko Epson PX-105 Series | 1 | 0.66% |
| Seiko Epson ME 320/330 Series [Stylus SX125] | 1 | 0.66% |
| Seiko Epson L805 Series | 1 | 0.66% |
| Seiko Epson L555 Series | 1 | 0.66% |
| Seiko Epson L355 Series | 1 | 0.66% |
| Seiko Epson L210 Series | 1 | 0.66% |
| Seiko Epson L110 Series | 1 | 0.66% |
| Seiko Epson ET-3750 Series | 1 | 0.66% |
| Seiko Epson AL-M310DN | 1 | 0.66% |
| Samsung SCX-4623 Series | 1 | 0.66% |
| Samsung SCX-4200 series | 1 | 0.66% |
| Samsung ML-2010P Mono Laser Printer | 1 | 0.66% |
| Samsung ML-1865 | 1 | 0.66% |
| Samsung ML-1640 Series Laser Printer | 1 | 0.66% |
| Samsung M267x 287x Series | 1 | 0.66% |
| Samsung C43x Series | 1 | 0.66% |
| Ricoh SP 150w | 1 | 0.66% |
| Ricoh Printing Support | 1 | 0.66% |
| Prolific PL2305 Parallel Port | 1 | 0.66% |
| Pantum M6500 series | 1 | 0.66% |
| Panasonic (Matsushita) KX-MB2030 Multifunction Laser Printer | 1 | 0.66% |
| Panasonic (Matsushita) KX-MB1500CX | 1 | 0.66% |
| Lexmark International Lexmark CS410dn | 1 | 0.66% |
| Lexmark International InkJet Color Printer | 1 | 0.66% |
| Kyocera FS-1030D printer | 1 | 0.66% |
| HP Smart Tank Plus 650 series | 1 | 0.66% |
| HP OfficeJet Pro 7730 series | 1 | 0.66% |
| HP OfficeJet 6960 | 1 | 0.66% |
| HP Officejet 4630 series | 1 | 0.66% |
| HP Officejet 4620 series | 1 | 0.66% |
| HP Officejet 4500 G510g-m | 1 | 0.66% |
| HP OfficeJet 3830 series | 1 | 0.66% |
| HP Neverstop Laser 100x | 1 | 0.66% |
| HP LaserJet Professional P1566 | 1 | 0.66% |
| HP LaserJet Professional P1102w | 1 | 0.66% |
| HP LaserJet Professional P 1102w | 1 | 0.66% |
Scanner Vendor
Scanner device vendors


| Vendor | Computers | Percent |
|---|---|---|
| Canon | 24 | 70.59% |
| Seiko Epson | 5 | 14.71% |
| Hewlett-Packard | 4 | 11.76% |
| Ultima Electronics | 1 | 2.94% |
Scanner Model
Scanner device models


| Model | Computers | Percent |
|---|---|---|
| Canon CanoScan LiDE 110 | 6 | 17.65% |
| Canon CanoScan N670U/N676U/LiDE 20 | 3 | 8.82% |
| Canon CanoScan LiDE 210 | 3 | 8.82% |
| Seiko Epson GT-F520/GT-F570 [Perfection 3590 PHOTO] | 2 | 5.88% |
| Canon CanoScan LiDE 120 | 2 | 5.88% |
| Ultima Artec E+ 48U | 1 | 2.94% |
| Seiko Epson Scanner | 1 | 2.94% |
| Seiko Epson GT-F730 [GT-S630/Perfection V33/V330 Photo] | 1 | 2.94% |
| Seiko Epson GT-7200U [Perfection 1250/1250 PHOTO] | 1 | 2.94% |
| HP ScanJet G4050 | 1 | 2.94% |
| HP ScanJet 3970c | 1 | 2.94% |
| HP ScanJet 3770 | 1 | 2.94% |
| HP ScanJet 3400cse | 1 | 2.94% |
| Canon CanoScan N1240U/LiDE 30 | 1 | 2.94% |
| Canon CanoScan LiDE 700F | 1 | 2.94% |
| Canon CanoScan LiDE 600F | 1 | 2.94% |
| Canon CanoScan LiDE 60 | 1 | 2.94% |
| Canon CanoScan LIDE 25 | 1 | 2.94% |
| Canon CanoScan LiDE 220 | 1 | 2.94% |
| Canon CanoScan LiDE 200 | 1 | 2.94% |
| Canon CanoScan LiDE 100 | 1 | 2.94% |
| Canon CanoScan 8000F | 1 | 2.94% |
| Canon CanoScan | 1 | 2.94% |
Bluetooth Vendor
Controller vendors


| Vendor | Computers | Percent |
|---|---|---|
| Intel | 1264 | 45.8% |
| Qualcomm Atheros Communications | 281 | 10.18% |
| Realtek Semiconductor | 250 | 9.06% |
| Cambridge Silicon Radio | 192 | 6.96% |
| Broadcom | 170 | 6.16% |
| Lite-On Technology | 123 | 4.46% |
| IMC Networks | 97 | 3.51% |
| Apple | 87 | 3.15% |
| ASUSTek Computer | 58 | 2.1% |
| Foxconn / Hon Hai | 49 | 1.78% |
| Dell | 41 | 1.49% |
| Hewlett-Packard | 33 | 1.2% |
| Ralink | 28 | 1.01% |
| Toshiba | 19 | 0.69% |
| Realtek | 13 | 0.47% |
| Alps Electric | 10 | 0.36% |
| Foxconn International | 9 | 0.33% |
| Ralink Technology | 5 | 0.18% |
| Marvell Semiconductor | 4 | 0.14% |
| Belkin Components | 4 | 0.14% |
| Dynex | 3 | 0.11% |
| Chicony Electronics | 3 | 0.11% |
| Unknown | 2 | 0.07% |
| Qcom | 2 | 0.07% |
| Micro Star International | 2 | 0.07% |
| Integrated System Solution | 2 | 0.07% |
| HTC (High Tech Computer) | 2 | 0.07% |
| Askey Computer | 2 | 0.07% |
| Taiyo Yuden | 1 | 0.04% |
| Microsoft | 1 | 0.04% |
| Fujitsu | 1 | 0.04% |
| Edimax Technology | 1 | 0.04% |
| D-Link System | 1 | 0.04% |
Bluetooth Model
Controller models


| Model | Computers | Percent |
|---|---|---|
| Intel Bluetooth Device | 807 | 29.22% |
| Cambridge Silicon Radio Bluetooth Dongle (HCI mode) | 192 | 6.95% |
| Intel Bluetooth 9460/9560 Jefferson Peak (JfP) | 167 | 6.05% |
| Qualcomm Atheros Bluetooth Device | 159 | 5.76% |
| Intel Bluetooth wireless interface | 159 | 5.76% |
| Realtek Bluetooth Radio | 139 | 5.03% |
| Realtek Bluetooth 4.2 Adapter | 79 | 2.86% |
| Lite-On Qualcomm Atheros QCA9377 Bluetooth | 54 | 1.96% |
| Intel Wireless-AC 3168 Bluetooth | 52 | 1.88% |
| Intel Wireless-AC 9260 Bluetooth Adapter | 48 | 1.74% |
| Qualcomm Atheros AR3012 Bluetooth 4.0 | 40 | 1.45% |
| Qualcomm Atheros AR3011 Bluetooth | 36 | 1.3% |
| Lite-On Bluetooth Device | 35 | 1.27% |
| IMC Networks Bluetooth Device | 35 | 1.27% |
| Qualcomm Atheros QCA61x4 Bluetooth 4.0 | 34 | 1.23% |
| Intel Centrino Advanced-N 6230 Bluetooth adapter | 32 | 1.16% |
| IMC Networks Bluetooth Radio | 32 | 1.16% |
| Apple Bluetooth Host Controller | 32 | 1.16% |
| Ralink RT3290 Bluetooth | 28 | 1.01% |
| Broadcom BCM2045B (BDC-2.1) | 28 | 1.01% |
| Apple Bluetooth USB Host Controller | 28 | 1.01% |
| Broadcom BCM20702A0 Bluetooth 4.0 | 25 | 0.91% |
| Foxconn / Hon Hai Bluetooth Device | 22 | 0.8% |
| ASUS Broadcom BCM20702A0 Bluetooth | 20 | 0.72% |
| Realtek RTL8723B Bluetooth | 17 | 0.62% |
| HP Bluetooth 2.0 Interface [Broadcom BCM2045] | 17 | 0.62% |
| Lite-On Atheros AR3012 Bluetooth | 16 | 0.58% |
| Dell DW375 Bluetooth Module | 16 | 0.58% |
| HP Broadcom 2070 Bluetooth Combo | 14 | 0.51% |
| Broadcom HP Portable SoftSailing | 14 | 0.51% |
| Broadcom BCM20702 Bluetooth 4.0 [ThinkPad] | 14 | 0.51% |
| Realtek Bluetooth Radio | 13 | 0.47% |
| Apple Built-in Bluetooth 2.0+EDR HCI | 13 | 0.47% |
| Apple Bluetooth HCI | 13 | 0.47% |
| Realtek RTL8821A Bluetooth | 12 | 0.43% |
| IMC Networks Atheros AR3012 Bluetooth 4.0 Adapter | 12 | 0.43% |
| Foxconn / Hon Hai BCM20702A0 | 12 | 0.43% |
| Broadcom BCM2070 Bluetooth 2.1 + EDR | 12 | 0.43% |
| Broadcom BCM2045 Bluetooth | 11 | 0.4% |
| Broadcom HP Portable Bumble Bee | 10 | 0.36% |
| ASUS Bluetooth Radio | 10 | 0.36% |
| Foxconn International BCM43142A0 Bluetooth module | 9 | 0.33% |
| Broadcom BCM43142A0 Bluetooth 4.0 | 8 | 0.29% |
| Qualcomm Atheros Bluetooth USB Host Controller | 7 | 0.25% |
| IMC Networks Bluetooth | 7 | 0.25% |
| Dell BCM20702A0 Bluetooth Module | 7 | 0.25% |
| Broadcom BCM43142A0 Bluetooth Device | 7 | 0.25% |
| Broadcom BCM2070 Bluetooth Device | 7 | 0.25% |
| ASUS BT-270 Bluetooth Adapter | 7 | 0.25% |
| Toshiba RT Bluetooth Radio | 6 | 0.22% |
| Toshiba Bluetooth Device | 6 | 0.22% |
| Lite-On Qualcomm Atheros Bluetooth | 6 | 0.22% |
| Lite-On Bluetooth Radio | 6 | 0.22% |
| Dell Wireless 360 Bluetooth | 5 | 0.18% |
| Broadcom BCM2046 Bluetooth Device | 5 | 0.18% |
| ASUS Bluetooth Adapter | 5 | 0.18% |
| Ralink CSR BS8510 | 4 | 0.14% |
| IMC Networks BCM20702A0 | 4 | 0.14% |
| Foxconn / Hon Hai Bluetooth USB Host Controller | 4 | 0.14% |
| Dell Wireless 370 Bluetooth Mini-card | 4 | 0.14% |
Unsupported Devices
Total unsupported devices on board


| Total | Computers | Percent |
|---|---|---|
| 0 | 3627 | 73.38% |
| 1 | 1069 | 21.63% |
| 2 | 209 | 4.23% |
| 3 | 25 | 0.51% |
| 4 | 8 | 0.16% |
| 7 | 2 | 0.04% |
| 5 | 2 | 0.04% |
| 9 | 1 | 0.02% |
Unsupported Device Types
Types of unsupported devices


| Type | Computers | Percent |
|---|---|---|
| Fingerprint reader | 501 | 31.79% |
| Graphics card | 326 | 20.69% |
| Chipcard | 179 | 11.36% |
| Net/wireless | 177 | 11.23% |
| Multimedia controller | 98 | 6.22% |
| Communication controller | 57 | 3.62% |
| Bluetooth | 44 | 2.79% |
| Storage | 34 | 2.16% |
| Camera | 31 | 1.97% |
| Sound | 30 | 1.9% |
| Unassigned class | 27 | 1.71% |
| Card reader | 14 | 0.89% |
| Net/ethernet | 13 | 0.82% |
| Modem | 12 | 0.76% |
| Network | 9 | 0.57% |
| Dvb card | 8 | 0.51% |
| Flash memory | 6 | 0.38% |
| Storage/ide | 5 | 0.32% |
| Storage/raid | 3 | 0.19% |
| Firewire controller | 2 | 0.13% |