openSUSE Hardware Trends
A project to identify most popular hardware characteristics and track their change over time based on data collected by openSUSE users at https://Linux-Hardware.org.
Anyone can contribute to the study by uploading probes of their computers by the hw-probe tool:
sudo hw-probe -all -uploadThis is a report for all computer types. See also reports for desktops and notebooks.
Full-feature report is available here: https://linux-hardware.org/?view=trends
Period: Apr, 2020.
Contents
- OS
- OS Family
- Kernel
- Kernel Family
- Kernel Major Ver.
- Arch
- DE
- Display Server
- Display Manager
- OS Lang
- Boot Mode
- Filesystem
- Dual Boot with Linux/BSD
- Dual Boot (Win)
- Country
- City
- Vendor
- Model
- Model Family
- MFG Year
- Form Factor
- Secure Boot
- Coreboot
- RAM Size
- RAM Used
- Drive Vendor
- Drive Model
- Drive Kind
- Drive Connector
- Drive Size
- Space Total
- Space Used
- Malfunc. Drives
- Malfunc. Drive Vendor
- Malfunc. Drive Kind
- Failed Drives
- Failed Drive Vendor
- Drive Status
- Storage Vendor
- Storage Model
- Storage Kind
- CPU Vendor
- CPU Model
- CPU Model Family
- CPU Cores
- CPU Sockets
- CPU Threads
- CPU Op-Modes
- CPU Microarch
- CPU Microcode
- GPU Vendor
- GPU Model
- GPU Combo
- GPU Driver
- GPU Memory
- Monitor Vendor
- Monitor Model
- Monitor Resolution
- Monitor Diagonal
- Monitor Width
- Aspect Ratio
- Monitor Area
- Pixel Density
- Multiple Monitors
- Net Controller Vendor
- Net Controller Model
- Net Controller Kind
- Used Controller
- NICs
- Unsupported Devices
- Unsupported Device Types
OS
Installed operating systems


| Name | Computers | Percent |
|---|---|---|
| openSUSE 15.1 | 44 | 35.2% |
| openSUSE 20200405 | 24 | 19.2% |
| openSUSE 20200407 | 10 | 8% |
| openSUSE Leap-15.1 | 5 | 4% |
| openSUSE 20200410 | 4 | 3.2% |
| openSUSE 20200408 | 4 | 3.2% |
| openSUSE 15.2 | 4 | 3.2% |
| openSUSE 20200402 | 3 | 2.4% |
| openSUSE Tumbleweed-20200422 | 2 | 1.6% |
| openSUSE Tumbleweed-20200405 | 2 | 1.6% |
| openSUSE 20200422 | 2 | 1.6% |
| openSUSE 15.0 | 2 | 1.6% |
| openSUSE Tumbleweed-20200421 | 1 | 0.8% |
| openSUSE Tumbleweed-20200419 | 1 | 0.8% |
| openSUSE Tumbleweed-20200416 | 1 | 0.8% |
| openSUSE Tumbleweed-20200414 | 1 | 0.8% |
| openSUSE Tumbleweed-20200410 | 1 | 0.8% |
| openSUSE Tumbleweed-20200409 | 1 | 0.8% |
| openSUSE Tumbleweed-20200408 | 1 | 0.8% |
| openSUSE Tumbleweed-20200402 | 1 | 0.8% |
| openSUSE Tumbleweed-20200331 | 1 | 0.8% |
| openSUSE 20200425 | 1 | 0.8% |
| openSUSE 20200416 | 1 | 0.8% |
| openSUSE 20200413 | 1 | 0.8% |
| openSUSE 20200409 | 1 | 0.8% |
| openSUSE 20200326 | 1 | 0.8% |
| openSUSE 20200325 | 1 | 0.8% |
| openSUSE 20200322 | 1 | 0.8% |
| openSUSE 20200320 | 1 | 0.8% |
| openSUSE 20200307 | 1 | 0.8% |
| openSUSE 20200211 | 1 | 0.8% |
OS Family
OS without a version


| Name | Computers | Percent |
|---|---|---|
| openSUSE | 125 | 100% |
Kernel
Version of the Linux kernel


| Version | Computers | Percent |
|---|---|---|
| 4.12.14-lp151.28.44-default | 40 | 32% |
| 5.6.0-1-default | 26 | 20.8% |
| 5.6.2-1-default | 21 | 16.8% |
| 5.6.4-1-default | 8 | 6.4% |
| 4.12.14-lp151.28.40-default | 5 | 4% |
| 5.5.13-1-default | 3 | 2.4% |
| 5.5.11-1-default | 3 | 2.4% |
| 5.3.18-lp152.10-default | 3 | 2.4% |
| 5.5.9-1-default | 2 | 1.6% |
| 4.12.14-lp151.28.48-default | 2 | 1.6% |
| 5.6.6-1-default | 1 | 0.8% |
| 5.6.2-3.gb22bc26-default | 1 | 0.8% |
| 5.6.2-3.g7d8cfa8-default | 1 | 0.8% |
| 5.6.0-default | 1 | 0.8% |
| 5.5.4-1-default | 1 | 0.8% |
| 5.5.2-1-default | 1 | 0.8% |
| 5.4.13-1-default | 1 | 0.8% |
| 5.3.18-lp152.9-preempt | 1 | 0.8% |
| 4.18.12-2.ga880bd8-default | 1 | 0.8% |
| 4.12.14-lp151.28.36-default | 1 | 0.8% |
| 4.12.14-lp150.12.82-default | 1 | 0.8% |
| 4.12.14-lp150.12.79-default | 1 | 0.8% |
Kernel Family
Linux kernel without a distro release


| Version | Computers | Percent |
|---|---|---|
| 4.12.14 | 50 | 40% |
| 5.6.0 | 27 | 21.6% |
| 5.6.2 | 23 | 18.4% |
| 5.6.4 | 8 | 6.4% |
| 5.3.18 | 4 | 3.2% |
| 5.5.13 | 3 | 2.4% |
| 5.5.11 | 3 | 2.4% |
| 5.5.9 | 2 | 1.6% |
| 5.6.6 | 1 | 0.8% |
| 5.5.4 | 1 | 0.8% |
| 5.5.2 | 1 | 0.8% |
| 5.4.13 | 1 | 0.8% |
| 4.18.12 | 1 | 0.8% |
Kernel Major Ver.
Linux kernel major version


| Version | Computers | Percent |
|---|---|---|
| 5.6 | 59 | 47.2% |
| 4.12 | 50 | 40% |
| 5.5 | 10 | 8% |
| 5.3 | 4 | 3.2% |
| 5.4 | 1 | 0.8% |
| 4.18 | 1 | 0.8% |
Arch
OS architecture (x86_64, i586, etc.)


| Name | Computers | Percent |
|---|---|---|
| x86_64 | 125 | 100% |
DE
Desktop Environment


| Name | Computers | Percent |
|---|---|---|
| KDE5 | 79 | 63.2% |
| KDE | 16 | 12.8% |
| GNOME | 12 | 9.6% |
| MATE | 9 | 7.2% |
| XFCE | 5 | 4% |
| Unknown | 3 | 2.4% |
| Cinnamon | 1 | 0.8% |
Display Server
X11 or Wayland


| Name | Computers | Percent |
|---|---|---|
| X11 | 107 | 85.6% |
| Wayland | 11 | 8.8% |
| Unspecified | 3 | 2.4% |
| Unknown | 3 | 2.4% |
| Tty | 1 | 0.8% |
Display Manager
SDDM, LightDM, etc.


| Name | Computers | Percent |
|---|---|---|
| LightDM | 102 | 81.6% |
| Unknown | 20 | 16% |
| SDDM | 2 | 1.6% |
| XDM | 1 | 0.8% |
OS Lang
Language


| Lang | Computers | Percent |
|---|---|---|
| en_US | 26 | 20.8% |
| de_DE | 24 | 19.2% |
| POSIX | 17 | 13.6% |
| en_GB | 11 | 8.8% |
| pt_PT | 7 | 5.6% |
| fr_FR | 6 | 4.8% |
| pt_BR | 5 | 4% |
| ru_RU | 4 | 3.2% |
| en_US.utf8 | 4 | 3.2% |
| es_ES | 3 | 2.4% |
| pl_PL | 2 | 1.6% |
| nl_NL | 2 | 1.6% |
| hu_HU | 2 | 1.6% |
| sl_SI | 1 | 0.8% |
| sk_SK | 1 | 0.8% |
| nb_NO | 1 | 0.8% |
| it_IT | 1 | 0.8% |
| hr_HR | 1 | 0.8% |
| fr_CA | 1 | 0.8% |
| es_MX | 1 | 0.8% |
| es_AR | 1 | 0.8% |
| en_IE | 1 | 0.8% |
| en_CA | 1 | 0.8% |
| en_AU | 1 | 0.8% |
| Unknown | 1 | 0.8% |
Boot Mode
EFI or BIOS


| Mode | Computers | Percent |
|---|---|---|
| EFI | 69 | 55.2% |
| BIOS | 56 | 44.8% |
Filesystem
Type of filesystem


| Type | Computers | Percent |
|---|---|---|
| Btrfs | 71 | 56.8% |
| Ext4 | 49 | 39.2% |
| Xfs | 4 | 3.2% |
| Tmpfs | 1 | 0.8% |
Dual Boot with Linux/BSD
Hosting more than one Linux/BSD


| Dual boot | Computers | Percent |
|---|---|---|
| No | 111 | 88.8% |
| Yes | 14 | 11.2% |
Dual Boot (Win)
Hosting Linux and Windows


| Dual boot | Computers | Percent |
|---|---|---|
| No | 85 | 68% |
| Yes | 40 | 32% |
Country
Geographic location (country)


| Country | Computers | Percent |
|---|---|---|
| Germany | 30 | 24% |
| USA | 29 | 23.2% |
| Switzerland | 7 | 5.6% |
| France | 6 | 4.8% |
| Brazil | 5 | 4% |
| UK | 4 | 3.2% |
| Serbia | 3 | 2.4% |
| Russia | 3 | 2.4% |
| Italy | 3 | 2.4% |
| Canada | 3 | 2.4% |
| Austria | 3 | 2.4% |
| Portugal | 2 | 1.6% |
| Poland | 2 | 1.6% |
| Netherlands | 2 | 1.6% |
| Mexico | 2 | 1.6% |
| Hungary | 2 | 1.6% |
| Argentina | 2 | 1.6% |
| Vietnam | 1 | 0.8% |
| Uruguay | 1 | 0.8% |
| Ukraine | 1 | 0.8% |
| Turkey | 1 | 0.8% |
| Sweden | 1 | 0.8% |
| Slovenia | 1 | 0.8% |
| Slovakia | 1 | 0.8% |
| Peru | 1 | 0.8% |
| Norway | 1 | 0.8% |
| New Zealand | 1 | 0.8% |
| Luxembourg | 1 | 0.8% |
| Israel | 1 | 0.8% |
| Ireland | 1 | 0.8% |
| Croatia | 1 | 0.8% |
| Belgium | 1 | 0.8% |
| Belarus | 1 | 0.8% |
| Australia | 1 | 0.8% |
City
Geographic location (city)


| City | Computers | Percent |
|---|---|---|
| Joplin | 8 | 6.4% |
| Neuchatel | 5 | 4% |
| Schrobenhausen | 4 | 3.2% |
| Vienna | 3 | 2.4% |
| San Jose | 3 | 2.4% |
| Munich | 3 | 2.4% |
| Berlin | 3 | 2.4% |
| Augsburg | 3 | 2.4% |
| Rochester | 2 | 1.6% |
| Porto | 2 | 1.6% |
| Kiel | 2 | 1.6% |
| João Pessoa | 2 | 1.6% |
| Gateshead | 2 | 1.6% |
| Belgrade | 2 | 1.6% |
| Amsterdam | 2 | 1.6% |
| Zagreb | 1 | 0.8% |
| Yehud | 1 | 0.8% |
| Whitchurch | 1 | 0.8% |
| Weener | 1 | 0.8% |
| Waco | 1 | 0.8% |
| Villa Ballester | 1 | 0.8% |
| Vero Beach | 1 | 0.8% |
| Vechta | 1 | 0.8% |
| Sydney | 1 | 0.8% |
| Strasbourg | 1 | 0.8% |
| St Petersburg | 1 | 0.8% |
| Slavyanka | 1 | 0.8% |
| Seattle | 1 | 0.8% |
| Salvador | 1 | 0.8% |
| Rouen | 1 | 0.8% |
| Rio Rancho | 1 | 0.8% |
| Rio de Janeiro | 1 | 0.8% |
| Peiting | 1 | 0.8% |
| Paris | 1 | 0.8% |
| Oslo | 1 | 0.8% |
| Nottingham | 1 | 0.8% |
| North College Hill | 1 | 0.8% |
| Nordenham | 1 | 0.8% |
| Niederanven | 1 | 0.8% |
| Neuwied | 1 | 0.8% |
| Neupotz | 1 | 0.8% |
| Neggio | 1 | 0.8% |
| Montreal | 1 | 0.8% |
| Montevideo | 1 | 0.8% |
| Monte Porzio Catone | 1 | 0.8% |
| Mexico City | 1 | 0.8% |
| Lviv | 1 | 0.8% |
| Lula | 1 | 0.8% |
| Ludwigsburg | 1 | 0.8% |
| Louvigne-du-Desert | 1 | 0.8% |
| Lombard | 1 | 0.8% |
| Livingston | 1 | 0.8% |
| Lima | 1 | 0.8% |
| Kessel | 1 | 0.8% |
| Kecskemét | 1 | 0.8% |
| Istanbul | 1 | 0.8% |
| Ilava | 1 | 0.8% |
| Huenfeld | 1 | 0.8% |
| Houston | 1 | 0.8% |
| Homer | 1 | 0.8% |
Vendor
Motherboard manufacturer


| Name | Computers | Percent |
|---|---|---|
| ASUSTek Computer | 21 | 16.8% |
| Gigabyte Technology | 17 | 13.6% |
| Lenovo | 16 | 12.8% |
| Hewlett-Packard | 14 | 11.2% |
| Dell | 14 | 11.2% |
| MSI | 10 | 8% |
| ASRock | 7 | 5.6% |
| TUXEDO | 3 | 2.4% |
| Toshiba | 3 | 2.4% |
| Acer | 3 | 2.4% |
| Samsung Electronics | 2 | 1.6% |
| Fujitsu Siemens | 2 | 1.6% |
| Biostar | 2 | 1.6% |
| Alienware | 2 | 1.6% |
| Unknown | 2 | 1.6% |
| Wortmann AG | 1 | 0.8% |
| Supermicro | 1 | 0.8% |
| Pegatron | 1 | 0.8% |
| INFORLANDIA | 1 | 0.8% |
| GPD | 1 | 0.8% |
| Fujitsu | 1 | 0.8% |
| DIEBOLD | 1 | 0.8% |
Model
Motherboard model


| Name | Computers | Percent |
|---|---|---|
| Dell Latitude 7490 | 4 | 3.2% |
| Unknown | 4 | 3.2% |
| ASUS All Series | 3 | 2.4% |
| MSI MS-7A33 | 2 | 1.6% |
| Gigabyte 970A-D3P | 2 | 1.6% |
| Dell Latitude E5470 | 2 | 1.6% |
| Dell G3 3579 | 2 | 1.6% |
| ASRock B450M Pro4 | 2 | 1.6% |
| Wortmann AG TERRA_MOBILE_1541H | 1 | 0.8% |
| TUXEDO N550RC | 1 | 0.8% |
| Toshiba Satellite PRO C50-A-1E2 | 1 | 0.8% |
| Toshiba Satellite L770D-10M | 1 | 0.8% |
| Toshiba Satellite C855-112 | 1 | 0.8% |
| Supermicro H8DCL | 1 | 0.8% |
| Samsung Electronics RC530/RC730 | 1 | 0.8% |
| Samsung Electronics 550P5C/550P7C | 1 | 0.8% |
| Pegatron Compaq dx2450 Microtower | 1 | 0.8% |
| MSI MS-7B86 | 1 | 0.8% |
| MSI MS-7B36 | 1 | 0.8% |
| MSI MS-7A34 | 1 | 0.8% |
| MSI MS-7721 | 1 | 0.8% |
| MSI MS-7676 | 1 | 0.8% |
| MSI MS-7673 | 1 | 0.8% |
| MSI GP63 Leopard 8RD | 1 | 0.8% |
| MSI CX61 0OC/CX61 0OD/CX61 0OL | 1 | 0.8% |
| Lenovo Y520-15IKBN 80WK | 1 | 0.8% |
| Lenovo ThinkPad X230 2324BY9 | 1 | 0.8% |
| Lenovo ThinkPad X220 4290Y11 | 1 | 0.8% |
| Lenovo ThinkPad X1 Yoga 1st 20FQCTO1WW | 1 | 0.8% |
| Lenovo ThinkPad W530 2441CTO | 1 | 0.8% |
| Lenovo ThinkPad T480s 20L7S1KW00 | 1 | 0.8% |
| Lenovo ThinkPad T480 20L6S42000 | 1 | 0.8% |
| Lenovo ThinkPad T430 2349U2B | 1 | 0.8% |
| Lenovo ThinkPad T430 2347AY1 | 1 | 0.8% |
| Lenovo ThinkCentre M93p 10A8S0CE11 | 1 | 0.8% |
| Lenovo ThinkCentre M78 10BR0005US | 1 | 0.8% |
| Lenovo Legion Y720T-34ASU 90H90015UK | 1 | 0.8% |
| Lenovo IdeaPad 320-15AST 80XV | 1 | 0.8% |
| Lenovo G505s 20255 | 1 | 0.8% |
| Lenovo B590 627439G | 1 | 0.8% |
| Lenovo B5400 80B6QB0 | 1 | 0.8% |
| INFORLANDIA W65_67SB | 1 | 0.8% |
| HP ZBook 15 G2 | 1 | 0.8% |
| HP Spectre x360 Convertible 13-w0XX | 1 | 0.8% |
| HP ProBook 4525s | 1 | 0.8% |
| HP ProBook 450 G4 | 1 | 0.8% |
| HP ProBook 430 G5 | 1 | 0.8% |
| HP Pavilion g7 | 1 | 0.8% |
| HP Pavilion dv7 | 1 | 0.8% |
| HP Pavilion Desktop 590-p0xxx | 1 | 0.8% |
| HP Pavilion 14 | 1 | 0.8% |
| HP OMEN by HP Desktop PC 880-p1xx | 1 | 0.8% |
| HP Mini 110-3100 | 1 | 0.8% |
| HP EliteBook 840 G6 | 1 | 0.8% |
| HP EliteBook 840 G2 | 1 | 0.8% |
| HP EliteBook 820 G3 | 1 | 0.8% |
| GPD P2 MAX | 1 | 0.8% |
| Gigabyte Z390 AORUS MASTER | 1 | 0.8% |
| Gigabyte Z170X-Gaming 7 | 1 | 0.8% |
| Gigabyte Z170-HD3 DDR3-CF | 1 | 0.8% |
Model Family
Motherboard model prefix


| Name | Computers | Percent |
|---|---|---|
| Dell Latitude | 10 | 8% |
| Lenovo ThinkPad | 8 | 6.4% |
| HP Pavilion | 4 | 3.2% |
| Unknown | 4 | 3.2% |
| Toshiba Satellite | 3 | 2.4% |
| HP ProBook | 3 | 2.4% |
| HP EliteBook | 3 | 2.4% |
| ASUS All | 3 | 2.4% |
| MSI MS-7A33 | 2 | 1.6% |
| Lenovo ThinkCentre | 2 | 1.6% |
| Gigabyte 970A-D3P | 2 | 1.6% |
| Dell OptiPlex | 2 | 1.6% |
| Dell G3 | 2 | 1.6% |
| ASUS VivoBook | 2 | 1.6% |
| ASUS M5A78L-M | 2 | 1.6% |
| ASRock B450M | 2 | 1.6% |
| Acer Aspire | 2 | 1.6% |
| Wortmann AG TERRA | 1 | 0.8% |
| TUXEDO N550RC | 1 | 0.8% |
| Supermicro H8DCL | 1 | 0.8% |
| Samsung Electronics RC530 | 1 | 0.8% |
| Samsung Electronics 550P5C | 1 | 0.8% |
| Pegatron Compaq | 1 | 0.8% |
| MSI MS-7B86 | 1 | 0.8% |
| MSI MS-7B36 | 1 | 0.8% |
| MSI MS-7A34 | 1 | 0.8% |
| MSI MS-7721 | 1 | 0.8% |
| MSI MS-7676 | 1 | 0.8% |
| MSI MS-7673 | 1 | 0.8% |
| MSI GP63 | 1 | 0.8% |
| MSI CX61 | 1 | 0.8% |
| Lenovo Y520-15IKBN | 1 | 0.8% |
| Lenovo Legion | 1 | 0.8% |
| Lenovo IdeaPad | 1 | 0.8% |
| Lenovo G505s | 1 | 0.8% |
| Lenovo B590 | 1 | 0.8% |
| Lenovo B5400 | 1 | 0.8% |
| INFORLANDIA W65 | 1 | 0.8% |
| HP ZBook | 1 | 0.8% |
| HP Spectre | 1 | 0.8% |
| HP OMEN | 1 | 0.8% |
| HP Mini | 1 | 0.8% |
| GPD P2 | 1 | 0.8% |
| Gigabyte Z390 | 1 | 0.8% |
| Gigabyte Z170X-Gaming | 1 | 0.8% |
| Gigabyte Z170-HD3 | 1 | 0.8% |
| Gigabyte X570 | 1 | 0.8% |
| Gigabyte X399 | 1 | 0.8% |
| Gigabyte M68MT-S2 | 1 | 0.8% |
| Gigabyte H97-D3H | 1 | 0.8% |
| Gigabyte GA-MA790XT-UD4P | 1 | 0.8% |
| Gigabyte GA-880GA-UD3H | 1 | 0.8% |
| Gigabyte GA-770TA-UD3 | 1 | 0.8% |
| Gigabyte F2A85XM-D3H | 1 | 0.8% |
| Gigabyte B450M | 1 | 0.8% |
| Gigabyte B250M-D2V | 1 | 0.8% |
| Gigabyte AX370-Gaming | 1 | 0.8% |
| Gigabyte 970A-DS3P | 1 | 0.8% |
| Fujitsu STYLISTIC | 1 | 0.8% |
| Fujitsu Siemens LIFEBOOK | 1 | 0.8% |
MFG Year
Motherboard manufacture year


| Year | Computers | Percent |
|---|---|---|
| 2019 | 46 | 36.8% |
| 2018 | 14 | 11.2% |
| 2013 | 13 | 10.4% |
| 2015 | 9 | 7.2% |
| 2012 | 9 | 7.2% |
| 2014 | 8 | 6.4% |
| 2016 | 6 | 4.8% |
| 2011 | 6 | 4.8% |
| 2017 | 5 | 4% |
| 2010 | 4 | 3.2% |
| 2020 | 2 | 1.6% |
| 2009 | 1 | 0.8% |
| 2008 | 1 | 0.8% |
| 2005 | 1 | 0.8% |
Form Factor
Physical design of the computer


| Name | Computers | Percent |
|---|---|---|
| Notebook | 61 | 48.8% |
| Desktop | 60 | 48% |
| Convertible | 3 | 2.4% |
| Server | 1 | 0.8% |
Secure Boot
Enabled or disabled


| State | Computers | Percent |
|---|---|---|
| Disabled | 107 | 85.6% |
| Enabled | 18 | 14.4% |
Coreboot
Have coreboot on board


| Used | Computers | Percent |
|---|---|---|
| No | 125 | 100% |
RAM Size
Total RAM memory


| Size in GB | Computers | Percent |
|---|---|---|
| 16.01-24.0 | 39 | 31.2% |
| 4.01-8.0 | 30 | 24% |
| 8.01-16.0 | 23 | 18.4% |
| 32.01-64.0 | 16 | 12.8% |
| 3.01-4.0 | 7 | 5.6% |
| 64.01-256.0 | 4 | 3.2% |
| 1.01-2.0 | 3 | 2.4% |
| 24.01-32.0 | 2 | 1.6% |
| 2.01-3.0 | 1 | 0.8% |
RAM Used
Used RAM memory


| Used GB | Computers | Percent |
|---|---|---|
| 2.01-3.0 | 31 | 24.8% |
| 4.01-8.0 | 27 | 21.6% |
| 1.01-2.0 | 26 | 20.8% |
| 3.01-4.0 | 16 | 12.8% |
| 8.01-16.0 | 12 | 9.6% |
| 0.01-1.0 | 9 | 7.2% |
| 16.01-24.0 | 2 | 1.6% |
| 32.01-64.0 | 1 | 0.8% |
| 24.01-32.0 | 1 | 0.8% |
Drive Vendor
Hard drive vendors


| Vendor | Computers | Drives | Percent |
|---|---|---|---|
| Samsung Electronics | 51 | 61 | 24.64% |
| Seagate | 43 | 61 | 20.77% |
| WDC | 27 | 41 | 13.04% |
| Crucial | 16 | 17 | 7.73% |
| SanDisk | 14 | 14 | 6.76% |
| Toshiba | 11 | 11 | 5.31% |
| Kingston | 7 | 7 | 3.38% |
| PNY | 4 | 5 | 1.93% |
| Hitachi | 4 | 4 | 1.93% |
| Micron Technology | 3 | 3 | 1.45% |
| SPCC | 2 | 2 | 0.97% |
| SK Hynix | 2 | 2 | 0.97% |
| OCZ | 2 | 2 | 0.97% |
| LITEON | 2 | 2 | 0.97% |
| Intel | 2 | 2 | 0.97% |
| HGST | 2 | 2 | 0.97% |
| Corsair | 2 | 2 | 0.97% |
| Biostar | 2 | 2 | 0.97% |
| A-DATA Technology | 2 | 2 | 0.97% |
| SuperTalent | 1 | 1 | 0.48% |
| PLEXTOR | 1 | 1 | 0.48% |
| Phison Electronics | 1 | 1 | 0.48% |
| Patriot | 1 | 1 | 0.48% |
| Mushkin | 1 | 1 | 0.48% |
| Lenovo | 1 | 1 | 0.48% |
| JMicron | 1 | 1 | 0.48% |
| Hewlett-Packard | 1 | 1 | 0.48% |
| Generic | 1 | 1 | 0.48% |
Drive Model
Hard drive models


| Model | Computers | Percent |
|---|---|---|
| SSD 860 EVO 500GB | 5 | 2.02% |
| SSD 850 EVO 250GB | 5 | 2.02% |
| Expansion Desk 5TB | 5 | 2.02% |
| ST3500418AS 500GB | 4 | 1.61% |
| SSD 840 EVO 250GB | 4 | 1.61% |
| WD10EZEX-22MFCA0 1TB | 3 | 1.21% |
| WD10EZEX-08WN4A0 1TB | 3 | 1.21% |
| SSD 970 EVO 500GB | 3 | 1.21% |
| SSD 850 PRO 256GB | 3 | 1.21% |
| WDS480G2G0A-00JH30 480GB SSD | 2 | 0.81% |
| WD20SPZX-22UA7T0 2TB | 2 | 0.81% |
| WD20EZRZ-00Z5HB0 2TB | 2 | 0.81% |
| WD20EARS-00MVWB0 2TB | 2 | 0.81% |
| ST500LM000-1EJ162 500GB | 2 | 0.81% |
| ST500DM002-1BD142 500GB | 2 | 0.81% |
| ST32000641AS 2TB | 2 | 0.81% |
| ST3000DM008-2DM166 3TB | 2 | 0.81% |
| ST2000DM006-2DM164 2TB | 2 | 0.81% |
| ST1000LM035-1RK172 1TB | 2 | 0.81% |
| ST1000LM024 HN-M101MBB 1TB | 2 | 0.81% |
| ST1000DX002-2DV162 1TB | 2 | 0.81% |
| ST1000DM010-2EP102 1TB | 2 | 0.81% |
| SSD2SC480G1CS2754D117-514 480GB | 2 | 0.81% |
| SSD 970 EVO Plus 1TB | 2 | 0.81% |
| SSD 970 EVO 1TB | 2 | 0.81% |
| SSD 860 QVO 1TB | 2 | 0.81% |
| SSD 850 EVO 500GB | 2 | 0.81% |
| SSD 850 EVO 120GB | 2 | 0.81% |
| SSD 840 Series 120GB | 2 | 0.81% |
| SSD 840 PRO Series 256GB | 2 | 0.81% |
| SDSSDA240G 240GB | 2 | 0.81% |
| SD8SB8U256G1122 256GB SSD | 2 | 0.81% |
| HDWD110 1TB | 2 | 0.81% |
| HD502HI 500GB | 2 | 0.81% |
| HD204UI 2TB | 2 | 0.81% |
| CT500MX500SSD1 500GB | 2 | 0.81% |
| CT240BX500SSD1 240GB | 2 | 0.81% |
| CT1000P1SSD8 1TB | 2 | 0.81% |
| Backup+ Hub BK 8TB | 2 | 0.81% |
| X600 M.2 2280 SATA 256GB SSD | 1 | 0.4% |
| Wildfire 120GB SSD | 1 | 0.4% |
| WDS500G1B0C-00S6U0 500GB | 1 | 0.4% |
| WDS250G2B0B-00YS70 250GB SSD | 1 | 0.4% |
| WDS250G1B0C-00S6U0 250GB | 1 | 0.4% |
| WDS100T1B0A-00H9H0 1TB SSD | 1 | 0.4% |
| WD7500AYYS-01RCA0 752GB | 1 | 0.4% |
| WD6400BPVT-75HXZT1 640GB | 1 | 0.4% |
| WD60EFRX-68MYMN1 6TB | 1 | 0.4% |
| WD60EFRX-68L0BN1 6TB | 1 | 0.4% |
| WD50EZRX-00MVLB1 5TB | 1 | 0.4% |
| WD40EZRX-00SPEB0 4TB | 1 | 0.4% |
| WD40EFRX-68WT0N0 4TB | 1 | 0.4% |
| WD4004FZWX-00GBGB0 4TB | 1 | 0.4% |
| WD30EZRX-00SPEB0 3TB | 1 | 0.4% |
| WD20EZRX-00DC0B0 2TB | 1 | 0.4% |
| WD20EZRX-00D8PB0 2TB | 1 | 0.4% |
| WD2003FYYS-02W0B1 2TB | 1 | 0.4% |
| WD1600BEVT-22A23T0 160GB | 1 | 0.4% |
| WD10SPZX-21Z10T0 1TB | 1 | 0.4% |
| WD10SPZX-17Z10T0 1TB | 1 | 0.4% |
Drive Kind
HDD or SSD


| Kind | Computers | Drives | Percent |
|---|---|---|---|
| SSD | 73 | 97 | 39.89% |
| HDD | 73 | 115 | 39.89% |
| NVMe | 33 | 35 | 18.03% |
| Unknown | 4 | 4 | 2.19% |
Drive Connector
SATA, SAS, NVMe, etc.
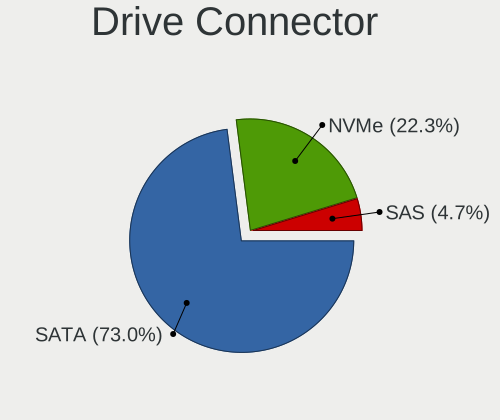

| Type | Computers | Drives | Percent |
|---|---|---|---|
| SATA | 108 | 205 | 72.97% |
| NVMe | 33 | 35 | 22.3% |
| SAS | 7 | 11 | 4.73% |
Drive Size
Size of hard drive


| Size in TB | Computers | Drives | Percent |
|---|---|---|---|
| 0.01-0.5 | 86 | 123 | 45.99% |
| 0.51-1.0 | 55 | 68 | 29.41% |
| 1.01-2.0 | 23 | 33 | 12.3% |
| 4.01-10.0 | 9 | 13 | 4.81% |
| 2.01-3.0 | 8 | 8 | 4.28% |
| 3.01-4.0 | 6 | 6 | 3.21% |
Space Total
Amount of disk space available on the file system


| Size in GB | Computers | Percent |
|---|---|---|
| More than 3000 | 32 | 25.6% |
| 1001-2000 | 26 | 20.8% |
| 501-1000 | 20 | 16% |
| 251-500 | 19 | 15.2% |
| 2001-3000 | 14 | 11.2% |
| 101-250 | 13 | 10.4% |
| 1-20 | 1 | 0.8% |
Space Used
Amount of used disk space


| Used GB | Computers | Percent |
|---|---|---|
| 251-500 | 29 | 23.2% |
| 501-1000 | 20 | 16% |
| 101-250 | 19 | 15.2% |
| 1001-2000 | 17 | 13.6% |
| 51-100 | 13 | 10.4% |
| More than 3000 | 10 | 8% |
| 21-50 | 6 | 4.8% |
| 1-20 | 6 | 4.8% |
| 2001-3000 | 5 | 4% |
Malfunc. Drives
Drive models with a malfunction


| Model | Computers | Drives | Percent |
|---|---|---|---|
| ST3500418AS 500GB | 2 | 2 | 8.33% |
| Wildfire 120GB SSD | 1 | 1 | 4.17% |
| ST9500325AS 500GB | 1 | 1 | 4.17% |
| ST500DM002-1BD142 500GB | 1 | 1 | 4.17% |
| ST250DM000-1BD141 250GB | 1 | 1 | 4.17% |
| ST2000DM001-1CH164 2TB | 1 | 1 | 4.17% |
| ST1000LM044 HN-M101SAD 1TB | 1 | 1 | 4.17% |
| ST1000LM024 HN-M101MBB 1TB | 1 | 1 | 4.17% |
| SSD FTM32GX25H 32GB | 1 | 1 | 4.17% |
| SSD 850 PRO 256GB | 1 | 1 | 4.17% |
| SSD 840 EVO 250GB | 1 | 1 | 4.17% |
| SD8SN8U-256G-1006 256GB SSD | 1 | 1 | 4.17% |
| MZVLW256HEHP-000L7 256GB | 1 | 1 | 4.17% |
| MK5075GSX 500GB | 1 | 1 | 4.17% |
| M4-CT256M4SSD2 256GB | 1 | 1 | 4.17% |
| HTS545050A7E380 500GB | 1 | 1 | 4.17% |
| HDS724040ALE640 4TB | 1 | 1 | 4.17% |
| HD502HI 500GB | 1 | 1 | 4.17% |
| HD501LJ 500GB | 1 | 1 | 4.17% |
| HD322HJ 320GB | 1 | 1 | 4.17% |
| CT960M500SSD1 960GB | 1 | 1 | 4.17% |
| CT250MX500SSD1 250GB | 1 | 1 | 4.17% |
| CT1000P1SSD8 1TB | 1 | 1 | 4.17% |
Malfunc. Drive Vendor
Vendors of faulty drives


| Vendor | Computers | Drives | Percent |
|---|---|---|---|
| Seagate | 8 | 8 | 34.78% |
| Samsung Electronics | 5 | 6 | 21.74% |
| Crucial | 4 | 4 | 17.39% |
| Hitachi | 2 | 2 | 8.7% |
| Toshiba | 1 | 1 | 4.35% |
| SuperTalent | 1 | 1 | 4.35% |
| SanDisk | 1 | 1 | 4.35% |
| Patriot | 1 | 1 | 4.35% |
Malfunc. Drive Kind
Kinds of faulty drives


| Kind | Computers | Drives | Percent |
|---|---|---|---|
| HDD | 12 | 14 | 57.14% |
| SSD | 7 | 8 | 33.33% |
| NVMe | 2 | 2 | 9.52% |
Failed Drives
Failed drive models
Zero info for selected period =(
Failed Drive Vendor
Failed drive vendors
Zero info for selected period =(
Drive Status
Number of failed and malfunc. drives


| Status | Computers | Drives | Percent |
|---|---|---|---|
| Works | 103 | 187 | 70.55% |
| Detected | 22 | 40 | 15.07% |
| Malfunc | 21 | 24 | 14.38% |
Storage Vendor
Storage controller vendors


| Vendor | Computers | Percent |
|---|---|---|
| Intel | 67 | 39.18% |
| AMD | 46 | 26.9% |
| Samsung Electronics | 17 | 9.94% |
| Phison Electronics | 9 | 5.26% |
| Sandisk | 5 | 2.92% |
| Marvell Technology Group | 5 | 2.92% |
| ASMedia Technology | 5 | 2.92% |
| JMicron Technology | 3 | 1.75% |
| SK Hynix | 2 | 1.17% |
| Silicon Image | 2 | 1.17% |
| Nvidia | 2 | 1.17% |
| Micron/Crucial Technology | 2 | 1.17% |
| VIA Technologies | 1 | 0.58% |
| Toshiba America Info Systems | 1 | 0.58% |
| Silicon Motion | 1 | 0.58% |
| Seagate Technology | 1 | 0.58% |
| Lenovo | 1 | 0.58% |
| Broadcom / LSI | 1 | 0.58% |
Storage Model
Storage controller models


| Model | Computers | Percent |
|---|---|---|
| FCH SATA Controller [AHCI mode] | 31 | 15.12% |
| NVMe SSD Controller SM981/PM981/PM983 | 11 | 5.37% |
| 7 Series Chipset Family 6-port SATA Controller [AHCI mode] | 10 | 4.88% |
| SB7x0/SB8x0/SB9x0 IDE Controller | 9 | 4.39% |
| Sunrise Point-LP SATA Controller [AHCI mode] | 8 | 3.9% |
| SB7x0/SB8x0/SB9x0 SATA Controller [AHCI mode] | 8 | 3.9% |
| 8 Series/C220 Series Chipset Family 6-port SATA Controller 1 [AHCI mode] | 8 | 3.9% |
| SB7x0/SB8x0/SB9x0 SATA Controller [IDE mode] | 7 | 3.41% |
| E12 NVMe Controller | 7 | 3.41% |
| 300 Series Chipset SATA Controller | 6 | 2.93% |
| X370 Series Chipset SATA Controller | 5 | 2.44% |
| WD Black 2018/PC SN520 NVMe SSD | 5 | 2.44% |
| Non-Volatile memory controller | 5 | 2.44% |
| ASM1062 Serial ATA Controller | 5 | 2.44% |
| 82801 Mobile SATA Controller [RAID mode] | 5 | 2.44% |
| 400 Series Chipset SATA Controller | 5 | 2.44% |
| Q170/Q150/B150/H170/H110/Z170/CM236 Chipset SATA Controller [AHCI Mode] | 4 | 1.95% |
| NVMe SSD Controller SM961/PM961 | 4 | 1.95% |
| 6 Series/C200 Series Chipset Family 6 port Mobile SATA AHCI Controller | 4 | 1.95% |
| JMB363 SATA/IDE Controller | 3 | 1.46% |
| Cannon Lake Mobile PCH SATA AHCI Controller | 3 | 1.46% |
| 92xx SATA 6G Controller | 3 | 1.46% |
| 9 Series Chipset Family SATA Controller [AHCI Mode] | 3 | 1.46% |
| 200 Series PCH SATA controller [AHCI mode] | 3 | 1.46% |
| P1 NVMe PCIe SSD | 2 | 0.98% |
| NVMe SSD Controller SM951/PM951 | 2 | 0.98% |
| NM10/ICH7 Family SATA Controller [AHCI mode] | 2 | 0.98% |
| MCP61 SATA Controller | 2 | 0.98% |
| HM170/QM170 Chipset SATA Controller [AHCI Mode] | 2 | 0.98% |
| FCH SATA Controller D | 2 | 0.98% |
| Cannon Point-LP SATA Controller [AHCI Mode] | 2 | 0.98% |
| Cannon Lake PCH SATA AHCI Controller | 2 | 0.98% |
| 82801HM/HEM (ICH8M/ICH8M-E) SATA Controller [AHCI mode] | 2 | 0.98% |
| 82801HM/HEM (ICH8M/ICH8M-E) IDE Controller | 2 | 0.98% |
| 7 Series/C210 Series Chipset Family 6-port SATA Controller [AHCI mode] | 2 | 0.98% |
| 6 Series/C200 Series Chipset Family Desktop SATA Controller (IDE mode, ports 4-5) | 2 | 0.98% |
| 6 Series/C200 Series Chipset Family Desktop SATA Controller (IDE mode, ports 0-3) | 2 | 0.98% |
| X399 Series Chipset SATA Controller | 1 | 0.49% |
| Wildcat Point-LP SATA Controller [AHCI Mode] | 1 | 0.49% |
| VT82C586A/B/VT82C686/A/B/VT823x/A/C PIPC Bus Master IDE | 1 | 0.49% |
| VIA VT6420 SATA RAID Controller | 1 | 0.49% |
| Toshiba America Info Non-Volatile memory controller | 1 | 0.49% |
| SSD Pro 7600p/760p/E 6100p Series | 1 | 0.49% |
| SiI 3132 Serial ATA Raid II Controller | 1 | 0.49% |
| SiI 3114 [SATALink/SATARaid] Serial ATA Controller | 1 | 0.49% |
| SATA Controller [RAID mode] | 1 | 0.49% |
| MegaRAID SAS-3 3008 [Fury] | 1 | 0.49% |
| FCH IDE Controller | 1 | 0.49% |
| E7 NVMe Controller | 1 | 0.49% |
| E16 PCIe4 NVMe Controller | 1 | 0.49% |
| 88SE91A3 SATA-600 Controller | 1 | 0.49% |
| 88SE9125 PCIe SATA 6.0 Gb/s controller | 1 | 0.49% |
| 8 Series SATA Controller 1 [AHCI mode] | 1 | 0.49% |
| 6 Series/C200 Series Chipset Family 6 port Desktop SATA AHCI Controller | 1 | 0.49% |
Storage Kind
Kind of storage controller (IDE, SATA, NVMe, SAS, ...)


| Kind | Computers | Percent |
|---|---|---|
| SATA | 105 | 62.5% |
| NVMe | 38 | 22.62% |
| IDE | 17 | 10.12% |
| RAID | 8 | 4.76% |
CPU Vendor
Processor vendors


| Vendor | Computers | Percent |
|---|---|---|
| Intel | 76 | 60.8% |
| AMD | 49 | 39.2% |
CPU Model
Processor models


| Model | Computers | Percent |
|---|---|---|
| Intel Core i7-8750H CPU @ 2.20GHz | 4 | 3.2% |
| AMD Ryzen 7 1800X Eight-Core Processor | 4 | 3.2% |
| AMD Ryzen 5 2600 Six-Core Processor | 4 | 3.2% |
| Intel Core i7-8650U CPU @ 1.90GHz | 3 | 2.4% |
| Intel Core i5-8265U CPU @ 1.60GHz | 3 | 2.4% |
| Intel Core i5-8250U CPU @ 1.60GHz | 3 | 2.4% |
| Intel Core i5-6300U CPU @ 2.40GHz | 3 | 2.4% |
| Intel Core i3-3110M CPU @ 2.40GHz | 3 | 2.4% |
| AMD Ryzen 7 1700 Eight-Core Processor | 3 | 2.4% |
| AMD FX-8320 Eight-Core Processor | 3 | 2.4% |
| Intel Core i7-8550U CPU @ 1.80GHz | 2 | 1.6% |
| Intel Core i7-7500U CPU @ 2.70GHz | 2 | 1.6% |
| Intel Core i7-6700K CPU @ 4.00GHz | 2 | 1.6% |
| Intel Core i7-2670QM CPU @ 2.20GHz | 2 | 1.6% |
| Intel Core i5-8350U CPU @ 1.70GHz | 2 | 1.6% |
| Intel Core i5-3320M CPU @ 2.60GHz | 2 | 1.6% |
| Intel Core i5-2500 CPU @ 3.30GHz | 2 | 1.6% |
| AMD Ryzen 7 1700X Eight-Core Processor | 2 | 1.6% |
| AMD Ryzen 5 2400G with Radeon Vega Graphics | 2 | 1.6% |
| Intel Xeon CPU E3-1245 V2 @ 3.40GHz | 1 | 0.8% |
| Intel Core m3-8100Y CPU @ 1.10GHz | 1 | 0.8% |
| Intel Core i9-9900KF CPU @ 3.60GHz | 1 | 0.8% |
| Intel Core i7-9700 CPU @ 3.00GHz | 1 | 0.8% |
| Intel Core i7-8700K CPU @ 3.70GHz | 1 | 0.8% |
| Intel Core i7-8565U CPU @ 1.80GHz | 1 | 0.8% |
| Intel Core i7-7700HQ CPU @ 2.80GHz | 1 | 0.8% |
| Intel Core i7-6700HQ CPU @ 2.60GHz | 1 | 0.8% |
| Intel Core i7-6500U CPU @ 2.50GHz | 1 | 0.8% |
| Intel Core i7-4910MQ CPU @ 2.90GHz | 1 | 0.8% |
| Intel Core i7-4800MQ CPU @ 2.70GHz | 1 | 0.8% |
| Intel Core i7-4790 CPU @ 3.60GHz | 1 | 0.8% |
| Intel Core i7-4770K CPU @ 3.50GHz | 1 | 0.8% |
| Intel Core i7-4712MQ CPU @ 2.30GHz | 1 | 0.8% |
| Intel Core i7-3770 CPU @ 3.40GHz | 1 | 0.8% |
| Intel Core i7-3720QM CPU @ 2.60GHz | 1 | 0.8% |
| Intel Core i7-3630QM CPU @ 2.40GHz | 1 | 0.8% |
| Intel Core i5-8400H CPU @ 2.50GHz | 1 | 0.8% |
| Intel Core i5-7400 CPU @ 3.00GHz | 1 | 0.8% |
| Intel Core i5-7200U CPU @ 2.50GHz | 1 | 0.8% |
| Intel Core i5-6600 CPU @ 3.30GHz | 1 | 0.8% |
| Intel Core i5-6440HQ CPU @ 2.60GHz | 1 | 0.8% |
| Intel Core i5-6200U CPU @ 2.30GHz | 1 | 0.8% |
| Intel Core i5-5200U CPU @ 2.20GHz | 1 | 0.8% |
| Intel Core i5-4690 CPU @ 3.50GHz | 1 | 0.8% |
| Intel Core i5-4670 CPU @ 3.40GHz | 1 | 0.8% |
| Intel Core i5-4570 CPU @ 3.20GHz | 1 | 0.8% |
| Intel Core i5-4430 CPU @ 3.00GHz | 1 | 0.8% |
| Intel Core i5-4210M CPU @ 2.60GHz | 1 | 0.8% |
| Intel Core i5-4200U CPU @ 1.60GHz | 1 | 0.8% |
| Intel Core i5-4200M CPU @ 2.50GHz | 1 | 0.8% |
| Intel Core i5-3230M CPU @ 2.60GHz | 1 | 0.8% |
| Intel Core i5-3210M CPU @ 2.50GHz | 1 | 0.8% |
| Intel Core i5-2520M CPU @ 2.50GHz | 1 | 0.8% |
| Intel Core i5-2500K CPU @ 3.30GHz | 1 | 0.8% |
| Intel Core i5-2450M CPU @ 2.50GHz | 1 | 0.8% |
| Intel Core i5-2410M CPU @ 2.30GHz | 1 | 0.8% |
| Intel Core i3-6100 CPU @ 3.70GHz | 1 | 0.8% |
| Intel Core i3-2120 CPU @ 3.30GHz | 1 | 0.8% |
| Intel Core 2 Duo CPU T8300 @ 2.40GHz | 1 | 0.8% |
| Intel Core 2 Duo CPU T7700 @ 2.40GHz | 1 | 0.8% |
CPU Model Family
Processor model prefix


| Model | Computers | Percent |
|---|---|---|
| Intel Core i5 | 35 | 28% |
| Intel Core i7 | 29 | 23.2% |
| AMD Ryzen 7 | 11 | 8.8% |
| AMD Ryzen 5 | 8 | 6.4% |
| AMD FX | 8 | 6.4% |
| Intel Core i3 | 5 | 4% |
| AMD Phenom II X4 | 4 | 3.2% |
| AMD A8 | 4 | 3.2% |
| Intel Core 2 Duo | 2 | 1.6% |
| Intel Atom | 2 | 1.6% |
| AMD Athlon | 2 | 1.6% |
| AMD A6 | 2 | 1.6% |
| Other | 1 | 0.8% |
| Intel Xeon | 1 | 0.8% |
| Intel Core m3 | 1 | 0.8% |
| Intel Core i9 | 1 | 0.8% |
| AMD Ryzen Threadripper | 1 | 0.8% |
| AMD Ryzen 9 | 1 | 0.8% |
| AMD Ryzen 3 | 1 | 0.8% |
| AMD Phenom | 1 | 0.8% |
| AMD Opteron | 1 | 0.8% |
| AMD Athlon II X2 | 1 | 0.8% |
| AMD Athlon II | 1 | 0.8% |
| AMD Athlon 64 | 1 | 0.8% |
| AMD A10 | 1 | 0.8% |
CPU Cores
Number of processor cores


| Number | Computers | Percent |
|---|---|---|
| 4 | 54 | 43.2% |
| 2 | 38 | 30.4% |
| 8 | 13 | 10.4% |
| 6 | 11 | 8.8% |
| 1 | 6 | 4.8% |
| 32 | 1 | 0.8% |
| 12 | 1 | 0.8% |
| 3 | 1 | 0.8% |
CPU Sockets
Number of sockets


| Number | Computers | Percent |
|---|---|---|
| 1 | 125 | 100% |
CPU Threads
Threads per core (Hyper-Threading)


| Number | Computers | Percent |
|---|---|---|
| 2 | 97 | 77.6% |
| 1 | 28 | 22.4% |
CPU Op-Modes
CPU Operation Modes (32-bit, 64-bit)


| Op mode | Computers | Percent |
|---|---|---|
| 32-bit, 64-bit | 125 | 100% |
CPU Microarch
Microarchitecture


| Name | Computers | Percent |
|---|---|---|
| Skylake | 39 | 31.2% |
| Zen | 13 | 10.4% |
| Piledriver | 12 | 9.6% |
| Haswell | 12 | 9.6% |
| IvyBridge | 11 | 8.8% |
| SandyBridge | 9 | 7.2% |
| K10 | 7 | 5.6% |
| Zen+ | 6 | 4.8% |
| Zen 2 | 4 | 3.2% |
| K8 Hammer | 2 | 1.6% |
| Excavator | 2 | 1.6% |
| Core | 2 | 1.6% |
| Bulldozer | 2 | 1.6% |
| Bonnell | 2 | 1.6% |
| K10 Llano | 1 | 0.8% |
| Broadwell | 1 | 0.8% |
CPU Microcode
Microcode number


| Number | Computers | Percent |
|---|---|---|
| 0x306c3 | 11 | 8.8% |
| 0x306a9 | 11 | 8.8% |
| 0x806ea | 10 | 8% |
| 0x206a7 | 9 | 7.2% |
| 0x08001137 | 7 | 5.6% |
| 0x906ea | 6 | 4.8% |
| 0x06000852 | 6 | 4.8% |
| Unknown | 6 | 4.8% |
| 0x506e3 | 5 | 4% |
| 0x406e3 | 5 | 4% |
| 0x06001119 | 5 | 4% |
| 0x010000c8 | 5 | 4% |
| 0x806e9 | 4 | 3.2% |
| 0x0800820d | 4 | 3.2% |
| 0x08701013 | 3 | 2.4% |
| 0x08001138 | 3 | 2.4% |
| 0x906ed | 2 | 1.6% |
| 0x906e9 | 2 | 1.6% |
| 0x806ec | 2 | 1.6% |
| 0x806eb | 2 | 1.6% |
| 0x106ca | 2 | 1.6% |
| 0x0810100b | 2 | 1.6% |
| 0x06006705 | 2 | 1.6% |
| 0x0600063e | 2 | 1.6% |
| 0x6fb | 1 | 0.8% |
| 0x40651 | 1 | 0.8% |
| 0x306d4 | 1 | 0.8% |
| 0x10676 | 1 | 0.8% |
| 0x08108102 | 1 | 0.8% |
| 0x08101013 | 1 | 0.8% |
| 0x03000027 | 1 | 0.8% |
| 0x010000db | 1 | 0.8% |
| 0x01000095 | 1 | 0.8% |
GPU Vendor
Vendors of graphics cards


| Vendor | Computers | Percent |
|---|---|---|
| Intel | 61 | 42.07% |
| Nvidia | 44 | 30.34% |
| AMD | 38 | 26.21% |
| S3 Graphics | 1 | 0.69% |
| Matrox Electronics Systems | 1 | 0.69% |
GPU Model
Graphics card models


| Model | Computers | Percent |
|---|---|---|
| UHD Graphics 620 | 10 | 6.49% |
| Ellesmere [Radeon RX 470/480/570/570X/580/580X/590] | 10 | 6.49% |
| 3rd Gen Core processor Graphics Controller | 8 | 5.19% |
| 2nd Generation Core Processor Family Integrated Graphics Controller | 7 | 4.55% |
| UHD Graphics 630 (Mobile) | 5 | 3.25% |
| Skylake GT2 [HD Graphics 520] | 5 | 3.25% |
| 4th Gen Core Processor Integrated Graphics Controller | 5 | 3.25% |
| UHD Graphics 620 (Whiskey Lake) | 4 | 2.6% |
| GM204 [GeForce GTX 970] | 4 | 2.6% |
| Turks PRO [Radeon HD 6570/7570/8550] | 3 | 1.95% |
| Raven Ridge [Radeon Vega Series / Radeon Vega Mobile Series] | 3 | 1.95% |
| Navi 10 [Radeon RX 5600 OEM/5600 XT / 5700/5700 XT] | 3 | 1.95% |
| HD Graphics 620 | 3 | 1.95% |
| GP108M [GeForce MX150] | 3 | 1.95% |
| GP107M [GeForce GTX 1050 Ti Mobile] | 3 | 1.95% |
| Baffin [Radeon RX 460/560D / Pro 450/455/460/555/555X/560/560X] | 3 | 1.95% |
| Xeon E3-1200 v2/3rd Gen Core processor Graphics Controller | 2 | 1.3% |
| Stoney [Radeon R2/R3/R4/R5 Graphics] | 2 | 1.3% |
| Mobile GM965/GL960 Integrated Graphics Controller (secondary) | 2 | 1.3% |
| Mobile GM965/GL960 Integrated Graphics Controller (primary) | 2 | 1.3% |
| HD Graphics 530 | 2 | 1.3% |
| GP108 [GeForce GT 1030] | 2 | 1.3% |
| GP107M [GeForce GTX 1050 Mobile] | 2 | 1.3% |
| GP106 [GeForce GTX 1060 6GB] | 2 | 1.3% |
| GP104 [GeForce GTX 1080] | 2 | 1.3% |
| Atom Processor D4xx/D5xx/N4xx/N5xx Integrated Graphics Controller | 2 | 1.3% |
| Xeon E3-1200 v3/4th Gen Core Processor Integrated Graphics Controller | 1 | 0.65% |
| Whistler [Radeon HD 6730M/6770M/7690M XT] | 1 | 0.65% |
| Vega 20 [Radeon VII] | 1 | 0.65% |
| Vega 10 XL/XT [Radeon RX Vega 56/64] | 1 | 0.65% |
| UHD Graphics 630 (Desktop 9 Series) | 1 | 0.65% |
| UHD Graphics 615 | 1 | 0.65% |
| TU116 [GeForce GTX 1660 SUPER] | 1 | 0.65% |
| TU104 [GeForce RTX 2080] | 1 | 0.65% |
| Trinity [Radeon HD 7640G] | 1 | 0.65% |
| Trinity [Radeon HD 7560D] | 1 | 0.65% |
| Sun PRO [Radeon HD 8570A/8570M] | 1 | 0.65% |
| Sumo [Radeon HD 6620G] | 1 | 0.65% |
| RV730 XT [Radeon HD 4670] | 1 | 0.65% |
| RV710/M92 [Mobility Radeon HD 4350/4550] | 1 | 0.65% |
| RS880 [Radeon HD 4250] | 1 | 0.65% |
| Richland [Radeon HD 8650G] | 1 | 0.65% |
| Richland [Radeon HD 8570D] | 1 | 0.65% |
| Picasso | 1 | 0.65% |
| Oland PRO [Radeon R7 240/340] | 1 | 0.65% |
| MGA G200eW WPCM450 | 1 | 0.65% |
| Mars XTX [Radeon HD 8790M] | 1 | 0.65% |
| Lexa [Radeon 540X/550X/630 / RX 640 / E9171 MCM] | 1 | 0.65% |
| Lexa PRO [Radeon 540/540X/550/550X / RX 540X/550/550X] | 1 | 0.65% |
| Jet PRO [Radeon R5 M230 / R7 M260DX / Radeon 520 Mobile] | 1 | 0.65% |
| HD Graphics 630 | 1 | 0.65% |
| HD Graphics 5500 | 1 | 0.65% |
| Haswell-ULT Integrated Graphics Controller | 1 | 0.65% |
| GT218 [GeForce 210] | 1 | 0.65% |
| GP107 [GeForce GTX 1050] | 1 | 0.65% |
| GP107 [GeForce GTX 1050 Ti] | 1 | 0.65% |
| GP106M [GeForce GTX 1060 Mobile] | 1 | 0.65% |
| GP106 [GeForce GTX 1060 3GB] | 1 | 0.65% |
| GP104 [GeForce GTX 1070] | 1 | 0.65% |
| GM206 [GeForce GTX 960] | 1 | 0.65% |
GPU Combo
Combinations of graphics cards


| Name | Computers | Percent |
|---|---|---|
| 1 x Intel | 41 | 32.8% |
| 1 x AMD | 31 | 24.8% |
| 1 x Nvidia | 24 | 19.2% |
| Intel + Nvidia | 17 | 13.6% |
| 2 x AMD | 5 | 4% |
| 2 x Nvidia | 2 | 1.6% |
| Intel + AMD | 2 | 1.6% |
| 1 x S3 Graphics | 1 | 0.8% |
| 1 x Matrox | 1 | 0.8% |
| Intel + 2 x Nvidia | 1 | 0.8% |
GPU Driver
Free vs proprietary


| Driver | Computers | Percent |
|---|---|---|
| Free | 93 | 74.4% |
| Proprietary | 30 | 24% |
| Unknown | 2 | 1.6% |
GPU Memory
Total video memory


| Size in GB | Computers | Percent |
|---|---|---|
| Unknown | 55 | 44% |
| 1.01-2.0 | 22 | 17.6% |
| 3.01-4.0 | 13 | 10.4% |
| 7.01-8.0 | 11 | 8.8% |
| 0.51-1.0 | 11 | 8.8% |
| 0.01-0.5 | 9 | 7.2% |
| 5.01-6.0 | 2 | 1.6% |
| 2.01-3.0 | 1 | 0.8% |
| 8.01-16.0 | 1 | 0.8% |
Monitor Vendor
Monitor vendors


| Vendor | Computers | Percent |
|---|---|---|
| Samsung Electronics | 28 | 19.58% |
| LG Display | 18 | 12.59% |
| AU Optronics | 13 | 9.09% |
| Chimei Innolux | 12 | 8.39% |
| Goldstar | 11 | 7.69% |
| Hewlett-Packard | 8 | 5.59% |
| Ancor Communications | 8 | 5.59% |
| BOE | 7 | 4.9% |
| Acer | 5 | 3.5% |
| Philips | 4 | 2.8% |
| Iiyama | 3 | 2.1% |
| Dell | 3 | 2.1% |
| Lenovo | 2 | 1.4% |
| Fujitsu Siemens | 2 | 1.4% |
| Chi Mei Optoelectronics | 2 | 1.4% |
| AOC | 2 | 1.4% |
| ___ | 1 | 0.7% |
| ViewSonic | 1 | 0.7% |
| Vestel Elektronik | 1 | 0.7% |
| Unknown | 1 | 0.7% |
| Sharp | 1 | 0.7% |
| Sceptre Tech | 1 | 0.7% |
| PRI | 1 | 0.7% |
| LG Electronics | 1 | 0.7% |
| InfoVision | 1 | 0.7% |
| Hitachi | 1 | 0.7% |
| HannStar | 1 | 0.7% |
| Eizo | 1 | 0.7% |
| BenQ | 1 | 0.7% |
| ASUSTek Computer | 1 | 0.7% |
| Advanced Micro Devices | 1 | 0.7% |
Monitor Model
Monitor models


| Model | Computers | Percent |
|---|---|---|
| Z27 HPN3537 3840x2160 597x336mm 27.0-inch | 2 | 1.35% |
| Ultra HD GSM5B09 3840x2160 600x340mm 27.2-inch | 2 | 1.35% |
| LG ULTRAWIDE GSM59F1 1920x1080 580x240mm 24.7-inch | 2 | 1.35% |
| LCD Monitor SEC324C 1366x768 353x198mm 15.9-inch | 2 | 1.35% |
| LCD Monitor SAM0F14 3840x2160 1872x1053mm 84.6-inch | 2 | 1.35% |
| LCD Monitor LGD05D0 1920x1080 344x194mm 15.5-inch | 2 | 1.35% |
| LCD Monitor LGD046F 1920x1080 344x194mm 15.5-inch | 2 | 1.35% |
| LCD Monitor CMN1490 1366x768 309x173mm 13.9-inch | 2 | 1.35% |
| LCD Monitor BOE06EE 1920x1080 309x173mm 13.9-inch | 2 | 1.35% |
| LCD Monitor AUO21ED 1920x1080 344x194mm 15.5-inch | 2 | 1.35% |
| LCD Monitor AUO139E 1600x900 382x214mm 17.2-inch | 2 | 1.35% |
| Z27 HPN3536 3840x2160 597x336mm 27.0-inch | 1 | 0.68% |
| w1907 HWP26A2 1440x900 408x255mm 18.9-inch | 1 | 0.68% |
| VX228 ACI22C1 1920x1080 476x268mm 21.5-inch | 1 | 0.68% |
| VX2263 Series VSC692F 1920x1080 476x268mm 21.5-inch | 1 | 0.68% |
| VA326 AUS32DA 1920x1080 698x393mm 31.5-inch | 1 | 0.68% |
| ULTRAWIDE GSM5A29 2560x1080 677x290mm 29.0-inch | 1 | 0.68% |
| U32J59x SAM0F34 3840x2160 697x392mm 31.5-inch | 1 | 0.68% |
| U28E590 SAM0C4D 3840x2160 607x345mm 27.5-inch | 1 | 0.68% |
| U2415 DELA0B9 1920x1080 518x324mm 24.1-inch | 1 | 0.68% |
| U2414H DELA0B2 1920x1080 530x300mm 24.0-inch | 1 | 0.68% |
| SyncMaster SAM0524 1920x1080 477x268mm 21.5-inch | 1 | 0.68% |
| SyncMaster SAM02D9 1680x1050 433x271mm 20.1-inch | 1 | 0.68% |
| SyncMaster SAM02B6 1920x1200 518x324mm 24.1-inch | 1 | 0.68% |
| SyncMaster SAM02B5 1920x1200 518x324mm 24.1-inch | 1 | 0.68% |
| SyncMaster SAM0214 1680x1050 408x306mm 20.1-inch | 1 | 0.68% |
| SyncMaster SAM011E 1280x1024 338x270mm 17.0-inch | 1 | 0.68% |
| SA300/SA350 SAM0789 1366x768 410x230mm 18.5-inch | 1 | 0.68% |
| S24E310 SAM0C2F 1920x1080 521x293mm 23.5-inch | 1 | 0.68% |
| S24D590 SAM0B47 1920x1080 520x290mm 23.4-inch | 1 | 0.68% |
| S24D330 SAM0D92 1920x1080 531x299mm 24.0-inch | 1 | 0.68% |
| S24B420 SAM097B 1920x1200 518x324mm 24.1-inch | 1 | 0.68% |
| S24B150 SAM0983 1680x1050 520x290mm 23.4-inch | 1 | 0.68% |
| S22D390 SAM0B62 1920x1080 477x268mm 21.5-inch | 1 | 0.68% |
| S22B300 SAM08AA 1920x1080 477x268mm 21.5-inch | 1 | 0.68% |
| PL2792Q IVM6630 2560x1440 597x336mm 27.0-inch | 1 | 0.68% |
| PL2783Q IVM661F 2560x1440 597x336mm 27.0-inch | 1 | 0.68% |
| PL2783Q IVM661D 2560x1440 597x336mm 27.0-inch | 1 | 0.68% |
| PHL 223V5 PHLC0CF 1920x1080 480x270mm 21.7-inch | 1 | 0.68% |
| LP156WH2-TLRA LGD026B 1366x768 344x194mm 15.5-inch | 1 | 0.68% |
| LG FULL HD GSM5ABB 1920x1080 480x270mm 21.7-inch | 1 | 0.68% |
| LE55G508 HTC010B 1920x1080 | 1 | 0.68% |
| LCDTV16 ___0101 1600x1200 1600x900mm 72.3-inch | 1 | 0.68% |
| LCDTV16 0101 1920x1080 1600x900mm 72.3-inch | 1 | 0.68% |
| LCD SHP0FEA 1360x768 | 1 | 0.68% |
| LCD Monitor TV 3840x1200 | 1 | 0.68% |
| LCD Monitor TV | 1 | 0.68% |
| LCD Monitor SyncMaster 1920x1080 | 1 | 0.68% |
| LCD Monitor SEC324A 1366x768 344x194mm 15.5-inch | 1 | 0.68% |
| LCD Monitor SEC3152 1366x768 344x194mm 15.5-inch | 1 | 0.68% |
| LCD Monitor SEC3150 1366x768 344x193mm 15.5-inch | 1 | 0.68% |
| LCD Monitor SEC3130 1024x600 223x125mm 10.1-inch | 1 | 0.68% |
| LCD Monitor SDC4652 1366x768 344x194mm 15.5-inch | 1 | 0.68% |
| LCD Monitor SDC4447 1366x768 340x190mm 15.3-inch | 1 | 0.68% |
| LCD Monitor SAM0B60 1920x1080 1060x590mm 47.8-inch | 1 | 0.68% |
| LCD Monitor S24D330 3840x1080 | 1 | 0.68% |
| LCD Monitor S24D330 | 1 | 0.68% |
| LCD Monitor S2402W 1920x1200 | 1 | 0.68% |
| LCD Monitor LGD0590 1920x1080 344x194mm 15.5-inch | 1 | 0.68% |
| LCD Monitor LGD0563 1920x1080 344x194mm 15.5-inch | 1 | 0.68% |
Monitor Resolution
Monitor screen resolution


| Resolution | Computers | Percent |
|---|---|---|
| 1920x1080 (FHD) | 62 | 44.93% |
| 1366x768 (WXGA) | 22 | 15.94% |
| 3840x2160 (4K) | 9 | 6.52% |
| 2560x1440 (QHD) | 8 | 5.8% |
| 1600x900 (HD+) | 7 | 5.07% |
| 2560x1080 | 5 | 3.62% |
| 1920x1200 (WUXGA) | 5 | 3.62% |
| 1680x1050 (WSXGA+) | 5 | 3.62% |
| 1280x1024 (SXGA) | 3 | 2.17% |
| 1440x900 (WXGA+) | 2 | 1.45% |
| 1360x768 | 2 | 1.45% |
| Unknown | 2 | 1.45% |
| 3840x1200 | 1 | 0.72% |
| 3840x1080 | 1 | 0.72% |
| 1600x1200 | 1 | 0.72% |
| 1280x800 (WXGA) | 1 | 0.72% |
| 1024x768 (XGA) | 1 | 0.72% |
| 1024x600 | 1 | 0.72% |
Monitor Diagonal
Diagonal size in inches


| Inches | Computers | Percent |
|---|---|---|
| 15 | 35 | 24.65% |
| 27 | 16 | 11.27% |
| 21 | 10 | 7.04% |
| 13 | 10 | 7.04% |
| 23 | 9 | 6.34% |
| 14 | 9 | 6.34% |
| 24 | 8 | 5.63% |
| 17 | 8 | 5.63% |
| Unknown | 8 | 5.63% |
| 18 | 5 | 3.52% |
| 12 | 4 | 2.82% |
| 40 | 3 | 2.11% |
| 31 | 3 | 2.11% |
| 22 | 3 | 2.11% |
| 32 | 2 | 1.41% |
| 28 | 2 | 1.41% |
| 20 | 2 | 1.41% |
| 72 | 1 | 0.7% |
| 34 | 1 | 0.7% |
| 29 | 1 | 0.7% |
| 19 | 1 | 0.7% |
| 10 | 1 | 0.7% |
Monitor Width
Physical width


| Width in mm | Computers | Percent |
|---|---|---|
| 301-350 | 52 | 37.14% |
| 501-600 | 32 | 22.86% |
| 401-500 | 20 | 14.29% |
| 201-300 | 8 | 5.71% |
| Unknown | 8 | 5.71% |
| 601-700 | 7 | 5% |
| 351-400 | 7 | 5% |
| 801-900 | 3 | 2.14% |
| 701-800 | 2 | 1.43% |
| 1501-2000 | 1 | 0.71% |
Aspect Ratio
Proportional relationship between the width and the height


| Ratio | Computers | Percent |
|---|---|---|
| 16/9 | 103 | 79.23% |
| 16/10 | 11 | 8.46% |
| Unknown | 6 | 4.62% |
| 21/9 | 4 | 3.08% |
| 5/4 | 3 | 2.31% |
| 4/3 | 3 | 2.31% |
Monitor Area
Area in inch²
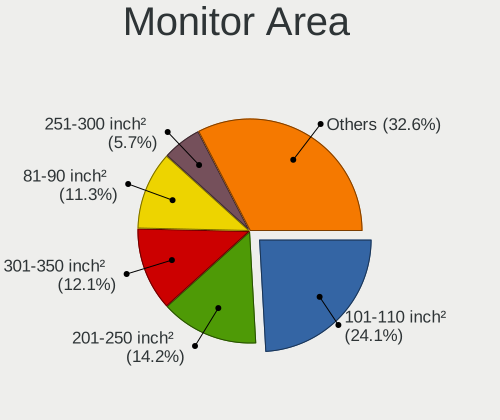

| Area in inch² | Computers | Percent |
|---|---|---|
| 101-110 | 34 | 24.11% |
| 201-250 | 20 | 14.18% |
| 301-350 | 17 | 12.06% |
| 81-90 | 16 | 11.35% |
| 251-300 | 8 | 5.67% |
| 151-200 | 8 | 5.67% |
| Unknown | 8 | 5.67% |
| 141-150 | 6 | 4.26% |
| 351-500 | 5 | 3.55% |
| 121-130 | 5 | 3.55% |
| 71-80 | 4 | 2.84% |
| 61-70 | 3 | 2.13% |
| 501-1000 | 3 | 2.13% |
| More than 1000 | 1 | 0.71% |
| 41-50 | 1 | 0.71% |
| 131-140 | 1 | 0.71% |
| 91-100 | 1 | 0.71% |
Pixel Density
Pixels per inch


| Density | Computers | Percent |
|---|---|---|
| 101-120 | 39 | 29.1% |
| 51-100 | 38 | 28.36% |
| 121-160 | 35 | 26.12% |
| 161-240 | 12 | 8.96% |
| Unknown | 8 | 5.97% |
| 1-50 | 2 | 1.49% |
Multiple Monitors
Total monitors connected


| Total | Computers | Percent |
|---|---|---|
| 1 | 98 | 78.4% |
| 2 | 22 | 17.6% |
| 0 | 3 | 2.4% |
| 3 | 2 | 1.6% |
Net Controller Vendor
Controller vendors


| Vendor | Computers | Percent |
|---|---|---|
| Intel | 22 | 70.97% |
| Realtek Semiconductor | 2 | 6.45% |
| Nvidia | 2 | 6.45% |
| MediaTek | 1 | 3.23% |
| Holtek Semiconductor | 1 | 3.23% |
| D-Link | 1 | 3.23% |
| Broadcom Inc. and subsidiaries | 1 | 3.23% |
| Arduino SA | 1 | 3.23% |
Net Controller Model
Controller models


| Model | Computers | Percent |
|---|---|---|
| 82579LM Gigabit Network Connection (Lewisville) | 7 | 18.42% |
| I211 Gigabit Network Connection | 6 | 15.79% |
| Centrino Advanced-N 6205 [Taylor Peak] | 4 | 10.53% |
| Wireless 8265 / 8275 | 3 | 7.89% |
| MCP61 Ethernet | 2 | 5.26% |
| Centrino Ultimate-N 6300 | 2 | 5.26% |
| Centrino Advanced-N 6235 | 2 | 5.26% |
| 82574L Gigabit Network Connection | 2 | 5.26% |
| Wireless Gigabit 17265 Device Driver | 1 | 2.63% |
| Wi-Fi 6 AX200 | 1 | 2.63% |
| Uno R3 (CDC ACM) | 1 | 2.63% |
| RTL8187 Wireless LAN Adapter | 1 | 2.63% |
| RTL8153 Gigabit Ethernet Adapter | 1 | 2.63% |
| Power Ice Evo | 1 | 2.63% |
| OSA Express Network card | 1 | 2.63% |
| Network controller | 1 | 2.63% |
| I210 Gigabit Network Connection | 1 | 2.63% |
| DWA-140 RangeBooster N Adapter(rev.B3) [Ralink RT5372] | 1 | 2.63% |
Net Controller Kind
Ethernet, WiFi or modem


| Kind | Computers | Percent |
|---|---|---|
| Ethernet | 19 | 51.35% |
| WiFi | 15 | 40.54% |
| Unknown | 2 | 5.41% |
| Modem | 1 | 2.7% |
Used Controller
Currently used network controller


| Kind | Computers | Percent |
|---|---|---|
| Ethernet | 14 | 56% |
| WiFi | 11 | 44% |
NICs
Total network controllers on board


| Total | Computers | Percent |
|---|---|---|
| 2 | 72 | 57.6% |
| 1 | 50 | 40% |
| 3 | 2 | 1.6% |
| 4 | 1 | 0.8% |
Unsupported Devices
Total unsupported devices on board


| Total | Computers | Percent |
|---|---|---|
| 0 | 99 | 79.2% |
| 1 | 23 | 18.4% |
| 2 | 2 | 1.6% |
| 3 | 1 | 0.8% |
Unsupported Device Types
Types of unsupported devices


| Type | Computers | Percent |
|---|---|---|
| Fingerprint reader | 8 | 27.59% |
| Chipcard | 8 | 27.59% |
| Graphics card | 6 | 20.69% |
| Net/wireless | 2 | 6.9% |
| Storage | 1 | 3.45% |
| Sound | 1 | 3.45% |
| Network | 1 | 3.45% |
| Communication controller | 1 | 3.45% |
| Card reader | 1 | 3.45% |