Zorin Hardware Trends (Desktop)
A project to identify most popular hardware characteristics and track their change over time based on data collected by Zorin users at https://Linux-Hardware.org.
Anyone can contribute to the study by uploading probes of their computers by the hw-probe tool:
sudo -E hw-probe -all -uploadFull-feature report is available here: https://linux-hardware.org/?view=trends&formfactor=desktop
Period: Nov, 2020.
Contents
- OS
- OS Family
- Kernel
- Kernel Family
- Kernel Major Ver.
- Arch
- DE
- Display Server
- Display Manager
- OS Lang
- Boot Mode
- Filesystem
- Part. scheme
- Dual Boot with Linux/BSD
- Dual Boot (Win)
- Country
- City
- Vendor
- Model
- Model Family
- MFG Year
- Form Factor
- Secure Boot
- Coreboot
- RAM Size
- RAM Used
- Has CD-ROM
- Total Drives
- Has Ethernet
- Drive Vendor
- Drive Model
- HDD Vendor
- SSD Vendor
- Drive Kind
- Drive Connector
- Drive Size
- Space Total
- Space Used
- Malfunc. Drives
- Malfunc. Drive Vendor
- Malfunc. HDD Vendor
- Malfunc. Drive Kind
- Failed Drives
- Failed Drive Vendor
- Drive Status
- Storage Vendor
- Storage Model
- Storage Kind
- CPU Vendor
- CPU Model
- CPU Model Family
- CPU Cores
- CPU Sockets
- CPU Threads
- CPU Op-Modes
- CPU Microcode
- CPU Microarch
- GPU Vendor
- GPU Model
- GPU Combo
- GPU Driver
- GPU Memory
- Monitor Vendor
- Monitor Model
- Monitor Resolution
- Monitor Diagonal
- Monitor Width
- Aspect Ratio
- Monitor Area
- Pixel Density
- Multiple Monitors
- Net Controller Vendor
- Net Controller Model
- Wireless Vendor
- Wireless Model
- Ethernet Vendor
- Ethernet Model
- Net Controller Kind
- Used Controller
- NICs
- Memory Vendor
- Memory Model
- Memory Kind
- Memory Form Factor
- Memory Size
- Memory Speed
- Sound Vendor
- Sound Model
- Camera Vendor
- Camera Model
- Fingerprint Vendor
- Fingerprint Model
- Chipcard Vendor
- Chipcard Model
- Printer Vendor
- Printer Model
- Scanner Vendor
- Scanner Model
- Bluetooth Vendor
- Bluetooth Model
- Unsupported Devices
- Unsupported Device Types
OS
Installed operating systems


| Name | Desktops | Percent |
|---|---|---|
| Zorin 15 | 15 | 88.24% |
| Zorin 12 | 2 | 11.76% |
OS Family
OS without a version


| Name | Desktops | Percent |
|---|---|---|
| Zorin | 17 | 100% |
Kernel
Version of the Linux kernel


| Version | Desktops | Percent |
|---|---|---|
| 5.4.0-54-generic | 8 | 47.06% |
| 5.4.0-52-generic | 4 | 23.53% |
| 5.4.0-53-generic | 3 | 17.65% |
| 4.15.0-123-generic | 2 | 11.76% |
Kernel Family
Linux kernel without a distro release


| Version | Desktops | Percent |
|---|---|---|
| 5.4.0 | 15 | 88.24% |
| 4.15.0 | 2 | 11.76% |
Kernel Major Ver.
Linux kernel major version


| Version | Desktops | Percent |
|---|---|---|
| 5.4 | 15 | 88.24% |
| 4.15 | 2 | 11.76% |
Arch
OS architecture (x86_64, i586, etc.)


| Name | Desktops | Percent |
|---|---|---|
| x86_64 | 14 | 82.35% |
| i686 | 3 | 17.65% |
DE
Desktop Environment


| Name | Desktops | Percent |
|---|---|---|
| XFCE | 9 | 52.94% |
| GNOME | 8 | 47.06% |
Display Server
X11 or Wayland


| Name | Desktops | Percent |
|---|---|---|
| X11 | 17 | 100% |
Display Manager
SDDM, LightDM, etc.


| Name | Desktops | Percent |
|---|---|---|
| Unknown | 17 | 100% |
OS Lang
Language


| Lang | Desktops | Percent |
|---|---|---|
| en_US | 7 | 41.18% |
| en_GB | 2 | 11.76% |
| pt_BR | 1 | 5.88% |
| pl_PL | 1 | 5.88% |
| nl_NL | 1 | 5.88% |
| nl_BE | 1 | 5.88% |
| ja_JP | 1 | 5.88% |
| it_IT | 1 | 5.88% |
| en_CA | 1 | 5.88% |
| de_DE | 1 | 5.88% |
Boot Mode
EFI or BIOS


| Mode | Desktops | Percent |
|---|---|---|
| BIOS | 15 | 88.24% |
| EFI | 2 | 11.76% |
Filesystem
Type of filesystem


| Type | Desktops | Percent |
|---|---|---|
| Ext4 | 17 | 100% |
Part. scheme
Scheme of partitioning


| Type | Desktops | Percent |
|---|---|---|
| Unknown | 17 | 100% |
Dual Boot with Linux/BSD
Hosting more than one Linux/BSD


| Dual boot | Desktops | Percent |
|---|---|---|
| No | 12 | 70.59% |
| Yes | 5 | 29.41% |
Dual Boot (Win)
Hosting Linux and Windows


| Dual boot | Desktops | Percent |
|---|---|---|
| No | 11 | 64.71% |
| Yes | 6 | 35.29% |
Country
Geographic location (country)


| Country | Desktops | Percent |
|---|---|---|
| USA | 3 | 17.65% |
| UK | 2 | 11.76% |
| Netherlands | 2 | 11.76% |
| Greece | 2 | 11.76% |
| Germany | 2 | 11.76% |
| Serbia | 1 | 5.88% |
| Japan | 1 | 5.88% |
| Italy | 1 | 5.88% |
| Canada | 1 | 5.88% |
| Brazil | 1 | 5.88% |
| Belgium | 1 | 5.88% |
City
Geographic location (city)


| City | Desktops | Percent |
|---|---|---|
| Wennigsen | 1 | 5.88% |
| Someren | 1 | 5.88% |
| Sint Willebrord | 1 | 5.88% |
| Richmond | 1 | 5.88% |
| Nustrow | 1 | 5.88% |
| Newmarket | 1 | 5.88% |
| Minato-ku | 1 | 5.88% |
| Milan | 1 | 5.88% |
| Mesquita | 1 | 5.88% |
| Lovendegem | 1 | 5.88% |
| Littleton | 1 | 5.88% |
| Kilsby | 1 | 5.88% |
| Ialysos | 1 | 5.88% |
| Haviland | 1 | 5.88% |
| Gilbertsville | 1 | 5.88% |
| Belgrade | 1 | 5.88% |
| Athens | 1 | 5.88% |
Vendor
Motherboard manufacturer


| Name | Desktops | Percent |
|---|---|---|
| Gigabyte Technology | 5 | 29.41% |
| Hewlett-Packard | 2 | 11.76% |
| Dell | 2 | 11.76% |
| ASUSTek Computer | 2 | 11.76% |
| ASRock | 2 | 11.76% |
| MSI | 1 | 5.88% |
| Medion | 1 | 5.88% |
| Acer | 1 | 5.88% |
| Unknown | 1 | 5.88% |
Model
Motherboard model


| Name | Desktops | Percent |
|---|---|---|
| MSI EG763AA-B14 a1209.be | 1 | 5.88% |
| Medion MS-7857 | 1 | 5.88% |
| HP Compaq dc7600 Small Form Factor | 1 | 5.88% |
| HP Compaq 8100 Elite SFF PC | 1 | 5.88% |
| Gigabyte H87M-HD3 | 1 | 5.88% |
| Gigabyte GA-770TA-UD3 | 1 | 5.88% |
| Gigabyte G31M-S2C | 1 | 5.88% |
| Gigabyte AM1M-S2H | 1 | 5.88% |
| Gigabyte 970A-DS3P | 1 | 5.88% |
| Dell OptiPlex 755 | 1 | 5.88% |
| Dell Dimension E521 | 1 | 5.88% |
| ASUS P5KPL-CM | 1 | 5.88% |
| ASUS GN566AA-ABA s3200n | 1 | 5.88% |
| ASRock X370 Professional Gaming | 1 | 5.88% |
| ASRock ConRoeXFire-eSATA2 | 1 | 5.88% |
| Acer Aspire T180 | 1 | 5.88% |
| Unknown | 1 | 5.88% |
Model Family
Motherboard model prefix


| Name | Desktops | Percent |
|---|---|---|
| HP Compaq | 2 | 11.76% |
| MSI EG763AA-B14 | 1 | 5.88% |
| Medion MS-7857 | 1 | 5.88% |
| Gigabyte H87M-HD3 | 1 | 5.88% |
| Gigabyte GA-770TA-UD3 | 1 | 5.88% |
| Gigabyte G31M-S2C | 1 | 5.88% |
| Gigabyte AM1M-S2H | 1 | 5.88% |
| Gigabyte 970A-DS3P | 1 | 5.88% |
| Dell OptiPlex | 1 | 5.88% |
| Dell Dimension | 1 | 5.88% |
| ASUS P5KPL-CM | 1 | 5.88% |
| ASUS GN566AA-ABA | 1 | 5.88% |
| ASRock X370 | 1 | 5.88% |
| ASRock ConRoeXFire-eSATA2 | 1 | 5.88% |
| Acer Aspire | 1 | 5.88% |
| Unknown | 1 | 5.88% |
MFG Year
Motherboard manufacture year


| Year | Desktops | Percent |
|---|---|---|
| 2013 | 2 | 11.76% |
| 2010 | 2 | 11.76% |
| 2009 | 2 | 11.76% |
| 2007 | 2 | 11.76% |
| 2006 | 2 | 11.76% |
| 2018 | 1 | 5.88% |
| 2017 | 1 | 5.88% |
| 2016 | 1 | 5.88% |
| 2014 | 1 | 5.88% |
| 2012 | 1 | 5.88% |
| 2011 | 1 | 5.88% |
| 2005 | 1 | 5.88% |
Form Factor
Physical design of the computer


| Name | Desktops | Percent |
|---|---|---|
| Desktop | 17 | 100% |
Secure Boot
Enabled or disabled


| State | Desktops | Percent |
|---|---|---|
| Disabled | 17 | 100% |
Coreboot
Have coreboot on board


| Used | Desktops | Percent |
|---|---|---|
| No | 17 | 100% |
RAM Size
Total RAM memory


| Size in GB | Desktops | Percent |
|---|---|---|
| 3.01-4.0 | 7 | 41.18% |
| 2.01-3.0 | 3 | 17.65% |
| 16.01-24.0 | 3 | 17.65% |
| 4.01-8.0 | 2 | 11.76% |
| 8.01-16.0 | 1 | 5.88% |
| 0.01-1.0 | 1 | 5.88% |
RAM Used
Used RAM memory


| Used GB | Desktops | Percent |
|---|---|---|
| 1.01-2.0 | 9 | 52.94% |
| 0.01-1.0 | 6 | 35.29% |
| 2.01-3.0 | 2 | 11.76% |
Has CD-ROM
Has CD-ROM on board


| Presented | Desktops | Percent |
|---|---|---|
| Yes | 12 | 70.59% |
| No | 5 | 29.41% |
Total Drives
Number of drives on board


| Drives | Desktops | Percent |
|---|---|---|
| 2 | 7 | 41.18% |
| 1 | 7 | 41.18% |
| 3 | 2 | 11.76% |
| 4 | 1 | 5.88% |
Has Ethernet
Has Ethernet on board


| Presented | Desktops | Percent |
|---|---|---|
| Yes | 17 | 100% |
Drive Vendor
Hard drive vendors


| Vendor | Desktops | Drives | Percent |
|---|---|---|---|
| Seagate | 6 | 8 | 25% |
| WDC | 3 | 4 | 12.5% |
| Samsung Electronics | 3 | 3 | 12.5% |
| Toshiba | 2 | 2 | 8.33% |
| Hitachi | 2 | 2 | 8.33% |
| SPCC | 1 | 1 | 4.17% |
| SanDisk | 1 | 1 | 4.17% |
| PNY | 1 | 1 | 4.17% |
| Maxtor | 1 | 1 | 4.17% |
| Leven | 1 | 1 | 4.17% |
| Intenso | 1 | 1 | 4.17% |
| DREVO | 1 | 1 | 4.17% |
| China | 1 | 1 | 4.17% |
Drive Model
Hard drive models


| Model | Desktops | Percent |
|---|---|---|
| WDC WD40EZRZ-00GXCB0 4TB | 1 | 3.7% |
| WDC WD40EZRX-00SPEB0 4TB | 1 | 3.7% |
| WDC WD2500AAJS-07M0A0 250GB | 1 | 3.7% |
| WDC WD1600AAJS-75WAA0 160GB | 1 | 3.7% |
| Toshiba MK1246GSX 120GB | 1 | 3.7% |
| Toshiba HDWD110 1TB | 1 | 3.7% |
| SPCC Solid State Disk 256GB | 1 | 3.7% |
| Seagate ST9500325AS 500GB | 1 | 3.7% |
| Seagate ST4000DM004-2CV104 4TB | 1 | 3.7% |
| Seagate ST3250318AS 250GB | 1 | 3.7% |
| Seagate ST3160815AS 160GB | 1 | 3.7% |
| Seagate ST3160023AS 160GB | 1 | 3.7% |
| Seagate ST3120827AS 120GB | 1 | 3.7% |
| Seagate ST3000DM001-1CH166 3TB | 1 | 3.7% |
| Seagate ST2000DM001-1CH164 2TB | 1 | 3.7% |
| SanDisk SDSSDHP256G 256GB | 1 | 3.7% |
| Samsung SSD 860 EVO 500GB | 1 | 3.7% |
| Samsung SSD 850 EVO 500GB | 1 | 3.7% |
| Samsung HD161GJ 160GB | 1 | 3.7% |
| PNY CS1311 120GB SSD | 1 | 3.7% |
| Maxtor 6L250S0 250GB | 1 | 3.7% |
| Leven JAJS300M120C 120GB | 1 | 3.7% |
| Intenso SSD Sata III 128GB | 1 | 3.7% |
| Hitachi HDT722516DLA380 164GB | 1 | 3.7% |
| Hitachi HDS721050CLA362 500GB | 1 | 3.7% |
| DREVO X1 SSD 120GB | 1 | 3.7% |
| China SATA3 120GB SSD | 1 | 3.7% |
HDD Vendor
Hard disk drive vendors


| Vendor | Desktops | Drives | Percent |
|---|---|---|---|
| Seagate | 6 | 8 | 40% |
| WDC | 3 | 4 | 20% |
| Toshiba | 2 | 2 | 13.33% |
| Hitachi | 2 | 2 | 13.33% |
| Samsung Electronics | 1 | 1 | 6.67% |
| Maxtor | 1 | 1 | 6.67% |
SSD Vendor
Solid state drive vendors


| Vendor | Desktops | Drives | Percent |
|---|---|---|---|
| Samsung Electronics | 2 | 2 | 22.22% |
| SPCC | 1 | 1 | 11.11% |
| SanDisk | 1 | 1 | 11.11% |
| PNY | 1 | 1 | 11.11% |
| Leven | 1 | 1 | 11.11% |
| Intenso | 1 | 1 | 11.11% |
| DREVO | 1 | 1 | 11.11% |
| China | 1 | 1 | 11.11% |
Drive Kind
HDD or SSD


| Kind | Desktops | Drives | Percent |
|---|---|---|---|
| HDD | 13 | 18 | 61.9% |
| SSD | 8 | 9 | 38.1% |
Drive Connector
SATA, SAS, NVMe, etc.


| Type | Desktops | Drives | Percent |
|---|---|---|---|
| SATA | 17 | 27 | 100% |
Drive Size
Size of hard drive


| Size in TB | Desktops | Drives | Percent |
|---|---|---|---|
| 0.01-0.5 | 17 | 21 | 77.27% |
| 3.01-4.0 | 2 | 3 | 9.09% |
| 2.01-3.0 | 1 | 1 | 4.55% |
| 1.01-2.0 | 1 | 1 | 4.55% |
| 0.51-1.0 | 1 | 1 | 4.55% |
Space Total
Amount of disk space available on the file system


| Size in GB | Desktops | Percent |
|---|---|---|
| 101-250 | 11 | 64.71% |
| More than 3000 | 2 | 11.76% |
| 21-50 | 2 | 11.76% |
| 251-500 | 1 | 5.88% |
| 1-20 | 1 | 5.88% |
Space Used
Amount of used disk space


| Used GB | Desktops | Percent |
|---|---|---|
| 1-20 | 11 | 64.71% |
| 21-50 | 3 | 17.65% |
| More than 3000 | 1 | 5.88% |
| 2001-3000 | 1 | 5.88% |
| 51-100 | 1 | 5.88% |
Malfunc. Drives
Drive models with a malfunction
Zero info for selected period =(
Malfunc. Drive Vendor
Vendors of faulty drives
Zero info for selected period =(
Malfunc. HDD Vendor
Vendors of faulty HDD drives
Zero info for selected period =(
Malfunc. Drive Kind
Kinds of faulty drives
Zero info for selected period =(
Failed Drives
Failed drive models
Zero info for selected period =(
Failed Drive Vendor
Failed drive vendors
Zero info for selected period =(
Drive Status
Number of failed and malfunc. drives


| Status | Desktops | Drives | Percent |
|---|---|---|---|
| Detected | 17 | 27 | 100% |
Storage Vendor
Storage controller vendors


| Vendor | Desktops | Percent |
|---|---|---|
| Intel | 9 | 45% |
| AMD | 5 | 25% |
| Nvidia | 3 | 15% |
| Marvell Technology Group | 1 | 5% |
| JMicron Technology | 1 | 5% |
| ASMedia Technology | 1 | 5% |
Storage Model
Storage controller models


| Model | Desktops | Percent |
|---|---|---|
| Intel NM10/ICH7 Family SATA Controller [IDE mode] | 4 | 13.33% |
| Intel 82801G (ICH7 Family) IDE Controller | 4 | 13.33% |
| AMD FCH SATA Controller [AHCI mode] | 3 | 10% |
| Nvidia MCP61 SATA Controller | 2 | 6.67% |
| Nvidia MCP61 IDE | 2 | 6.67% |
| Nvidia MCP51 Serial ATA Controller | 1 | 3.33% |
| Marvell Technology Group 88SE91A3 SATA-600 Controller | 1 | 3.33% |
| JMicron Technology JMB363 SATA/IDE Controller | 1 | 3.33% |
| Intel NM10/ICH7 Family SATA Controller [AHCI mode] | 1 | 3.33% |
| Intel 82Q35 Express PT IDER Controller | 1 | 3.33% |
| Intel 82801IR/IO/IH (ICH9R/DO/DH) 6 port SATA Controller [AHCI mode] | 1 | 3.33% |
| Intel 82801FB/FW (ICH6/ICH6W) SATA Controller | 1 | 3.33% |
| Intel 8 Series/C220 Series Chipset Family 6-port SATA Controller 1 [AHCI mode] | 1 | 3.33% |
| Intel 5 Series/3400 Series Chipset 4 port SATA IDE Controller | 1 | 3.33% |
| Intel 5 Series/3400 Series Chipset 2 port SATA IDE Controller | 1 | 3.33% |
| ASMedia Technology ASM1062 Serial ATA Controller | 1 | 3.33% |
| AMD X370 Series Chipset SATA Controller | 1 | 3.33% |
| AMD SB7x0/SB8x0/SB9x0 SATA Controller [IDE mode] | 1 | 3.33% |
| AMD SB7x0/SB8x0/SB9x0 SATA Controller [AHCI mode] | 1 | 3.33% |
| AMD SB7x0/SB8x0/SB9x0 IDE Controller | 1 | 3.33% |
Storage Kind
Kind of storage controller (IDE, SATA, NVMe, SAS, ...)


| Kind | Desktops | Percent |
|---|---|---|
| IDE | 12 | 60% |
| SATA | 8 | 40% |
CPU Vendor
Processor vendors


| Vendor | Desktops | Percent |
|---|---|---|
| Intel | 9 | 52.94% |
| AMD | 8 | 47.06% |
CPU Model
Processor models


| Model | Desktops | Percent |
|---|---|---|
| Intel Pentium Dual-Core CPU E5300 @ 2.60GHz | 1 | 5.88% |
| Intel Pentium Dual CPU E2160 @ 1.80GHz | 1 | 5.88% |
| Intel Pentium D CPU 3.00GHz | 1 | 5.88% |
| Intel Pentium 4 CPU 2.93GHz | 1 | 5.88% |
| Intel Core i5-4430 CPU @ 3.00GHz | 1 | 5.88% |
| Intel Core i5 CPU 650 @ 3.20GHz | 1 | 5.88% |
| Intel Core 2 Duo CPU E8400 @ 3.00GHz | 1 | 5.88% |
| Intel Core 2 Duo CPU E4500 @ 2.20GHz | 1 | 5.88% |
| Intel Celeron CPU E1400 @ 2.00GHz | 1 | 5.88% |
| AMD Sempron 2650 APU with Radeon R3 | 1 | 5.88% |
| AMD Ryzen 7 1700X Eight-Core Processor | 1 | 5.88% |
| AMD Phenom II X2 555 Processor | 1 | 5.88% |
| AMD FX-6300 Six-Core Processor | 1 | 5.88% |
| AMD Athlon 64 X2 Dual Core Processor 4800+ | 1 | 5.88% |
| AMD Athlon 64 X2 Dual Core Processor 3800+ | 1 | 5.88% |
| AMD Athlon 64 Processor 3500+ | 1 | 5.88% |
| AMD A8-6500 APU with Radeon HD Graphics | 1 | 5.88% |
CPU Model Family
Processor model prefix


| Model | Desktops | Percent |
|---|---|---|
| Intel Core i5 | 2 | 11.76% |
| Intel Core 2 Duo | 2 | 11.76% |
| AMD Athlon 64 X2 | 2 | 11.76% |
| Intel Pentium Dual-Core | 1 | 5.88% |
| Intel Pentium Dual | 1 | 5.88% |
| Intel Pentium D | 1 | 5.88% |
| Intel Pentium 4 | 1 | 5.88% |
| Intel Celeron | 1 | 5.88% |
| AMD Sempron | 1 | 5.88% |
| AMD Ryzen 7 | 1 | 5.88% |
| AMD Phenom II X2 | 1 | 5.88% |
| AMD FX | 1 | 5.88% |
| AMD Athlon 64 | 1 | 5.88% |
| AMD A8 | 1 | 5.88% |
CPU Cores
Number of processor cores


| Number | Desktops | Percent |
|---|---|---|
| 2 | 12 | 70.59% |
| 1 | 2 | 11.76% |
| 8 | 1 | 5.88% |
| 4 | 1 | 5.88% |
| 3 | 1 | 5.88% |
CPU Sockets
Number of sockets


| Number | Desktops | Percent |
|---|---|---|
| 1 | 17 | 100% |
CPU Threads
Threads per core (Hyper-Threading)


| Number | Desktops | Percent |
|---|---|---|
| 1 | 13 | 76.47% |
| 2 | 4 | 23.53% |
CPU Op-Modes
CPU Operation Modes (32-bit, 64-bit)


| Op mode | Desktops | Percent |
|---|---|---|
| 32-bit, 64-bit | 17 | 100% |
CPU Microcode
Microcode number


| Number | Desktops | Percent |
|---|---|---|
| Unknown | 4 | 23.53% |
| 0x6fd | 3 | 17.65% |
| 0x1067a | 2 | 11.76% |
| 0xf41 | 1 | 5.88% |
| 0x306c3 | 1 | 5.88% |
| 0x20655 | 1 | 5.88% |
| 0x08001129 | 1 | 5.88% |
| 0x0700010f | 1 | 5.88% |
| 0x06001119 | 1 | 5.88% |
| 0x06000852 | 1 | 5.88% |
| 0x010000c8 | 1 | 5.88% |
CPU Microarch
Microarchitecture


| Name | Desktops | Percent |
|---|---|---|
| K8 Hammer | 3 | 17.65% |
| Core | 3 | 17.65% |
| Piledriver | 2 | 11.76% |
| Penryn | 2 | 11.76% |
| NetBurst | 2 | 11.76% |
| Zen | 1 | 5.88% |
| Westmere | 1 | 5.88% |
| K10 | 1 | 5.88% |
| Jaguar | 1 | 5.88% |
| Haswell | 1 | 5.88% |
GPU Vendor
Vendors of graphics cards


| Vendor | Desktops | Percent |
|---|---|---|
| Nvidia | 8 | 44.44% |
| Intel | 5 | 27.78% |
| AMD | 5 | 27.78% |
GPU Model
Graphics card models


| Model | Desktops | Percent |
|---|---|---|
| AMD Caicos XT [Radeon HD 7470/8470 / R5 235/310 OEM] | 2 | 11.11% |
| Nvidia NV43 [GeForce 6600] | 1 | 5.56% |
| Nvidia NV43 [GeForce 6600 LE] | 1 | 5.56% |
| Nvidia GM206 [GeForce GTX 950] | 1 | 5.56% |
| Nvidia GM107 [GeForce GTX 750] | 1 | 5.56% |
| Nvidia GK107 [GeForce GT 640] | 1 | 5.56% |
| Nvidia GF119 [GeForce GT 610] | 1 | 5.56% |
| Nvidia GF116 [GeForce GTX 550 Ti] | 1 | 5.56% |
| Nvidia C61 [GeForce 6100 nForce 405] | 1 | 5.56% |
| Intel Xeon E3-1200 v3/4th Gen Core Processor Integrated Graphics Controller | 1 | 5.56% |
| Intel Core Processor Integrated Graphics Controller | 1 | 5.56% |
| Intel 82G33/G31 Express Integrated Graphics Controller | 1 | 5.56% |
| Intel 82915G/GV/910GL Integrated Graphics Controller | 1 | 5.56% |
| Intel 4 Series Chipset Integrated Graphics Controller | 1 | 5.56% |
| AMD RV710 [Radeon HD 4350/4550] | 1 | 5.56% |
| AMD Richland [Radeon HD 8570D] | 1 | 5.56% |
| AMD Kabini [Radeon HD 8240 / R3 Series] | 1 | 5.56% |
GPU Combo
Combinations of graphics cards


| Name | Desktops | Percent |
|---|---|---|
| 1 x Nvidia | 7 | 41.18% |
| 1 x AMD | 5 | 29.41% |
| 1 x Intel | 4 | 23.53% |
| Intel + Nvidia | 1 | 5.88% |
GPU Driver
Free vs proprietary


| Driver | Desktops | Percent |
|---|---|---|
| Free | 11 | 64.71% |
| Proprietary | 4 | 23.53% |
| Unknown | 2 | 11.76% |
GPU Memory
Total video memory


| Size in GB | Desktops | Percent |
|---|---|---|
| Unknown | 8 | 47.06% |
| 0.51-1.0 | 4 | 23.53% |
| 0.01-0.5 | 4 | 23.53% |
| 1.01-2.0 | 1 | 5.88% |
Monitor Vendor
Monitor vendors


| Vendor | Desktops | Percent |
|---|---|---|
| Toshiba | 1 | 9.09% |
| Targa | 1 | 9.09% |
| SKY | 1 | 9.09% |
| Samsung Electronics | 1 | 9.09% |
| Philips | 1 | 9.09% |
| Packard Bell | 1 | 9.09% |
| HannStar | 1 | 9.09% |
| Elo Touch | 1 | 9.09% |
| AOC | 1 | 9.09% |
| Ancor Communications | 1 | 9.09% |
| Acer | 1 | 9.09% |
Monitor Model
Monitor models


| Model | Desktops | Percent |
|---|---|---|
| Toshiba TV TSB0206 1920x1080 886x498mm 40.0-inch | 1 | 9.09% |
| Targa LCD Monitor LCDTV16 3200x1204 | 1 | 9.09% |
| SKY TV-monitor SKY0402 1920x1080 885x498mm 40.0-inch | 1 | 9.09% |
| Samsung Electronics S27B550 SAM091B 1920x1080 598x336mm 27.0-inch | 1 | 9.09% |
| Philips 190C PHL0849 1280x1024 376x301mm 19.0-inch | 1 | 9.09% |
| Packard Bell PKB VIS191WS PKB5067 1440x900 410x257mm 19.1-inch | 1 | 9.09% |
| HannStar M19W2 HSP4D37 1440x900 408x255mm 18.9-inch | 1 | 9.09% |
| Elo Touch ET1727L-7CWF ELO1004 1280x1024 330x270mm 16.8-inch | 1 | 9.09% |
| AOC 2270W AOC2270 1920x1080 477x268mm 21.5-inch | 1 | 9.09% |
| Ancor Communications VS248 ACI2498 1920x1080 531x299mm 24.0-inch | 1 | 9.09% |
| Acer X163W ACR0015 1366x768 344x193mm 15.5-inch | 1 | 9.09% |
Monitor Resolution
Monitor screen resolution


| Resolution | Desktops | Percent |
|---|---|---|
| 1920x1080 (FHD) | 5 | 45.45% |
| 1440x900 (WXGA+) | 2 | 18.18% |
| 1280x1024 (SXGA) | 2 | 18.18% |
| 3200x1204 | 1 | 9.09% |
| 1366x768 (WXGA) | 1 | 9.09% |
Monitor Diagonal
Diagonal size in inches


| Inches | Desktops | Percent |
|---|---|---|
| 19 | 2 | 18.18% |
| 74 | 1 | 9.09% |
| 40 | 1 | 9.09% |
| 27 | 1 | 9.09% |
| 24 | 1 | 9.09% |
| 21 | 1 | 9.09% |
| 18 | 1 | 9.09% |
| 16 | 1 | 9.09% |
| 15 | 1 | 9.09% |
| Unknown | 1 | 9.09% |
Monitor Width
Physical width


| Width in mm | Desktops | Percent |
|---|---|---|
| 401-500 | 3 | 27.27% |
| 501-600 | 2 | 18.18% |
| 301-350 | 2 | 18.18% |
| 801-900 | 1 | 9.09% |
| 351-400 | 1 | 9.09% |
| 1501-2000 | 1 | 9.09% |
| Unknown | 1 | 9.09% |
Aspect Ratio
Proportional relationship between the width and the height

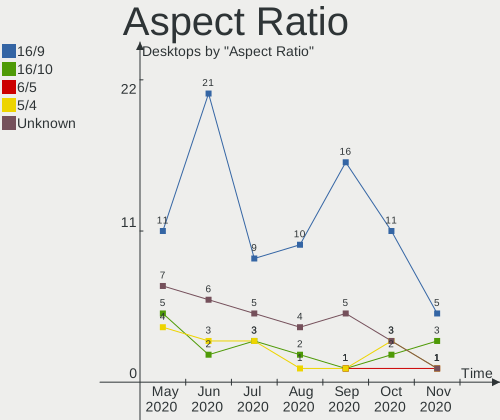
| Ratio | Desktops | Percent |
|---|---|---|
| 16/9 | 5 | 45.45% |
| 16/10 | 3 | 27.27% |
| 6/5 | 1 | 9.09% |
| 5/4 | 1 | 9.09% |
| Unknown | 1 | 9.09% |
Monitor Area
Area in inch²


| Area in inch² | Desktops | Percent |
|---|---|---|
| 151-200 | 4 | 36.36% |
| More than 1000 | 1 | 9.09% |
| 301-350 | 1 | 9.09% |
| 201-250 | 1 | 9.09% |
| 131-140 | 1 | 9.09% |
| 101-110 | 1 | 9.09% |
| 501-1000 | 1 | 9.09% |
| Unknown | 1 | 9.09% |
Pixel Density
Pixels per inch


| Density | Desktops | Percent |
|---|---|---|
| 51-100 | 7 | 63.64% |
| 101-120 | 2 | 18.18% |
| 1-50 | 1 | 9.09% |
| Unknown | 1 | 9.09% |
Multiple Monitors
Total monitors connected


| Total | Desktops | Percent |
|---|---|---|
| 1 | 14 | 82.35% |
| 0 | 3 | 17.65% |
Net Controller Vendor
Controller vendors


| Vendor | Desktops | Percent |
|---|---|---|
| Realtek Semiconductor | 9 | 33.33% |
| Intel | 4 | 14.81% |
| Qualcomm Atheros | 3 | 11.11% |
| Ralink Technology | 2 | 7.41% |
| Broadcom Inc. and subsidiaries | 2 | 7.41% |
| TP-Link | 1 | 3.7% |
| Nvidia | 1 | 3.7% |
| Marvell Technology Group | 1 | 3.7% |
| Linksys | 1 | 3.7% |
| Gemtek | 1 | 3.7% |
| Broadcom Limited | 1 | 3.7% |
| Aquantia | 1 | 3.7% |
Net Controller Model
Controller models


| Model | Desktops | Percent |
|---|---|---|
| Realtek RTL8111/8168/8411 PCI Express Gigabit Ethernet Controller | 5 | 16.67% |
| Realtek RTL810xE PCI Express Fast Ethernet controller | 2 | 6.67% |
| TP-Link TL-WN823N v2/v3 [Realtek RTL8192EU] | 1 | 3.33% |
| Realtek RTL8723BU 802.11b/g/n WLAN Adapter | 1 | 3.33% |
| Realtek RTL8188CUS 802.11n WLAN Adapter | 1 | 3.33% |
| Realtek RTL8187 Wireless Adapter | 1 | 3.33% |
| Realtek RTL8169 PCI Gigabit Ethernet Controller | 1 | 3.33% |
| Ralink RT2870/RT3070 Wireless Adapter | 1 | 3.33% |
| Ralink RT2501/RT2573 Wireless Adapter | 1 | 3.33% |
| Qualcomm Atheros AR922X Wireless Network Adapter | 1 | 3.33% |
| Qualcomm Atheros AR9227 Wireless Network Adapter | 1 | 3.33% |
| Qualcomm Atheros AR8121/AR8113/AR8114 Gigabit or Fast Ethernet | 1 | 3.33% |
| Nvidia MCP61 Ethernet | 1 | 3.33% |
| Marvell Group 88E8056 PCI-E Gigabit Ethernet Controller | 1 | 3.33% |
| Linksys AE1000 v1 802.11n [Ralink RT3572] | 1 | 3.33% |
| Intel I211 Gigabit Network Connection | 1 | 3.33% |
| Intel Dual Band Wireless-AC 3168NGW [Stone Peak] | 1 | 3.33% |
| Intel 82578DM Gigabit Network Connection | 1 | 3.33% |
| Intel 82566DM-2 Gigabit Network Connection | 1 | 3.33% |
| Intel 82562ET/EZ/GT/GZ - PRO/100 VE (LOM) Ethernet Controller | 1 | 3.33% |
| Gemtek WUBR-177G [Ralink RT2571W] | 1 | 3.33% |
| Broadcom Limited NetXtreme BCM5752 Gigabit Ethernet PCI Express | 1 | 3.33% |
| Broadcom Inc. and subsidiaries BCM4401-B0 100Base-TX | 1 | 3.33% |
| Broadcom Inc. and subsidiaries BCM4318 [AirForce One 54g] 802.11g Wireless LAN Controller | 1 | 3.33% |
| Aquantia AQC108 NBase-T/IEEE 802.3bz Ethernet Controller [AQtion] | 1 | 3.33% |
Wireless Vendor
Wireless vendors


| Vendor | Desktops | Percent |
|---|---|---|
| Realtek Semiconductor | 3 | 25% |
| Ralink Technology | 2 | 16.67% |
| Qualcomm Atheros | 2 | 16.67% |
| TP-Link | 1 | 8.33% |
| Linksys | 1 | 8.33% |
| Intel | 1 | 8.33% |
| Gemtek | 1 | 8.33% |
| Broadcom Inc. and subsidiaries | 1 | 8.33% |
Wireless Model
Wireless models


| Model | Desktops | Percent |
|---|---|---|
| TP-Link TL-WN823N v2/v3 [Realtek RTL8192EU] | 1 | 8.33% |
| Realtek RTL8723BU 802.11b/g/n WLAN Adapter | 1 | 8.33% |
| Realtek RTL8188CUS 802.11n WLAN Adapter | 1 | 8.33% |
| Realtek RTL8187 Wireless Adapter | 1 | 8.33% |
| Ralink RT2870/RT3070 Wireless Adapter | 1 | 8.33% |
| Ralink RT2501/RT2573 Wireless Adapter | 1 | 8.33% |
| Qualcomm Atheros AR922X Wireless Network Adapter | 1 | 8.33% |
| Qualcomm Atheros AR9227 Wireless Network Adapter | 1 | 8.33% |
| Linksys AE1000 v1 802.11n [Ralink RT3572] | 1 | 8.33% |
| Intel Dual Band Wireless-AC 3168NGW [Stone Peak] | 1 | 8.33% |
| Gemtek WUBR-177G [Ralink RT2571W] | 1 | 8.33% |
| Broadcom Inc. and subsidiaries BCM4318 [AirForce One 54g] 802.11g Wireless LAN Controller | 1 | 8.33% |
Ethernet Vendor
Ethernet vendors


| Vendor | Desktops | Percent |
|---|---|---|
| Realtek Semiconductor | 8 | 44.44% |
| Intel | 4 | 22.22% |
| Qualcomm Atheros | 1 | 5.56% |
| Nvidia | 1 | 5.56% |
| Marvell Technology Group | 1 | 5.56% |
| Broadcom Limited | 1 | 5.56% |
| Broadcom Inc. and subsidiaries | 1 | 5.56% |
| Aquantia | 1 | 5.56% |
Ethernet Model
Ethernet models


| Model | Desktops | Percent |
|---|---|---|
| Realtek RTL8111/8168/8411 PCI Express Gigabit Ethernet Controller | 5 | 27.78% |
| Realtek RTL810xE PCI Express Fast Ethernet controller | 2 | 11.11% |
| Realtek RTL8169 PCI Gigabit Ethernet Controller | 1 | 5.56% |
| Qualcomm Atheros AR8121/AR8113/AR8114 Gigabit or Fast Ethernet | 1 | 5.56% |
| Nvidia MCP61 Ethernet | 1 | 5.56% |
| Marvell Group 88E8056 PCI-E Gigabit Ethernet Controller | 1 | 5.56% |
| Intel I211 Gigabit Network Connection | 1 | 5.56% |
| Intel 82578DM Gigabit Network Connection | 1 | 5.56% |
| Intel 82566DM-2 Gigabit Network Connection | 1 | 5.56% |
| Intel 82562ET/EZ/GT/GZ - PRO/100 VE (LOM) Ethernet Controller | 1 | 5.56% |
| Broadcom Limited NetXtreme BCM5752 Gigabit Ethernet PCI Express | 1 | 5.56% |
| Broadcom Inc. and subsidiaries BCM4401-B0 100Base-TX | 1 | 5.56% |
| Aquantia AQC108 NBase-T/IEEE 802.3bz Ethernet Controller [AQtion] | 1 | 5.56% |
Net Controller Kind
Ethernet, WiFi or modem


| Kind | Desktops | Percent |
|---|---|---|
| Ethernet | 17 | 62.96% |
| WiFi | 10 | 37.04% |
Used Controller
Currently used network controller


| Kind | Desktops | Percent |
|---|---|---|
| Ethernet | 11 | 57.89% |
| WiFi | 8 | 42.11% |
NICs
Total network controllers on board


| Total | Desktops | Percent |
|---|---|---|
| 1 | 13 | 76.47% |
| 2 | 3 | 17.65% |
| 3 | 1 | 5.88% |
Memory Vendor
Memory module vendors


| Vendor | Desktops | Percent |
|---|---|---|
| Unknown | 1 | 25% |
| Samsung Electronics | 1 | 25% |
| Elpida | 1 | 25% |
| CSX | 1 | 25% |
Memory Model
Memory module models


| Model | Desktops | Percent |
|---|---|---|
| Unknown RAM Module 1GB DIMM 800MT/s | 1 | 25% |
| Samsung RAM M3 78T2953EZ3-CE6 1024MB DIMM DDR 667MT/s | 1 | 25% |
| Elpida RAM EBE11UD8AJWA-6E-E 1GB DIMM DDR2 667MT/s | 1 | 25% |
| CSX RAM V01D2L81GB18818867 1GB DIMM DDR2 667MT/s | 1 | 25% |
Memory Kind
Memory module kinds


| Kind | Desktops | Percent |
|---|---|---|
| SDRAM | 1 | 33.33% |
| DDR2 | 1 | 33.33% |
| Unknown | 1 | 33.33% |
Memory Form Factor
Physical design of the memory module


| Name | Desktops | Percent |
|---|---|---|
| DIMM | 2 | 100% |
Memory Size
Memory module size


| Size | Desktops | Percent |
|---|---|---|
| 1024 | 2 | 100% |
Memory Speed
Memory module speed


| Speed | Desktops | Percent |
|---|---|---|
| 800 | 1 | 50% |
| 667 | 1 | 50% |
Sound Vendor
Sound card vendors


| Vendor | Desktops | Percent |
|---|---|---|
| Intel | 9 | 36% |
| Nvidia | 8 | 32% |
| AMD | 8 | 32% |
Sound Model
Sound card models


| Model | Desktops | Percent |
|---|---|---|
| Intel NM10/ICH7 Family High Definition Audio Controller | 5 | 17.86% |
| Nvidia MCP61 High Definition Audio | 2 | 7.14% |
| AMD SBx00 Azalia (Intel HDA) | 2 | 7.14% |
| AMD FCH Azalia Controller | 2 | 7.14% |
| AMD Caicos HDMI Audio [Radeon HD 6450 / 7450/8450/8490 OEM / R5 230/235/235X OEM] | 2 | 7.14% |
| Nvidia MCP51 High Definition Audio | 1 | 3.57% |
| Nvidia GM206 High Definition Audio Controller | 1 | 3.57% |
| Nvidia GM107 High Definition Audio Controller [GeForce 940MX] | 1 | 3.57% |
| Nvidia GK107 HDMI Audio Controller | 1 | 3.57% |
| Nvidia GF119 HDMI Audio Controller | 1 | 3.57% |
| Nvidia GF116 High Definition Audio Controller | 1 | 3.57% |
| Intel Xeon E3-1200 v3/4th Gen Core Processor HD Audio Controller | 1 | 3.57% |
| Intel 82801I (ICH9 Family) HD Audio Controller | 1 | 3.57% |
| Intel 82801FB/FBM/FR/FW/FRW (ICH6 Family) High Definition Audio Controller | 1 | 3.57% |
| Intel 8 Series/C220 Series Chipset High Definition Audio Controller | 1 | 3.57% |
| Intel 5 Series/3400 Series Chipset High Definition Audio | 1 | 3.57% |
| AMD Trinity HDMI Audio Controller | 1 | 3.57% |
| AMD RV710/730 HDMI Audio [Radeon HD 4000 series] | 1 | 3.57% |
| AMD Kabini HDMI/DP Audio | 1 | 3.57% |
| AMD Family 17h (Models 00h-0fh) HD Audio Controller | 1 | 3.57% |
Camera Vendor
Camera device vendors


| Vendor | Desktops | Percent |
|---|---|---|
| Microdia | 2 | 66.67% |
| Logitech | 1 | 33.33% |
Camera Model
Camera device models


| Model | Desktops | Percent |
|---|---|---|
| Microdia MSI Starcam Racer | 1 | 33.33% |
| Microdia Camera | 1 | 33.33% |
| Logitech QuickCam Pro 9000 | 1 | 33.33% |
Fingerprint Vendor
Fingerprint sensor vendors
Zero info for selected period =(
Fingerprint Model
Fingerprint sensor models
Zero info for selected period =(
Chipcard Vendor
Chipcard module vendors
Zero info for selected period =(
Chipcard Model
Chipcard module models
Zero info for selected period =(
Printer Vendor
Printer device vendors
Zero info for selected period =(
Printer Model
Printer device models
Zero info for selected period =(
Scanner Vendor
Scanner device vendors
Zero info for selected period =(
Scanner Model
Scanner device models
Zero info for selected period =(
Bluetooth Vendor
Controller vendors


| Vendor | Desktops | Percent |
|---|---|---|
| Intel | 1 | 50% |
| Broadcom | 1 | 50% |
Bluetooth Model
Controller models


| Model | Desktops | Percent |
|---|---|---|
| Intel Wireless-AC 3168 Bluetooth | 1 | 50% |
| Broadcom BCM2035 Bluetooth dongle | 1 | 50% |
Unsupported Devices
Total unsupported devices on board


| Total | Desktops | Percent |
|---|---|---|
| 0 | 14 | 82.35% |
| 1 | 3 | 17.65% |
Unsupported Device Types
Types of unsupported devices


| Type | Desktops | Percent |
|---|---|---|
| Graphics card | 2 | 66.67% |
| Communication controller | 1 | 33.33% |