KDE neon Hardware Trends (Notebook)
A project to identify most popular hardware characteristics and track their change over time based on data collected by KDE neon users at https://Linux-Hardware.org.
Anyone can contribute to the study by uploading probes of their computers by the hw-probe tool:
sudo hw-probe -all -uploadFull-feature report is available here: https://linux-hardware.org/?view=trends&formfactor=notebook
Period: Apr, 2020.
Contents
- OS
- OS Family
- Kernel
- Kernel Family
- Kernel Major Ver.
- Arch
- DE
- Display Server
- Display Manager
- OS Lang
- Boot Mode
- Filesystem
- Dual Boot with Linux/BSD
- Dual Boot (Win)
- Country
- City
- Vendor
- Model
- Model Family
- MFG Year
- Form Factor
- Secure Boot
- Coreboot
- RAM Size
- RAM Used
- Drive Vendor
- Drive Model
- Drive Kind
- Drive Connector
- Drive Size
- Space Total
- Space Used
- Malfunc. Drives
- Malfunc. Drive Vendor
- Malfunc. Drive Kind
- Failed Drives
- Failed Drive Vendor
- Drive Status
- Storage Vendor
- Storage Model
- Storage Kind
- CPU Vendor
- CPU Model
- CPU Model Family
- CPU Cores
- CPU Sockets
- CPU Threads
- CPU Op-Modes
- CPU Microarch
- CPU Microcode
- GPU Vendor
- GPU Model
- GPU Combo
- GPU Driver
- GPU Memory
- Monitor Vendor
- Monitor Model
- Monitor Resolution
- Monitor Diagonal
- Monitor Width
- Aspect Ratio
- Monitor Area
- Pixel Density
- Multiple Monitors
- Net Controller Vendor
- Net Controller Model
- Net Controller Kind
- Used Controller
- NICs
- Unsupported Devices
- Unsupported Device Types
OS
Installed operating systems


| Name | Computers | Percent |
|---|---|---|
| KDE neon 18.04 | 25 | 100% |
OS Family
OS without a version


| Name | Computers | Percent |
|---|---|---|
| KDE neon | 25 | 100% |
Kernel
Version of the Linux kernel


| Version | Computers | Percent |
|---|---|---|
| 5.3.0-46-generic | 12 | 48% |
| 5.3.0-51-generic | 2 | 8% |
| 5.3.0-47-generic | 1 | 4% |
| 5.3.0-45-generic | 1 | 4% |
| 5.3.0-42-generic | 1 | 4% |
| 5.0.0-37-generic | 1 | 4% |
| 5.0.0-31-generic | 1 | 4% |
| 4.4.176-0404176-generic | 1 | 4% |
| 4.15.0-96-generic | 1 | 4% |
| 4.15.0-88-generic | 1 | 4% |
| 4.15.0-52-lowlatency | 1 | 4% |
| 4.15.0-52-generic | 1 | 4% |
| 4.13.0-45-generic | 1 | 4% |
Kernel Family
Linux kernel without a distro release


| Version | Computers | Percent |
|---|---|---|
| 5.3.0 | 17 | 68% |
| 4.15.0 | 4 | 16% |
| 5.0.0 | 2 | 8% |
| 4.4.176 | 1 | 4% |
| 4.13.0 | 1 | 4% |
Kernel Major Ver.
Linux kernel major version


| Version | Computers | Percent |
|---|---|---|
| 5.3 | 17 | 68% |
| 4.15 | 4 | 16% |
| 5.0 | 2 | 8% |
| 4.4 | 1 | 4% |
| 4.13 | 1 | 4% |
Arch
OS architecture (x86_64, i586, etc.)


| Name | Computers | Percent |
|---|---|---|
| x86_64 | 25 | 100% |
DE
Desktop Environment


| Name | Computers | Percent |
|---|---|---|
| KDE | 23 | 92% |
| Unknown | 2 | 8% |
Display Server
X11 or Wayland


| Name | Computers | Percent |
|---|---|---|
| X11 | 24 | 96% |
| Wayland | 1 | 4% |
Display Manager
SDDM, LightDM, etc.


| Name | Computers | Percent |
|---|---|---|
| Unknown | 25 | 100% |
OS Lang
Language


| Lang | Computers | Percent |
|---|---|---|
| en_US | 6 | 24% |
| ru_RU | 4 | 16% |
| es_ES | 3 | 12% |
| pl_PL | 2 | 8% |
| de_DE | 2 | 8% |
| zh_CN | 1 | 4% |
| es_AR | 1 | 4% |
| en_ZA | 1 | 4% |
| en_GB | 1 | 4% |
| en_DE | 1 | 4% |
| en_CA | 1 | 4% |
| C | 1 | 4% |
| Unknown | 1 | 4% |
Boot Mode
EFI or BIOS


| Mode | Computers | Percent |
|---|---|---|
| BIOS | 13 | 52% |
| EFI | 12 | 48% |
Filesystem
Type of filesystem


| Type | Computers | Percent |
|---|---|---|
| Ext4 | 24 | 96% |
| Overlay | 1 | 4% |
Dual Boot with Linux/BSD
Hosting more than one Linux/BSD


| Dual boot | Computers | Percent |
|---|---|---|
| No | 24 | 96% |
| Yes | 1 | 4% |
Dual Boot (Win)
Hosting Linux and Windows


| Dual boot | Computers | Percent |
|---|---|---|
| No | 21 | 84% |
| Yes | 4 | 16% |
Country
Geographic location (country)


| Country | Computers | Percent |
|---|---|---|
| USA | 3 | 12% |
| Russia | 3 | 12% |
| Germany | 3 | 12% |
| Spain | 2 | 8% |
| Poland | 2 | 8% |
| Canada | 2 | 8% |
| Ukraine | 1 | 4% |
| UK | 1 | 4% |
| South Africa | 1 | 4% |
| Saudi Arabia | 1 | 4% |
| Romania | 1 | 4% |
| Mexico | 1 | 4% |
| Iran | 1 | 4% |
| Indonesia | 1 | 4% |
| China | 1 | 4% |
| Argentina | 1 | 4% |
City
Geographic location (city)


| City | Computers | Percent |
|---|---|---|
| Wrocław | 1 | 4% |
| Wolverhampton | 1 | 4% |
| Weimar | 1 | 4% |
| Toronto | 1 | 4% |
| Tehran | 1 | 4% |
| Siedlce | 1 | 4% |
| Sevastopol | 1 | 4% |
| San Juan del Río | 1 | 4% |
| Riyadh | 1 | 4% |
| Pretoria | 1 | 4% |
| Pola de Siero | 1 | 4% |
| Novosibirsk | 1 | 4% |
| Moscow | 1 | 4% |
| Mississauga | 1 | 4% |
| Lingen | 1 | 4% |
| Khimki | 1 | 4% |
| Greven | 1 | 4% |
| Dongguan | 1 | 4% |
| Chacabuco | 1 | 4% |
| Catral | 1 | 4% |
| Bucharest | 1 | 4% |
| Bryan | 1 | 4% |
| Brewton | 1 | 4% |
| Bandung | 1 | 4% |
| Albuquerque | 1 | 4% |
Vendor
Motherboard manufacturer


| Name | Computers | Percent |
|---|---|---|
| Hewlett-Packard | 7 | 28% |
| Dell | 5 | 20% |
| MSI | 2 | 8% |
| Lenovo | 2 | 8% |
| HUAWEI | 2 | 8% |
| ASUSTek Computer | 2 | 8% |
| Sony | 1 | 4% |
| Samsung Electronics | 1 | 4% |
| LG Electronics | 1 | 4% |
| Alienware | 1 | 4% |
| Acer | 1 | 4% |
Model
Motherboard model


| Name | Computers | Percent |
|---|---|---|
| HP Pavilion Notebook | 2 | 8% |
| Sony SVF1521A6EB | 1 | 4% |
| Samsung Electronics RC530/RC730 | 1 | 4% |
| MSI PS63 Modern 8M | 1 | 4% |
| MSI GE60 2PE | 1 | 4% |
| LG Electronics P1-J150B | 1 | 4% |
| Lenovo IdeaPad S540-14API 81NH | 1 | 4% |
| Lenovo G700 20251 | 1 | 4% |
| HUAWEI WRT-WX9 | 1 | 4% |
| HUAWEI NBLK-WAX9X | 1 | 4% |
| HP Pavilion Gaming Laptop 15-ec0xxx | 1 | 4% |
| HP Pavilion dv6 | 1 | 4% |
| HP Laptop 15-dw0xxx | 1 | 4% |
| HP 540 | 1 | 4% |
| HP 2000 | 1 | 4% |
| Dell Vostro 3360 | 1 | 4% |
| Dell Latitude E6510 | 1 | 4% |
| Dell Latitude E6400 | 1 | 4% |
| Dell Latitude E6320 | 1 | 4% |
| Dell Inspiron 5584 | 1 | 4% |
| ASUS X550IU | 1 | 4% |
| ASUS P53SJ | 1 | 4% |
| Alienware 17 | 1 | 4% |
| Acer Aspire A315-53 | 1 | 4% |
Model Family
Motherboard model prefix


| Name | Computers | Percent |
|---|---|---|
| HP Pavilion | 4 | 16% |
| Dell Latitude | 3 | 12% |
| Sony SVF1521A6EB | 1 | 4% |
| Samsung Electronics RC530 | 1 | 4% |
| MSI PS63 | 1 | 4% |
| MSI GE60 | 1 | 4% |
| LG Electronics P1-J150B | 1 | 4% |
| Lenovo IdeaPad | 1 | 4% |
| Lenovo G700 | 1 | 4% |
| HUAWEI WRT-WX9 | 1 | 4% |
| HUAWEI NBLK-WAX9X | 1 | 4% |
| HP Laptop | 1 | 4% |
| HP 540 | 1 | 4% |
| HP 2000 | 1 | 4% |
| Dell Vostro | 1 | 4% |
| Dell Inspiron | 1 | 4% |
| ASUS X550IU | 1 | 4% |
| ASUS P53SJ | 1 | 4% |
| Alienware 17 | 1 | 4% |
| Acer Aspire | 1 | 4% |
MFG Year
Motherboard manufacture year


| Year | Computers | Percent |
|---|---|---|
| 2019 | 6 | 24% |
| 2011 | 5 | 20% |
| 2018 | 3 | 12% |
| 2013 | 3 | 12% |
| 2016 | 2 | 8% |
| 2020 | 1 | 4% |
| 2017 | 1 | 4% |
| 2015 | 1 | 4% |
| 2014 | 1 | 4% |
| 2008 | 1 | 4% |
| 2006 | 1 | 4% |
Form Factor
Physical design of the computer


| Name | Computers | Percent |
|---|---|---|
| Notebook | 25 | 100% |
Secure Boot
Enabled or disabled


| State | Computers | Percent |
|---|---|---|
| Disabled | 22 | 88% |
| Enabled | 3 | 12% |
Coreboot
Have coreboot on board


| Used | Computers | Percent |
|---|---|---|
| No | 25 | 100% |
RAM Size
Total RAM memory


| Size in GB | Computers | Percent |
|---|---|---|
| 4.01-8.0 | 11 | 44% |
| 3.01-4.0 | 5 | 20% |
| 8.01-16.0 | 4 | 16% |
| 16.01-24.0 | 3 | 12% |
| 1.01-2.0 | 2 | 8% |
RAM Used
Used RAM memory


| Used GB | Computers | Percent |
|---|---|---|
| 2.01-3.0 | 9 | 36% |
| 1.01-2.0 | 8 | 32% |
| 0.01-1.0 | 4 | 16% |
| 3.01-4.0 | 2 | 8% |
| 4.01-8.0 | 1 | 4% |
| 8.01-16.0 | 1 | 4% |
Drive Vendor
Hard drive vendors


| Vendor | Computers | Drives | Percent |
|---|---|---|---|
| Seagate | 6 | 7 | 23.08% |
| WDC | 5 | 5 | 19.23% |
| Kingston | 5 | 5 | 19.23% |
| Toshiba | 2 | 2 | 7.69% |
| SanDisk | 1 | 1 | 3.85% |
| Samsung Electronics | 1 | 1 | 3.85% |
| LITEONIT | 1 | 1 | 3.85% |
| Intel | 1 | 1 | 3.85% |
| HL-DT-ST | 1 | Unknown | 3.85% |
| Hitachi | 1 | 1 | 3.85% |
| HGST | 1 | 1 | 3.85% |
| Generic | 1 | 1 | 3.85% |
Drive Model
Hard drive models


| Model | Computers | Percent |
|---|---|---|
| WDS240G1G0A-00SS50 240GB SSD | 1 | 3.7% |
| WDS100T2B0A 1TB SSD | 1 | 3.7% |
| WD3200BPVT-75ZEST0 320GB | 1 | 3.7% |
| WD10JPVX-75JC3T0 1TB | 1 | 3.7% |
| WD10JPVX-60JC3T0 1TB | 1 | 3.7% |
| SUV500MS240G 240GB SSD | 1 | 3.7% |
| SUV400S37120G 120GB SSD | 1 | 3.7% |
| ST9320423AS 320GB | 1 | 3.7% |
| ST9160827AS 160GB | 1 | 3.7% |
| ST9160412ASG 160GB | 1 | 3.7% |
| ST500LM000-1EJ162-SSHD-8GB | 1 | 3.7% |
| ST1000LM049-2GH172 1TB | 1 | 3.7% |
| ST1000LM024 HN-M101MBB 1TB | 1 | 3.7% |
| SSDSC2KG480G8 480GB | 1 | 3.7% |
| SSD 840 EVO 250GB | 1 | 3.7% |
| SHFS37A120G 120GB SSD | 1 | 3.7% |
| SD6SF1M128GG56 128GB SSD | 1 | 3.7% |
| SD/MMC/MS PRO 64GB | 1 | 3.7% |
| SA400S37480G 480GB SSD | 1 | 3.7% |
| SA400S37240G 240GB SSD | 1 | 3.7% |
| MQ04ABF100 1TB | 1 | 3.7% |
| MQ01ABD100 1TB | 1 | 3.7% |
| HTS721010A9E630 1TB | 1 | 3.7% |
| HTS545032A7E380 320GB | 1 | 3.7% |
| Expansion 1TB | 1 | 3.7% |
| DVDRAM GUE1N 3GB | 1 | 3.7% |
| DMT-80M6M-11 mSATA 80GB SSD | 1 | 3.7% |
Drive Kind
HDD or SSD


| Kind | Computers | Drives | Percent |
|---|---|---|---|
| HDD | 13 | 14 | 56.52% |
| SSD | 8 | 11 | 34.78% |
| Unknown | 2 | 1 | 8.7% |
Drive Connector
SATA, SAS, NVMe, etc.


| Type | Computers | Drives | Percent |
|---|---|---|---|
| SATA | 20 | 24 | 86.96% |
| SAS | 3 | 2 | 13.04% |
Drive Size
Size of hard drive


| Size in TB | Computers | Drives | Percent |
|---|---|---|---|
| 0.01-0.5 | 16 | 17 | 64% |
| 0.51-1.0 | 9 | 9 | 36% |
Space Total
Amount of disk space available on the file system


| Size in GB | Computers | Percent |
|---|---|---|
| 101-250 | 12 | 48% |
| 251-500 | 7 | 28% |
| 501-1000 | 2 | 8% |
| 51-100 | 2 | 8% |
| 1001-2000 | 1 | 4% |
| 1-20 | 1 | 4% |
Space Used
Amount of used disk space


| Used GB | Computers | Percent |
|---|---|---|
| 1-20 | 9 | 36% |
| 101-250 | 7 | 28% |
| 21-50 | 5 | 20% |
| 51-100 | 2 | 8% |
| 251-500 | 1 | 4% |
| 501-1000 | 1 | 4% |
Malfunc. Drives
Drive models with a malfunction
Zero info for selected period =(
Malfunc. Drive Vendor
Vendors of faulty drives
Zero info for selected period =(
Malfunc. Drive Kind
Kinds of faulty drives
Zero info for selected period =(
Failed Drives
Failed drive models
Zero info for selected period =(
Failed Drive Vendor
Failed drive vendors
Zero info for selected period =(
Drive Status
Number of failed and malfunc. drives


| Status | Computers | Drives | Percent |
|---|---|---|---|
| Detected | 21 | 26 | 100% |
Storage Vendor
Storage controller vendors


| Vendor | Computers | Percent |
|---|---|---|
| Intel | 18 | 64.29% |
| AMD | 4 | 14.29% |
| Sandisk | 3 | 10.71% |
| Toshiba America Info Systems | 2 | 7.14% |
| Samsung Electronics | 1 | 3.57% |
Storage Model
Storage controller models


| Model | Computers | Percent |
|---|---|---|
| FCH SATA Controller [AHCI mode] | 4 | 13.79% |
| 82801 Mobile SATA Controller [RAID mode] | 4 | 13.79% |
| 7 Series Chipset Family 6-port SATA Controller [AHCI mode] | 3 | 10.34% |
| Cannon Point-LP SATA Controller [AHCI Mode] | 2 | 6.9% |
| BG3 NVMe SSD Controller | 2 | 6.9% |
| 82801IBM/IEM (ICH9M/ICH9M-E) 4 port SATA Controller [AHCI mode] | 2 | 6.9% |
| 8 Series/C220 Series Chipset Family 6-port SATA Controller 1 [AHCI mode] | 2 | 6.9% |
| 6 Series/C200 Series Chipset Family 6 port Mobile SATA AHCI Controller | 2 | 6.9% |
| Wildcat Point-LP SATA Controller [AHCI Mode] | 1 | 3.45% |
| WD Black 2018/PC SN720 NVMe SSD | 1 | 3.45% |
| WD Black 2018/PC SN520 NVMe SSD | 1 | 3.45% |
| NVMe SSD Controller SM981/PM981/PM983 | 1 | 3.45% |
| Non-Volatile memory controller | 1 | 3.45% |
| 82801HM/HEM (ICH8M/ICH8M-E) SATA Controller [AHCI mode] | 1 | 3.45% |
| 82801GBM/GHM (ICH7-M Family) SATA Controller [AHCI mode] | 1 | 3.45% |
| 82801G (ICH7 Family) IDE Controller | 1 | 3.45% |
Storage Kind
Kind of storage controller (IDE, SATA, NVMe, SAS, ...)


| Kind | Computers | Percent |
|---|---|---|
| SATA | 18 | 62.07% |
| NVMe | 6 | 20.69% |
| RAID | 4 | 13.79% |
| IDE | 1 | 3.45% |
CPU Vendor
Processor vendors


| Vendor | Computers | Percent |
|---|---|---|
| Intel | 19 | 76% |
| AMD | 6 | 24% |
CPU Model
Processor models


| Model | Computers | Percent |
|---|---|---|
| Intel Core i5-8265U CPU @ 1.60GHz | 3 | 12% |
| AMD Ryzen 5 3500U with Radeon Vega Mobile Gfx | 2 | 8% |
| Intel Pentium CPU 2117U @ 1.80GHz | 1 | 4% |
| Intel Pentium CPU 2020M @ 2.40GHz | 1 | 4% |
| Intel Core i7-8565U CPU @ 1.80GHz | 1 | 4% |
| Intel Core i7-4900MQ CPU @ 2.80GHz | 1 | 4% |
| Intel Core i7-4710HQ CPU @ 2.50GHz | 1 | 4% |
| Intel Core i7-2630QM CPU @ 2.00GHz | 1 | 4% |
| Intel Core i5-7200U CPU @ 2.50GHz | 1 | 4% |
| Intel Core i5-3317U CPU @ 1.70GHz | 1 | 4% |
| Intel Core i5-2430M CPU @ 2.40GHz | 1 | 4% |
| Intel Core i5 CPU M 540 @ 2.53GHz | 1 | 4% |
| Intel Core i3-5010U CPU @ 2.10GHz | 1 | 4% |
| Intel Core i3-2310M CPU @ 2.10GHz | 1 | 4% |
| Intel Core 2 Duo CPU T6600 @ 2.20GHz | 1 | 4% |
| Intel Core 2 Duo CPU T5470 @ 1.60GHz | 1 | 4% |
| Intel Core 2 Duo CPU P8600 @ 2.40GHz | 1 | 4% |
| Intel Core 2 CPU T7200 @ 2.00GHz | 1 | 4% |
| AMD Ryzen 5 3550H with Radeon Vega Mobile Gfx | 1 | 4% |
| AMD FX-9830P RADEON R7, 12 COMPUTE CORES 4C+8G | 1 | 4% |
| AMD E-300 APU with Radeon HD Graphics | 1 | 4% |
| AMD A9-9410 RADEON R5, 5 COMPUTE CORES 2C+3G | 1 | 4% |
CPU Model Family
Processor model prefix
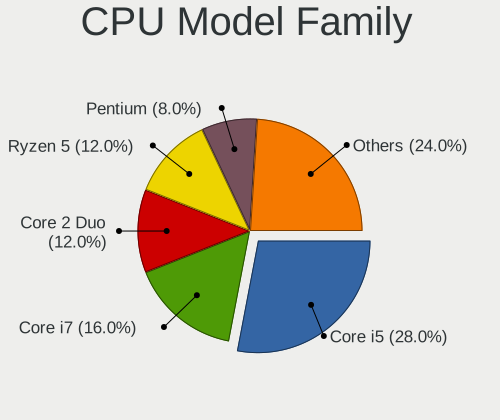

| Model | Computers | Percent |
|---|---|---|
| Intel Core i5 | 7 | 28% |
| Intel Core i7 | 4 | 16% |
| Intel Core 2 Duo | 3 | 12% |
| AMD Ryzen 5 | 3 | 12% |
| Intel Pentium | 2 | 8% |
| Intel Core i3 | 2 | 8% |
| Other | 1 | 4% |
| Intel Core 2 | 1 | 4% |
| AMD FX | 1 | 4% |
| AMD E | 1 | 4% |
CPU Cores
Number of processor cores


| Number | Computers | Percent |
|---|---|---|
| 2 | 15 | 60% |
| 4 | 10 | 40% |
CPU Sockets
Number of sockets


| Number | Computers | Percent |
|---|---|---|
| 1 | 25 | 100% |
CPU Threads
Threads per core (Hyper-Threading)


| Number | Computers | Percent |
|---|---|---|
| 2 | 17 | 68% |
| 1 | 8 | 32% |
CPU Op-Modes
CPU Operation Modes (32-bit, 64-bit)


| Op mode | Computers | Percent |
|---|---|---|
| 32-bit, 64-bit | 24 | 96% |
| Unknown | 1 | 4% |
CPU Microarch
Microarchitecture


| Name | Computers | Percent |
|---|---|---|
| Skylake | 5 | 20% |
| Core | 4 | 16% |
| Zen+ | 3 | 12% |
| SandyBridge | 3 | 12% |
| IvyBridge | 3 | 12% |
| Haswell | 2 | 8% |
| Excavator | 2 | 8% |
| Westmere | 1 | 4% |
| Broadwell | 1 | 4% |
| Bobcat | 1 | 4% |
CPU Microcode
Microcode number


| Number | Computers | Percent |
|---|---|---|
| 0x806eb | 3 | 12% |
| 0x306a9 | 3 | 12% |
| 0x206a7 | 3 | 12% |
| 0x306c3 | 2 | 8% |
| 0x1067a | 2 | 8% |
| 0x08108109 | 2 | 8% |
| 0x806ec | 1 | 4% |
| 0x806e9 | 1 | 4% |
| 0x6fd | 1 | 4% |
| 0x6f6 | 1 | 4% |
| 0x306d4 | 1 | 4% |
| 0x20652 | 1 | 4% |
| 0x08108102 | 1 | 4% |
| 0x06006704 | 1 | 4% |
| 0x0600611a | 1 | 4% |
| 0x05000119 | 1 | 4% |
GPU Vendor
Vendors of graphics cards


| Vendor | Computers | Percent |
|---|---|---|
| Intel | 14 | 46.67% |
| Nvidia | 8 | 26.67% |
| AMD | 8 | 26.67% |
GPU Model
Graphics card models


| Model | Computers | Percent |
|---|---|---|
| UHD Graphics 620 (Whiskey Lake) | 4 | 12.9% |
| Picasso | 3 | 9.68% |
| 3rd Gen Core processor Graphics Controller | 3 | 9.68% |
| 2nd Generation Core Processor Family Integrated Graphics Controller | 3 | 9.68% |
| Wrestler [Radeon HD 6310] | 1 | 3.23% |
| Wani [Radeon R5/R6/R7 Graphics] | 1 | 3.23% |
| TU117M [GeForce GTX 1650 Mobile / Max-Q] | 1 | 3.23% |
| Stoney [Radeon R2/R3/R4/R5 Graphics] | 1 | 3.23% |
| RV710/M92 [Mobility Radeon HD 4530/4570/545v] | 1 | 3.23% |
| RV515/M54 [Mobility Radeon X1400] | 1 | 3.23% |
| Mobile GME965/GLE960 Integrated Graphics Controller | 1 | 3.23% |
| HD Graphics 620 | 1 | 3.23% |
| HD Graphics 5500 | 1 | 3.23% |
| GT218M [NVS 3100M] | 1 | 3.23% |
| GP108M [GeForce MX150] | 1 | 3.23% |
| GM107M [GeForce GTX 860M] | 1 | 3.23% |
| GK104M [GeForce GTX 880M] | 1 | 3.23% |
| GF119M [GeForce GT 520M] | 1 | 3.23% |
| GF108M [GeForce GT 540M] | 1 | 3.23% |
| G98M [Quadro NVS 160M] | 1 | 3.23% |
| Baffin [Radeon RX 460/560D / Pro 450/455/460/555/555X/560/560X] | 1 | 3.23% |
| 4th Gen Core Processor Integrated Graphics Controller | 1 | 3.23% |
GPU Combo
Combinations of graphics cards


| Name | Computers | Percent |
|---|---|---|
| 1 x Intel | 10 | 40% |
| 1 x AMD | 6 | 24% |
| Intel + Nvidia | 4 | 16% |
| 1 x Nvidia | 3 | 12% |
| 2 x AMD | 1 | 4% |
| AMD + Nvidia | 1 | 4% |
GPU Driver
Free vs proprietary


| Driver | Computers | Percent |
|---|---|---|
| Free | 21 | 84% |
| Proprietary | 4 | 16% |
GPU Memory
Total video memory


| Size in GB | Computers | Percent |
|---|---|---|
| Unknown | 9 | 36% |
| 0.01-0.5 | 7 | 28% |
| 0.51-1.0 | 5 | 20% |
| 1.01-2.0 | 2 | 8% |
| 7.01-8.0 | 1 | 4% |
| 3.01-4.0 | 1 | 4% |
Monitor Vendor
Monitor vendors


| Vendor | Computers | Percent |
|---|---|---|
| Samsung Electronics | 4 | 16.67% |
| Chimei Innolux | 4 | 16.67% |
| LG Display | 3 | 12.5% |
| Chi Mei Optoelectronics | 3 | 12.5% |
| BOE | 3 | 12.5% |
| AU Optronics | 3 | 12.5% |
| SKY | 1 | 4.17% |
| Seiko/Epson | 1 | 4.17% |
| LG Philips | 1 | 4.17% |
| LG Electronics | 1 | 4.17% |
Monitor Model
Monitor models


| Model | Computers | Percent |
|---|---|---|
| TV-monitor SKY0202 1920x1080 885x498mm 40.0-inch | 1 | 4.17% |
| P130ZDZ-EF1 CMN8201 2160x1440 275x183mm 13.0-inch | 1 | 4.17% |
| LCD Monitor SEC4D42 1280x800 303x190mm 14.1-inch | 1 | 4.17% |
| LCD Monitor SEC3245 1366x768 344x194mm 15.5-inch | 1 | 4.17% |
| LCD Monitor SDC324C 1920x1080 344x194mm 15.5-inch | 1 | 4.17% |
| LCD Monitor LPL0140 1440x900 304x190mm 14.1-inch | 1 | 4.17% |
| LCD Monitor LGD05EC 1920x1080 309x174mm 14.0-inch | 1 | 4.17% |
| LCD Monitor LGD0503 1366x768 340x190mm 15.3-inch | 1 | 4.17% |
| LCD Monitor LGD0396 1600x900 382x215mm 17.3-inch | 1 | 4.17% |
| LCD Monitor LG TV 1920x1080 | 1 | 4.17% |
| LCD Monitor CMO15AB 1366x768 340x190mm 15.3-inch | 1 | 4.17% |
| LCD Monitor CMO15A2 1366x768 344x193mm 15.5-inch | 1 | 4.17% |
| LCD Monitor CMO1332 1366x768 293x164mm 13.2-inch | 1 | 4.17% |
| LCD Monitor CMN15E8 1920x1080 344x193mm 15.5-inch | 1 | 4.17% |
| LCD Monitor CMN15D5 1920x1080 340x190mm 15.3-inch | 1 | 4.17% |
| LCD Monitor CMN1404 1920x1080 309x173mm 13.9-inch | 1 | 4.17% |
| LCD Monitor BOE07D5 1920x1080 344x194mm 15.5-inch | 1 | 4.17% |
| LCD Monitor BOE0675 1366x768 344x194mm 15.5-inch | 1 | 4.17% |
| LCD Monitor BOE0644 1366x768 309x173mm 13.9-inch | 1 | 4.17% |
| LCD Monitor AUO312C 1366x768 293x164mm 13.2-inch | 1 | 4.17% |
| LCD Monitor AUO23EC 1366x768 344x193mm 15.5-inch | 1 | 4.17% |
| LCD Monitor AUO20EC 1366x768 344x193mm 15.5-inch | 1 | 4.17% |
| LCD Monitor 1920x1080 | 1 | 4.17% |
| 173HT02-T01 SEC5044 1920x1080 380x210mm 17.1-inch | 1 | 4.17% |
Monitor Resolution
Monitor screen resolution


| Resolution | Computers | Percent |
|---|---|---|
| 1366x768 (WXGA) | 10 | 43.48% |
| 1920x1080 (FHD) | 9 | 39.13% |
| 2160x1440 | 1 | 4.35% |
| 1600x900 (HD+) | 1 | 4.35% |
| 1440x900 (WXGA+) | 1 | 4.35% |
| 1280x800 (WXGA) | 1 | 4.35% |
Monitor Diagonal
Diagonal size in inches


| Inches | Computers | Percent |
|---|---|---|
| 15 | 11 | 45.83% |
| 13 | 5 | 20.83% |
| 14 | 3 | 12.5% |
| 17 | 2 | 8.33% |
| Unknown | 2 | 8.33% |
| 40 | 1 | 4.17% |
Monitor Width
Physical width


| Width in mm | Computers | Percent |
|---|---|---|
| 301-350 | 15 | 62.5% |
| 201-300 | 4 | 16.67% |
| 351-400 | 2 | 8.33% |
| Unknown | 2 | 8.33% |
| 801-900 | 1 | 4.17% |
Aspect Ratio
Proportional relationship between the width and the height


| Ratio | Computers | Percent |
|---|---|---|
| 16/9 | 19 | 79.17% |
| 16/10 | 2 | 8.33% |
| Unknown | 2 | 8.33% |
| 3/2 | 1 | 4.17% |
Monitor Area
Area in inch²


| Area in inch² | Computers | Percent |
|---|---|---|
| 101-110 | 10 | 41.67% |
| 81-90 | 5 | 20.83% |
| 71-80 | 3 | 12.5% |
| 121-130 | 2 | 8.33% |
| Unknown | 2 | 8.33% |
| 501-1000 | 1 | 4.17% |
| 91-100 | 1 | 4.17% |
Pixel Density
Pixels per inch


| Density | Computers | Percent |
|---|---|---|
| 101-120 | 12 | 50% |
| 121-160 | 8 | 33.33% |
| Unknown | 2 | 8.33% |
| 161-240 | 1 | 4.17% |
| 51-100 | 1 | 4.17% |
Multiple Monitors
Total monitors connected


| Total | Computers | Percent |
|---|---|---|
| 1 | 23 | 92% |
| 2 | 2 | 8% |
Net Controller Vendor
Controller vendors


| Vendor | Computers | Percent |
|---|---|---|
| Intel | 4 | 66.67% |
| Dell | 2 | 33.33% |
Net Controller Model
Controller models


| Model | Computers | Percent |
|---|---|---|
| F3607gw v2 Mobile Broadband Module | 1 | 12.5% |
| DW5550 | 1 | 12.5% |
| Centrino Advanced-N 6205 [Taylor Peak] | 1 | 12.5% |
| Centrino Advanced-N 6200 | 1 | 12.5% |
| 82579LM Gigabit Network Connection (Lewisville) | 1 | 12.5% |
| 82577LM Gigabit Network Connection | 1 | 12.5% |
| 82567LM Gigabit Network Connection | 1 | 12.5% |
| 82562GT 10/100 Network Connection | 1 | 12.5% |
Net Controller Kind
Ethernet, WiFi or modem


| Kind | Computers | Percent |
|---|---|---|
| Ethernet | 4 | 50% |
| Modem | 2 | 25% |
| WiFi | 2 | 25% |
Used Controller
Currently used network controller


| Kind | Computers | Percent |
|---|---|---|
| WiFi | 1 | 50% |
| Ethernet | 1 | 50% |
NICs
Total network controllers on board


| Total | Computers | Percent |
|---|---|---|
| 2 | 21 | 84% |
| 1 | 4 | 16% |
Unsupported Devices
Total unsupported devices on board


| Total | Computers | Percent |
|---|---|---|
| 1 | 12 | 48% |
| 0 | 11 | 44% |
| 2 | 2 | 8% |
Unsupported Device Types
Types of unsupported devices


| Type | Computers | Percent |
|---|---|---|
| Fingerprint reader | 6 | 40% |
| Graphics card | 3 | 20% |
| Chipcard | 3 | 20% |
| Net/wireless | 2 | 13.33% |
| Multimedia controller | 1 | 6.67% |