Zorin Hardware Trends
A project to identify most popular hardware characteristics and track their change over time based on data collected by Zorin users at https://Linux-Hardware.org.
Anyone can contribute to the study by uploading probes of their computers by the hw-probe tool:
sudo hw-probe -all -uploadThis is a report for all computer types. See also reports for desktops and notebooks.
Full-feature report is available here: https://linux-hardware.org/?view=trends
Period: Apr, 2020.
Contents
- OS
- OS Family
- Kernel
- Kernel Family
- Kernel Major Ver.
- Arch
- DE
- Display Server
- Display Manager
- OS Lang
- Boot Mode
- Filesystem
- Dual Boot with Linux/BSD
- Dual Boot (Win)
- Country
- City
- Vendor
- Model
- Model Family
- MFG Year
- Form Factor
- Secure Boot
- Coreboot
- RAM Size
- RAM Used
- Drive Vendor
- Drive Model
- Drive Kind
- Drive Connector
- Drive Size
- Space Total
- Space Used
- Malfunc. Drives
- Malfunc. Drive Vendor
- Malfunc. Drive Kind
- Failed Drives
- Failed Drive Vendor
- Drive Status
- Storage Vendor
- Storage Model
- Storage Kind
- CPU Vendor
- CPU Model
- CPU Model Family
- CPU Cores
- CPU Sockets
- CPU Threads
- CPU Op-Modes
- CPU Microarch
- CPU Microcode
- GPU Vendor
- GPU Model
- GPU Combo
- GPU Driver
- GPU Memory
- Monitor Vendor
- Monitor Model
- Monitor Resolution
- Monitor Diagonal
- Monitor Width
- Aspect Ratio
- Monitor Area
- Pixel Density
- Multiple Monitors
- Net Controller Vendor
- Net Controller Model
- Net Controller Kind
- Used Controller
- NICs
- Unsupported Devices
- Unsupported Device Types
OS
Installed operating systems


| Name | Computers | Percent |
|---|---|---|
| Zorin 15 | 118 | 92.19% |
| Zorin 12 | 10 | 7.81% |
OS Family
OS without a version


| Name | Computers | Percent |
|---|---|---|
| Zorin | 128 | 100% |
Kernel
Version of the Linux kernel


| Version | Computers | Percent |
|---|---|---|
| 5.3.0-46-generic | 71 | 55.47% |
| 5.3.0-45-generic | 24 | 18.75% |
| 5.3.0-40-generic | 14 | 10.94% |
| 4.15.0-91-generic | 5 | 3.91% |
| 5.3.0-51-generic | 3 | 2.34% |
| 5.3.0-42-generic | 3 | 2.34% |
| 4.15.0-30-generic | 2 | 1.56% |
| 5.3.0-47-generic | 1 | 0.78% |
| 5.0.0-37-generic | 1 | 0.78% |
| 5.0.0-32-generic | 1 | 0.78% |
| 4.4.0-176-generic | 1 | 0.78% |
| 4.15.0-96-generic | 1 | 0.78% |
| 4.15.0-72-generic | 1 | 0.78% |
Kernel Family
Linux kernel without a distro release


| Version | Computers | Percent |
|---|---|---|
| 5.3.0 | 116 | 90.63% |
| 4.15.0 | 9 | 7.03% |
| 5.0.0 | 2 | 1.56% |
| 4.4.0 | 1 | 0.78% |
Kernel Major Ver.
Linux kernel major version


| Version | Computers | Percent |
|---|---|---|
| 5.3 | 116 | 90.63% |
| 4.15 | 9 | 7.03% |
| 5.0 | 2 | 1.56% |
| 4.4 | 1 | 0.78% |
Arch
OS architecture (x86_64, i586, etc.)


| Name | Computers | Percent |
|---|---|---|
| x86_64 | 103 | 80.47% |
| i686 | 25 | 19.53% |
DE
Desktop Environment
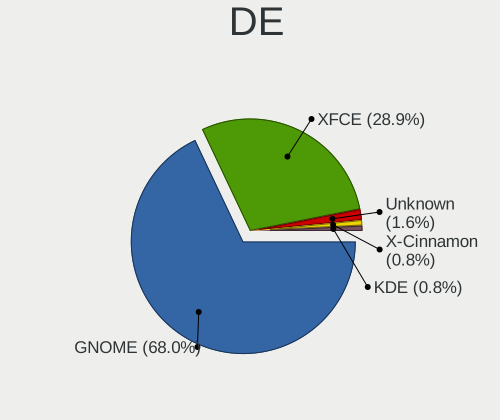

| Name | Computers | Percent |
|---|---|---|
| GNOME | 87 | 67.97% |
| XFCE | 37 | 28.91% |
| Unknown | 2 | 1.56% |
| X-Cinnamon | 1 | 0.78% |
| KDE | 1 | 0.78% |
Display Server
X11 or Wayland


| Name | Computers | Percent |
|---|---|---|
| X11 | 126 | 98.44% |
| Wayland | 1 | 0.78% |
| Unknown | 1 | 0.78% |
Display Manager
SDDM, LightDM, etc.


| Name | Computers | Percent |
|---|---|---|
| Unknown | 127 | 99.22% |
| LightDM | 1 | 0.78% |
OS Lang
Language


| Lang | Computers | Percent |
|---|---|---|
| en_US | 43 | 33.59% |
| it_IT | 9 | 7.03% |
| en_CA | 9 | 7.03% |
| en_GB | 8 | 6.25% |
| de_DE | 8 | 6.25% |
| pt_BR | 5 | 3.91% |
| fr_FR | 5 | 3.91% |
| es_ES | 5 | 3.91% |
| tr_TR | 3 | 2.34% |
| en_IN | 3 | 2.34% |
| pt_PT | 2 | 1.56% |
| es_PE | 2 | 1.56% |
| es_AR | 2 | 1.56% |
| en_PH | 2 | 1.56% |
| de_AT | 2 | 1.56% |
| C | 2 | 1.56% |
| sv_SE | 1 | 0.78% |
| ru_UA | 1 | 0.78% |
| ru_RU | 1 | 0.78% |
| pl_PL | 1 | 0.78% |
| nl_BE | 1 | 0.78% |
| ko_KR | 1 | 0.78% |
| fr_CA | 1 | 0.78% |
| fi_FI | 1 | 0.78% |
| es_US | 1 | 0.78% |
| es_MX | 1 | 0.78% |
| es_CO | 1 | 0.78% |
| en_ZA | 1 | 0.78% |
| en_SG | 1 | 0.78% |
| en_IL | 1 | 0.78% |
| en_AU | 1 | 0.78% |
| el_GR | 1 | 0.78% |
| cs_CZ | 1 | 0.78% |
| bs_BA | 1 | 0.78% |
Boot Mode
EFI or BIOS


| Mode | Computers | Percent |
|---|---|---|
| BIOS | 90 | 70.31% |
| EFI | 38 | 29.69% |
Filesystem
Type of filesystem


| Type | Computers | Percent |
|---|---|---|
| Ext4 | 123 | 96.09% |
| Overlay | 4 | 3.13% |
| Ext2 | 1 | 0.78% |
Dual Boot with Linux/BSD
Hosting more than one Linux/BSD


| Dual boot | Computers | Percent |
|---|---|---|
| No | 117 | 91.41% |
| Yes | 11 | 8.59% |
Dual Boot (Win)
Hosting Linux and Windows


| Dual boot | Computers | Percent |
|---|---|---|
| No | 82 | 64.06% |
| Yes | 46 | 35.94% |
Country
Geographic location (country)


| Country | Computers | Percent |
|---|---|---|
| USA | 27 | 21.09% |
| Canada | 10 | 7.81% |
| Italy | 9 | 7.03% |
| Germany | 9 | 7.03% |
| UK | 8 | 6.25% |
| France | 5 | 3.91% |
| Brazil | 5 | 3.91% |
| Spain | 4 | 3.13% |
| Turkey | 3 | 2.34% |
| Mexico | 3 | 2.34% |
| India | 3 | 2.34% |
| Tunisia | 2 | 1.56% |
| Portugal | 2 | 1.56% |
| Poland | 2 | 1.56% |
| Philippines | 2 | 1.56% |
| Peru | 2 | 1.56% |
| Indonesia | 2 | 1.56% |
| Greece | 2 | 1.56% |
| Colombia | 2 | 1.56% |
| Austria | 2 | 1.56% |
| Argentina | 2 | 1.56% |
| Ukraine | 1 | 0.78% |
| UAE | 1 | 0.78% |
| Sweden | 1 | 0.78% |
| South Africa | 1 | 0.78% |
| Slovakia | 1 | 0.78% |
| Singapore | 1 | 0.78% |
| Serbia | 1 | 0.78% |
| Russia | 1 | 0.78% |
| Romania | 1 | 0.78% |
| Norway | 1 | 0.78% |
| New Zealand | 1 | 0.78% |
| Lithuania | 1 | 0.78% |
| Israel | 1 | 0.78% |
| Hungary | 1 | 0.78% |
| Finland | 1 | 0.78% |
| Egypt | 1 | 0.78% |
| Czech Republic | 1 | 0.78% |
| Bulgaria | 1 | 0.78% |
| Bosnia and Herzegovina | 1 | 0.78% |
| Belgium | 1 | 0.78% |
| Bangladesh | 1 | 0.78% |
| Australia | 1 | 0.78% |
City
Geographic location (city)


| City | Computers | Percent |
|---|---|---|
| Toronto | 3 | 2.34% |
| Yalova | 2 | 1.56% |
| Vienna | 2 | 1.56% |
| Oklahoma City | 2 | 1.56% |
| Houston | 2 | 1.56% |
| Biarritz | 2 | 1.56% |
| Berlin | 2 | 1.56% |
| Zulpich | 1 | 0.78% |
| Zaventem | 1 | 0.78% |
| Wimborne Minster | 1 | 0.78% |
| West Des Moines | 1 | 0.78% |
| Wasilla | 1 | 0.78% |
| Villetelle | 1 | 0.78% |
| Villaviciosa de Odon | 1 | 0.78% |
| Villaspeciosa | 1 | 0.78% |
| Versailles | 1 | 0.78% |
| Velddrif | 1 | 0.78% |
| Ulm | 1 | 0.78% |
| Tuzla | 1 | 0.78% |
| Turin | 1 | 0.78% |
| Trujillo | 1 | 0.78% |
| Timmins | 1 | 0.78% |
| Tijuana | 1 | 0.78% |
| Thrissur | 1 | 0.78% |
| Thessaloniki | 1 | 0.78% |
| Tel Aviv | 1 | 0.78% |
| Tampines New Town | 1 | 0.78% |
| Sydney | 1 | 0.78% |
| Surabaya | 1 | 0.78% |
| St. Albert | 1 | 0.78% |
| Sorocaba | 1 | 0.78% |
| Sofia | 1 | 0.78% |
| Sintra | 1 | 0.78% |
| Sevenoaks | 1 | 0.78% |
| Sestri Levante | 1 | 0.78% |
| Scarborough | 1 | 0.78% |
| Sant Andreu de la Barca | 1 | 0.78% |
| Saint-Avold | 1 | 0.78% |
| Saeffle | 1 | 0.78% |
| Robinson | 1 | 0.78% |
| Rialto | 1 | 0.78% |
| Quijingue | 1 | 0.78% |
| Querétaro City | 1 | 0.78% |
| Písek | 1 | 0.78% |
| Porvoo | 1 | 0.78% |
| Portland | 1 | 0.78% |
| Piquillin | 1 | 0.78% |
| Phoenix | 1 | 0.78% |
| Oslo | 1 | 0.78% |
| Osasco | 1 | 0.78% |
| Novi Sad | 1 | 0.78% |
| Northampton | 1 | 0.78% |
| New Delhi | 1 | 0.78% |
| Neuwied | 1 | 0.78% |
| Nelson | 1 | 0.78% |
| Naples | 1 | 0.78% |
| Nagpur | 1 | 0.78% |
| Mogilno | 1 | 0.78% |
| Milan | 1 | 0.78% |
| Mestre | 1 | 0.78% |
Vendor
Motherboard manufacturer


| Name | Computers | Percent |
|---|---|---|
| Hewlett-Packard | 23 | 17.97% |
| Dell | 21 | 16.41% |
| Lenovo | 15 | 11.72% |
| ASUSTek Computer | 13 | 10.16% |
| Acer | 11 | 8.59% |
| Toshiba | 6 | 4.69% |
| MSI | 5 | 3.91% |
| Gigabyte Technology | 4 | 3.13% |
| Sony | 3 | 2.34% |
| ASRock | 3 | 2.34% |
| Samsung Electronics | 2 | 1.56% |
| Gateway | 2 | 1.56% |
| Clevo | 2 | 1.56% |
| Apple | 2 | 1.56% |
| Universal Exports Group Limited | 1 | 0.78% |
| Pegatron | 1 | 0.78% |
| PCChips | 1 | 0.78% |
| Packard Bell | 1 | 0.78% |
| Nuvision | 1 | 0.78% |
| Notebook | 1 | 0.78% |
| NEC Computers | 1 | 0.78% |
| Medion | 1 | 0.78% |
| IBM | 1 | 0.78% |
| Fujitsu Siemens | 1 | 0.78% |
| Fujitsu | 1 | 0.78% |
| Ematic | 1 | 0.78% |
| eMachines | 1 | 0.78% |
| ECS | 1 | 0.78% |
| Dixonsxp | 1 | 0.78% |
| AXIOO | 1 | 0.78% |
Model
Motherboard model


| Name | Computers | Percent |
|---|---|---|
| Dell Latitude E6410 | 2 | 1.56% |
| Universal Exports Group Limited ITL 1161-32 | 1 | 0.78% |
| Toshiba Satellite L550 | 1 | 0.78% |
| Toshiba Satellite L450 | 1 | 0.78% |
| Toshiba Satellite C855D | 1 | 0.78% |
| Toshiba Satellite C850D-B810 | 1 | 0.78% |
| Toshiba Satellite A200 | 1 | 0.78% |
| Toshiba Satellite A100 | 1 | 0.78% |
| Sony VPCYB35AL | 1 | 0.78% |
| Sony VPCEB3M1E | 1 | 0.78% |
| Sony VGN-AW11Z_B | 1 | 0.78% |
| Samsung Electronics RV410/RV510/S3510/E3510 | 1 | 0.78% |
| Samsung Electronics 905S3G/906S3G/915S3G/9305SG | 1 | 0.78% |
| Pegatron AY643AA-ABA s5310f | 1 | 0.78% |
| PCChips P49G | 1 | 0.78% |
| Packard Bell EasyNote TJ65 | 1 | 0.78% |
| Nuvision NES11 | 1 | 0.78% |
| Notebook N750BU | 1 | 0.78% |
| NEC Computers PC-VY24GXZ7A | 1 | 0.78% |
| MSI Ver.001 | 1 | 0.78% |
| MSI MS-7721 | 1 | 0.78% |
| MSI MS-7267 | 1 | 0.78% |
| MSI MS-1688 | 1 | 0.78% |
| MSI GT72 2PC | 1 | 0.78% |
| Medion E5217 | 1 | 0.78% |
| Lenovo Yoga C740-15IML 81TD | 1 | 0.78% |
| Lenovo V130-15IGM 81HL | 1 | 0.78% |
| Lenovo ThinkPad X60 1707Y91 | 1 | 0.78% |
| Lenovo ThinkPad T440s 20AQ009HUS | 1 | 0.78% |
| Lenovo ThinkPad T420 42368H6 | 1 | 0.78% |
| Lenovo ThinkPad Edge E440 20C5007MRI | 1 | 0.78% |
| Lenovo ThinkPad 11e 20DAS0YW00 | 1 | 0.78% |
| Lenovo IdeaPad S130-11IGM 81J1 | 1 | 0.78% |
| Lenovo IdeaPad 520-15IKB 80YL | 1 | 0.78% |
| Lenovo IdeaPad 330-15IKB 81DC | 1 | 0.78% |
| Lenovo IdeaPad 330-14AST 81D5 | 1 | 0.78% |
| Lenovo IdeaPad 100S-14IBR 80R9 | 1 | 0.78% |
| Lenovo IdeaCentre Q180 10087&3110 | 1 | 0.78% |
| Lenovo IdeaCentre A340-24IWL F0E800FNGE | 1 | 0.78% |
| Lenovo G580 20157 | 1 | 0.78% |
| IBM ThinkPad X40 2371H4G | 1 | 0.78% |
| HP Stream Laptop 14-ax0XX | 1 | 0.78% |
| HP rp5800 | 1 | 0.78% |
| HP ProBook 450 G2 | 1 | 0.78% |
| HP Presario V3700 | 1 | 0.78% |
| HP Pavilion dv9500 | 1 | 0.78% |
| HP Pavilion dv6 | 1 | 0.78% |
| HP Pavilion dv1000 (ET735UA#ABL) | 1 | 0.78% |
| HP Pavilion All-in-One 24-xa0xxx | 1 | 0.78% |
| HP Pavilion 17 | 1 | 0.78% |
| HP Pavilion 15 | 1 | 0.78% |
| HP Mini 5103 | 1 | 0.78% |
| HP Laptop 15-dw0xxx | 1 | 0.78% |
| HP Laptop 15-da0xxx | 1 | 0.78% |
| HP Gaming PC | 1 | 0.78% |
| HP G62 | 1 | 0.78% |
| HP EliteBook 8460p | 1 | 0.78% |
| HP Compaq Presario CQ60 | 1 | 0.78% |
| HP Compaq Mini 110c-1100 | 1 | 0.78% |
| HP Compaq dc5850 Small Form Factor | 1 | 0.78% |
Model Family
Motherboard model prefix


| Name | Computers | Percent |
|---|---|---|
| Dell Latitude | 8 | 6.25% |
| Dell Inspiron | 7 | 5.47% |
| Toshiba Satellite | 6 | 4.69% |
| HP Pavilion | 6 | 4.69% |
| Lenovo ThinkPad | 5 | 3.91% |
| Lenovo IdeaPad | 5 | 3.91% |
| Acer Aspire | 5 | 3.91% |
| HP Compaq | 3 | 2.34% |
| Dell OptiPlex | 3 | 2.34% |
| Acer Nitro | 3 | 2.34% |
| Lenovo IdeaCentre | 2 | 1.56% |
| HP Laptop | 2 | 1.56% |
| Universal Exports Group Limited ITL | 1 | 0.78% |
| Sony VPCYB35AL | 1 | 0.78% |
| Sony VPCEB3M1E | 1 | 0.78% |
| Sony VGN-AW11Z | 1 | 0.78% |
| Samsung Electronics RV410 | 1 | 0.78% |
| Samsung Electronics 905S3G | 1 | 0.78% |
| Pegatron AY643AA-ABA | 1 | 0.78% |
| PCChips P49G | 1 | 0.78% |
| Packard Bell EasyNote | 1 | 0.78% |
| Nuvision NES11 | 1 | 0.78% |
| Notebook N750BU | 1 | 0.78% |
| NEC Computers PC-VY24GXZ7A | 1 | 0.78% |
| MSI Ver.001 | 1 | 0.78% |
| MSI MS-7721 | 1 | 0.78% |
| MSI MS-7267 | 1 | 0.78% |
| MSI MS-1688 | 1 | 0.78% |
| MSI GT72 | 1 | 0.78% |
| Medion E5217 | 1 | 0.78% |
| Lenovo Yoga | 1 | 0.78% |
| Lenovo V130-15IGM | 1 | 0.78% |
| Lenovo G580 | 1 | 0.78% |
| IBM ThinkPad | 1 | 0.78% |
| HP Stream | 1 | 0.78% |
| HP rp5800 | 1 | 0.78% |
| HP ProBook | 1 | 0.78% |
| HP Presario | 1 | 0.78% |
| HP Mini | 1 | 0.78% |
| HP Gaming | 1 | 0.78% |
| HP G62 | 1 | 0.78% |
| HP EliteBook | 1 | 0.78% |
| HP 550 | 1 | 0.78% |
| HP 255 | 1 | 0.78% |
| HP 2133 | 1 | 0.78% |
| HP 15 | 1 | 0.78% |
| Gigabyte H67M-D2-B3 | 1 | 0.78% |
| Gigabyte GA-78LMT-USB3 | 1 | 0.78% |
| Gigabyte AM1M-S2H | 1 | 0.78% |
| Gigabyte 970A-DS3P | 1 | 0.78% |
| Gateway MX3225 | 1 | 0.78% |
| Gateway ML6228 | 1 | 0.78% |
| Fujitsu Siemens AMILO | 1 | 0.78% |
| Fujitsu ESPRIMO | 1 | 0.78% |
| Ematic EW147 | 1 | 0.78% |
| eMachines G630 | 1 | 0.78% |
| ECS MCP61M-M3 | 1 | 0.78% |
| Dell Vostro | 1 | 0.78% |
| Dell Precision | 1 | 0.78% |
| Dell DM051 | 1 | 0.78% |
MFG Year
Motherboard manufacture year


| Year | Computers | Percent |
|---|---|---|
| 2019 | 20 | 15.63% |
| 2008 | 14 | 10.94% |
| 2010 | 12 | 9.38% |
| 2009 | 10 | 7.81% |
| 2013 | 9 | 7.03% |
| 2011 | 9 | 7.03% |
| 2007 | 9 | 7.03% |
| 2018 | 8 | 6.25% |
| 2015 | 8 | 6.25% |
| 2014 | 8 | 6.25% |
| 2006 | 6 | 4.69% |
| 2012 | 5 | 3.91% |
| 2016 | 4 | 3.13% |
| 2017 | 3 | 2.34% |
| 2005 | 2 | 1.56% |
| 2020 | 1 | 0.78% |
Form Factor
Physical design of the computer


| Name | Computers | Percent |
|---|---|---|
| Notebook | 94 | 73.44% |
| Desktop | 29 | 22.66% |
| All in one | 3 | 2.34% |
| Convertible | 2 | 1.56% |
Secure Boot
Enabled or disabled


| State | Computers | Percent |
|---|---|---|
| Disabled | 117 | 91.41% |
| Enabled | 11 | 8.59% |
Coreboot
Have coreboot on board


| Used | Computers | Percent |
|---|---|---|
| No | 128 | 100% |
RAM Size
Total RAM memory


| Size in GB | Computers | Percent |
|---|---|---|
| 3.01-4.0 | 50 | 39.06% |
| 1.01-2.0 | 24 | 18.75% |
| 4.01-8.0 | 22 | 17.19% |
| 8.01-16.0 | 13 | 10.16% |
| 16.01-24.0 | 8 | 6.25% |
| 2.01-3.0 | 6 | 4.69% |
| 0.01-1.0 | 3 | 2.34% |
| 24.01-32.0 | 1 | 0.78% |
| 64.01-256.0 | 1 | 0.78% |
RAM Used
Used RAM memory


| Used GB | Computers | Percent |
|---|---|---|
| 1.01-2.0 | 62 | 48.44% |
| 2.01-3.0 | 32 | 25% |
| 0.01-1.0 | 22 | 17.19% |
| 4.01-8.0 | 6 | 4.69% |
| 3.01-4.0 | 4 | 3.13% |
| 8.01-16.0 | 2 | 1.56% |
Drive Vendor
Hard drive vendors


| Vendor | Computers | Drives | Percent |
|---|---|---|---|
| Seagate | 31 | 32 | 21.09% |
| WDC | 25 | 27 | 17.01% |
| Hitachi | 17 | 17 | 11.56% |
| Samsung Electronics | 15 | 19 | 10.2% |
| Toshiba | 11 | 12 | 7.48% |
| Unknown | 9 | 14 | 6.12% |
| Crucial | 7 | 7 | 4.76% |
| Kingston | 6 | 7 | 4.08% |
| Fujitsu | 4 | 4 | 2.72% |
| SK Hynix | 3 | 3 | 2.04% |
| SanDisk | 2 | 2 | 1.36% |
| HGST | 2 | 2 | 1.36% |
| Transcend | 1 | 1 | 0.68% |
| TO Exter | 1 | 1 | 0.68% |
| SPCC | 1 | 1 | 0.68% |
| SABRENT | 1 | 1 | 0.68% |
| Patriot | 1 | 1 | 0.68% |
| OWC | 1 | 1 | 0.68% |
| Maxtor | 1 | 2 | 0.68% |
| LITEONIT | 1 | 1 | 0.68% |
| LITEON | 1 | 1 | 0.68% |
| KINGMAX | 1 | 1 | 0.68% |
| KingDian | 1 | 1 | 0.68% |
| Intenso | 1 | 1 | 0.68% |
| HL-DT-ST | 1 | 1 | 0.68% |
| DOGFISH | 1 | 1 | 0.68% |
| A-DATA Technology | 1 | 1 | 0.68% |
Drive Model
Hard drive models


| Model | Computers | Percent |
|---|---|---|
| MMC Card 32GB | 6 | 3.77% |
| ST2000LM007-1R8174 2TB | 3 | 1.89% |
| SA400S37480G 480GB SSD | 3 | 1.89% |
| SA400S37120G 120GB SSD | 3 | 1.89% |
| MMC Card 64GB | 3 | 1.89% |
| WD5000BEVT-22A0RT0 500GB | 2 | 1.26% |
| ST500LT012-1DG142 500GB | 2 | 1.26% |
| ST500DM002-1BD142 500GB | 2 | 1.26% |
| ST31000528AS 1TB | 2 | 1.26% |
| SSD 860 EVO 250GB | 2 | 1.26% |
| MQ04ABF100 1TB | 2 | 1.26% |
| HTS545050A7E380 500GB | 2 | 1.26% |
| HTS545032B9A300 320GB | 2 | 1.26% |
| HTS541612J9SA00 120GB | 2 | 1.26% |
| HD161HJ 160GB | 2 | 1.26% |
| CT500MX500SSD1 500GB | 2 | 1.26% |
| WDS250G2B0B-00YS70 250GB SSD | 1 | 0.63% |
| WDS120G2G0B-00EPW0 120GB SSD | 1 | 0.63% |
| WD800BD-22MRA1 80GB | 1 | 0.63% |
| WD6400AAKS-65A7B2 640GB | 1 | 0.63% |
| WD5000LPVX-80V0TT0 500GB | 1 | 0.63% |
| WD5000LPVX-22V0TT0 500GB | 1 | 0.63% |
| WD5000LPVT-22G33T0 500GB | 1 | 0.63% |
| WD5000BPVT-24HXZT1 500GB | 1 | 0.63% |
| WD5000AZLX-60K2TA0 500GB | 1 | 0.63% |
| WD5000AAKS-75A7B0 500GB | 1 | 0.63% |
| WD40EFRX-68N32N0 4TB | 1 | 0.63% |
| WD3200BUCT-63TWBY0 320GB | 1 | 0.63% |
| WD3200BEVT-60ZCT1 320GB | 1 | 0.63% |
| WD3200BEVS-26VAT0 320GB | 1 | 0.63% |
| WD3200BEKT-60PVMT0 320GB | 1 | 0.63% |
| WD3200AAJS-56B4A0 320GB | 1 | 0.63% |
| WD2500BEVT-22ZCT0 250GB | 1 | 0.63% |
| WD2500BEKT-60PVMT0 250GB | 1 | 0.63% |
| WD20SPZX-60UA7T0 2TB | 1 | 0.63% |
| WD1600BEVS-60RST0 160GB | 1 | 0.63% |
| WD1200BEVT-22ZCT0 120GB | 1 | 0.63% |
| WD10SPZX-22Z10T1 1TB | 1 | 0.63% |
| WD10SPZX-21Z10T0 1TB | 1 | 0.63% |
| WD10EZRX-00L4HB0 1TB | 1 | 0.63% |
| WD10EZEX-00RKKA0 1TB | 1 | 0.63% |
| TS480GJDM720 480GB SSD | 1 | 0.63% |
| SV2001H 20GB | 1 | 0.63% |
| SUV500120G 120GB SSD | 1 | 0.63% |
| ST9500325AS 500GB | 1 | 0.63% |
| ST9250315AS 250GB | 1 | 0.63% |
| ST9120823ASG 111XGB | 1 | 0.63% |
| ST9120817AS 120GB | 1 | 0.63% |
| ST500LM021-1KJ152 500GB | 1 | 0.63% |
| ST500LM012 HN-M500MBB 500GB | 1 | 0.63% |
| ST500LM000-1EJ162 500GB | 1 | 0.63% |
| ST500DM002-1SB10A 500GB | 1 | 0.63% |
| ST380815AS 80GB | 1 | 0.63% |
| ST380013AS 80GB | 1 | 0.63% |
| ST3500312CS 500GB | 1 | 0.63% |
| ST3400633AS 400GB | 1 | 0.63% |
| ST3200826AS 200GB | 1 | 0.63% |
| ST31000525SV 1TB | 1 | 0.63% |
| ST31000524AS 1TB | 1 | 0.63% |
| ST3000DM001-1CH166 3TB | 1 | 0.63% |
Drive Kind
HDD or SSD


| Kind | Computers | Drives | Percent |
|---|---|---|---|
| HDD | 90 | 104 | 64.29% |
| SSD | 38 | 41 | 27.14% |
| MMC | 9 | 14 | 6.43% |
| Unknown | 3 | 3 | 2.14% |
Drive Connector
SATA, SAS, NVMe, etc.


| Type | Computers | Drives | Percent |
|---|---|---|---|
| SATA | 117 | 143 | 89.31% |
| MMC | 9 | 14 | 6.87% |
| SAS | 5 | 5 | 3.82% |
Drive Size
Size of hard drive


| Size in TB | Computers | Drives | Percent |
|---|---|---|---|
| 0.01-0.5 | 109 | 128 | 77.3% |
| 0.51-1.0 | 22 | 24 | 15.6% |
| 1.01-2.0 | 8 | 8 | 5.67% |
| 3.01-4.0 | 1 | 1 | 0.71% |
| 2.01-3.0 | 1 | 1 | 0.71% |
Space Total
Amount of disk space available on the file system


| Size in GB | Computers | Percent |
|---|---|---|
| 101-250 | 39 | 30.47% |
| 251-500 | 33 | 25.78% |
| 51-100 | 17 | 13.28% |
| 21-50 | 14 | 10.94% |
| 1001-2000 | 9 | 7.03% |
| 501-1000 | 8 | 6.25% |
| 1-20 | 5 | 3.91% |
| More than 3000 | 2 | 1.56% |
| 2001-3000 | 1 | 0.78% |
Space Used
Amount of used disk space


| Used GB | Computers | Percent |
|---|---|---|
| 1-20 | 80 | 62.5% |
| 21-50 | 18 | 14.06% |
| 101-250 | 14 | 10.94% |
| 51-100 | 9 | 7.03% |
| 251-500 | 4 | 3.13% |
| 1001-2000 | 2 | 1.56% |
| 501-1000 | 1 | 0.78% |
Malfunc. Drives
Drive models with a malfunction
Zero info for selected period =(
Malfunc. Drive Vendor
Vendors of faulty drives
Zero info for selected period =(
Malfunc. Drive Kind
Kinds of faulty drives
Zero info for selected period =(
Failed Drives
Failed drive models
Zero info for selected period =(
Failed Drive Vendor
Failed drive vendors
Zero info for selected period =(
Drive Status
Number of failed and malfunc. drives


| Status | Computers | Drives | Percent |
|---|---|---|---|
| Detected | 126 | 162 | 100% |
Storage Vendor
Storage controller vendors


| Vendor | Computers | Percent |
|---|---|---|
| Intel | 94 | 71.76% |
| AMD | 19 | 14.5% |
| Nvidia | 5 | 3.82% |
| VIA Technologies | 4 | 3.05% |
| JMicron Technology | 3 | 2.29% |
| Samsung Electronics | 2 | 1.53% |
| Silicon Integrated Systems [SiS] | 1 | 0.76% |
| Silicon Image | 1 | 0.76% |
| Phison Electronics | 1 | 0.76% |
| Micron Technology | 1 | 0.76% |
Storage Model
Storage controller models


| Model | Computers | Percent |
|---|---|---|
| FCH SATA Controller [AHCI mode] | 11 | 6.63% |
| 82801 Mobile SATA Controller [RAID mode] | 10 | 6.02% |
| 82801G (ICH7 Family) IDE Controller | 9 | 5.42% |
| NM10/ICH7 Family SATA Controller [IDE mode] | 7 | 4.22% |
| 82801IBM/IEM (ICH9M/ICH9M-E) 4 port SATA Controller [AHCI mode] | 7 | 4.22% |
| 82801GBM/GHM (ICH7-M Family) SATA Controller [IDE mode] | 7 | 4.22% |
| 82801HM/HEM (ICH8M/ICH8M-E) IDE Controller | 6 | 3.61% |
| 8 Series SATA Controller 1 [AHCI mode] | 6 | 3.61% |
| Sunrise Point-LP SATA Controller [AHCI mode] | 5 | 3.01% |
| 82801HM/HEM (ICH8M/ICH8M-E) SATA Controller [AHCI mode] | 5 | 3.01% |
| 6 Series/C200 Series Chipset Family 6 port Desktop SATA AHCI Controller | 5 | 3.01% |
| 5 Series/3400 Series Chipset 4 port SATA AHCI Controller | 5 | 3.01% |
| SB7x0/SB8x0/SB9x0 SATA Controller [IDE mode] | 4 | 2.41% |
| 7 Series Chipset Family 6-port SATA Controller [AHCI mode] | 4 | 2.41% |
| VT82C586A/B/VT82C686/A/B/VT823x/A/C PIPC Bus Master IDE | 3 | 1.81% |
| SATA Controller [RAID mode] | 3 | 1.81% |
| MCP61 SATA Controller | 3 | 1.81% |
| Atom Processor E3800 Series SATA AHCI Controller | 3 | 1.81% |
| 82801GBM/GHM (ICH7-M Family) SATA Controller [AHCI mode] | 3 | 1.81% |
| 6 Series/C200 Series Chipset Family 6 port Mobile SATA AHCI Controller | 3 | 1.81% |
| SSD 660P Series | 2 | 1.2% |
| SB7x0/SB8x0/SB9x0 SATA Controller [AHCI mode] | 2 | 1.2% |
| SB7x0/SB8x0/SB9x0 IDE Controller | 2 | 1.2% |
| SATA controller | 2 | 1.2% |
| NVMe SSD Controller SM981/PM981/PM983 | 2 | 1.2% |
| MCP61 IDE | 2 | 1.2% |
| JMB368 IDE controller | 2 | 1.2% |
| Comet Lake SATA AHCI Controller | 2 | 1.2% |
| 8 Series/C220 Series Chipset Family 6-port SATA Controller 1 [AHCI mode] | 2 | 1.2% |
| X399 Series Chipset SATA Controller | 1 | 0.6% |
| VT8237A SATA 2-Port Controller | 1 | 0.6% |
| VT8237/8251 Serial ATA Controller | 1 | 0.6% |
| VIA VT6420 SATA RAID Controller | 1 | 0.6% |
| SB600 Non-Raid-5 SATA | 1 | 0.6% |
| SB600 IDE | 1 | 0.6% |
| SATA Controller / IDE mode | 1 | 0.6% |
| PCI0680 Ultra ATA-133 Host Controller | 1 | 0.6% |
| NVMe Storage Controller | 1 | 0.6% |
| Non-Volatile memory controller | 1 | 0.6% |
| NM10/ICH7 Family SATA Controller [AHCI mode] | 1 | 0.6% |
| MCP78S [GeForce 8200] SATA Controller (non-AHCI mode) | 1 | 0.6% |
| MCP78S [GeForce 8200] IDE | 1 | 0.6% |
| MCP67 IDE Controller | 1 | 0.6% |
| MCP67 AHCI Controller | 1 | 0.6% |
| JMB360 AHCI Controller | 1 | 0.6% |
| HM170/QM170 Chipset SATA Controller [AHCI Mode] | 1 | 0.6% |
| FCH SATA Controller [IDE mode] | 1 | 0.6% |
| FCH SATA Controller D | 1 | 0.6% |
| FCH IDE Controller | 1 | 0.6% |
| Celeron N3350/Pentium N4200/Atom E3900 Series SATA AHCI Controller | 1 | 0.6% |
| Cannon Lake PCH SATA AHCI Controller | 1 | 0.6% |
| Atom/Celeron/Pentium Processor x5-E8000/J3xxx/N3xxx Series SATA Controller | 1 | 0.6% |
| Atom Processor E3800 Series SATA IDE Controller | 1 | 0.6% |
| 9 Series Chipset Family SATA Controller [AHCI Mode] | 1 | 0.6% |
| 82801JD/DO (ICH10 Family) SATA AHCI Controller | 1 | 0.6% |
| 82801HR/HO/HH (ICH8R/DO/DH) 2 port SATA Controller [IDE mode] | 1 | 0.6% |
| 82801HM/HEM (ICH8M/ICH8M-E) SATA Controller [IDE mode] | 1 | 0.6% |
| 82801H (ICH8 Family) 4 port SATA Controller [IDE mode] | 1 | 0.6% |
| 82801FB/FBM/FR/FW/FRW (ICH6 Family) IDE Controller | 1 | 0.6% |
| 82801DBM (ICH4-M) IDE Controller | 1 | 0.6% |
Storage Kind
Kind of storage controller (IDE, SATA, NVMe, SAS, ...)


| Kind | Computers | Percent |
|---|---|---|
| SATA | 79 | 54.48% |
| IDE | 46 | 31.72% |
| RAID | 14 | 9.66% |
| NVMe | 6 | 4.14% |
CPU Vendor
Processor vendors


| Vendor | Computers | Percent |
|---|---|---|
| Intel | 103 | 80.47% |
| AMD | 24 | 18.75% |
| CentaurHauls | 1 | 0.78% |
CPU Model
Processor models


| Model | Computers | Percent |
|---|---|---|
| Intel Genuine CPU T2300 @ 1.66GHz | 3 | 2.34% |
| Intel Core i5-2400 CPU @ 3.10GHz | 3 | 2.34% |
| Intel Pentium Dual CPU E2180 @ 2.00GHz | 2 | 1.56% |
| Intel Core i7-8550U CPU @ 1.80GHz | 2 | 1.56% |
| Intel Core i5-7200U CPU @ 2.50GHz | 2 | 1.56% |
| Intel Core i5-2520M CPU @ 2.50GHz | 2 | 1.56% |
| Intel Core 2 Duo CPU T6500 @ 2.10GHz | 2 | 1.56% |
| Intel Core 2 CPU T5500 @ 1.66GHz | 2 | 1.56% |
| Intel Celeron N4000 CPU @ 1.10GHz | 2 | 1.56% |
| Intel Celeron CPU N3060 @ 1.60GHz | 2 | 1.56% |
| Intel Atom x5-Z8350 CPU @ 1.44GHz | 2 | 1.56% |
| Intel Atom CPU N270 @ 1.60GHz | 2 | 1.56% |
| Intel Xeon CPU E31245 @ 3.30GHz | 1 | 0.78% |
| Intel Pentium M processor 1.40GHz | 1 | 0.78% |
| Intel Pentium M processor 1.10GHz | 1 | 0.78% |
| Intel Pentium Dual-Core CPU T4400 @ 2.20GHz | 1 | 0.78% |
| Intel Pentium Dual-Core CPU E5300 @ 2.60GHz | 1 | 0.78% |
| Intel Pentium Dual CPU T2310 @ 1.46GHz | 1 | 0.78% |
| Intel Pentium D CPU 2.80GHz | 1 | 0.78% |
| Intel Pentium CPU P6200 @ 2.13GHz | 1 | 0.78% |
| Intel Pentium CPU G630 @ 2.70GHz | 1 | 0.78% |
| Intel Pentium CPU 2117U @ 1.80GHz | 1 | 0.78% |
| Intel Pentium 4 CPU 3.00GHz | 1 | 0.78% |
| Intel Genuine CPU T2060 @ 1.60GHz | 1 | 0.78% |
| Intel Genuine CPU 585 @ 2.16GHz | 1 | 0.78% |
| Intel Core m3-7Y30 CPU @ 1.00GHz | 1 | 0.78% |
| Intel Core i7-9700T CPU @ 2.00GHz | 1 | 0.78% |
| Intel Core i7-9700 CPU @ 3.00GHz | 1 | 0.78% |
| Intel Core i7-8565U CPU @ 1.80GHz | 1 | 0.78% |
| Intel Core i7-7500U CPU @ 2.70GHz | 1 | 0.78% |
| Intel Core i7-4710HQ CPU @ 2.50GHz | 1 | 0.78% |
| Intel Core i7-4610M CPU @ 3.00GHz | 1 | 0.78% |
| Intel Core i7-4600U CPU @ 2.10GHz | 1 | 0.78% |
| Intel Core i7-4510U CPU @ 2.00GHz | 1 | 0.78% |
| Intel Core i7-3630QM CPU @ 2.40GHz | 1 | 0.78% |
| Intel Core i7-3615QM CPU @ 2.30GHz | 1 | 0.78% |
| Intel Core i7-2677M CPU @ 1.80GHz | 1 | 0.78% |
| Intel Core i7 CPU M 620 @ 2.67GHz | 1 | 0.78% |
| Intel Core i5-8250U CPU @ 1.60GHz | 1 | 0.78% |
| Intel Core i5-7300HQ CPU @ 2.50GHz | 1 | 0.78% |
| Intel Core i5-5300U CPU @ 2.30GHz | 1 | 0.78% |
| Intel Core i5-4690K CPU @ 3.50GHz | 1 | 0.78% |
| Intel Core i5-4210U CPU @ 1.70GHz | 1 | 0.78% |
| Intel Core i5-4200U CPU @ 1.60GHz | 1 | 0.78% |
| Intel Core i5-10210U CPU @ 1.60GHz | 1 | 0.78% |
| Intel Core i5 CPU M 560 @ 2.67GHz | 1 | 0.78% |
| Intel Core i5 CPU M 540 @ 2.53GHz | 1 | 0.78% |
| Intel Core i5 CPU M 520 @ 2.40GHz | 1 | 0.78% |
| Intel Core i5 CPU M 480 @ 2.67GHz | 1 | 0.78% |
| Intel Core i5 CPU M 430 @ 2.27GHz | 1 | 0.78% |
| Intel Core i3-7100U CPU @ 2.40GHz | 1 | 0.78% |
| Intel Core i3-4005U CPU @ 1.70GHz | 1 | 0.78% |
| Intel Core i3-4000M CPU @ 2.40GHz | 1 | 0.78% |
| Intel Core i3-2365M CPU @ 1.40GHz | 1 | 0.78% |
| Intel Core i3-2310M CPU @ 2.10GHz | 1 | 0.78% |
| Intel Core i3-2120 CPU @ 3.30GHz | 1 | 0.78% |
| Intel Core i3-10110U CPU @ 2.10GHz | 1 | 0.78% |
| Intel Core i3 CPU M 370 @ 2.40GHz | 1 | 0.78% |
| Intel Core i3 CPU M 330 @ 2.13GHz | 1 | 0.78% |
| Intel Core 2 Quad CPU Q9650 @ 3.00GHz | 1 | 0.78% |
CPU Model Family
Processor model prefix


| Model | Computers | Percent |
|---|---|---|
| Intel Core i5 | 19 | 14.84% |
| Intel Core i7 | 14 | 10.94% |
| Intel Core 2 Duo | 14 | 10.94% |
| Intel Celeron | 11 | 8.59% |
| Intel Core i3 | 9 | 7.03% |
| Intel Atom | 8 | 6.25% |
| Intel Genuine | 5 | 3.91% |
| Intel Pentium Dual | 3 | 2.34% |
| Intel Pentium | 3 | 2.34% |
| Intel Core 2 | 3 | 2.34% |
| Intel Celeron M | 3 | 2.34% |
| Intel Pentium M | 2 | 1.56% |
| Intel Pentium Dual-Core | 2 | 1.56% |
| Intel Core 2 Quad | 2 | 1.56% |
| AMD Ryzen 5 | 2 | 1.56% |
| AMD FX | 2 | 1.56% |
| AMD E1 | 2 | 1.56% |
| AMD Athlon | 2 | 1.56% |
| AMD A6 | 2 | 1.56% |
| Intel Xeon | 1 | 0.78% |
| Intel Pentium D | 1 | 0.78% |
| Intel Pentium 4 | 1 | 0.78% |
| Intel Core m3 | 1 | 0.78% |
| Intel Celeron Dual-Core | 1 | 0.78% |
| CentaurHauls VIA C7 | 1 | 0.78% |
| AMD Sempron | 1 | 0.78% |
| AMD Ryzen Threadripper | 1 | 0.78% |
| AMD Ryzen 3 | 1 | 0.78% |
| AMD Quad-Core | 1 | 0.78% |
| AMD Phenom II X4 | 1 | 0.78% |
| AMD Phenom II | 1 | 0.78% |
| AMD Phenom | 1 | 0.78% |
| AMD Mobile Sempron | 1 | 0.78% |
| AMD E | 1 | 0.78% |
| AMD Athlon II X4 | 1 | 0.78% |
| AMD Athlon II X2 | 1 | 0.78% |
| AMD Athlon II Dual-Core | 1 | 0.78% |
| AMD A4 | 1 | 0.78% |
| AMD A10 | 1 | 0.78% |
CPU Cores
Number of processor cores


| Number | Computers | Percent |
|---|---|---|
| 2 | 78 | 60.94% |
| 4 | 29 | 22.66% |
| 1 | 16 | 12.5% |
| 8 | 2 | 1.56% |
| 16 | 1 | 0.78% |
| 6 | 1 | 0.78% |
| 3 | 1 | 0.78% |
CPU Sockets
Number of sockets


| Number | Computers | Percent |
|---|---|---|
| 1 | 128 | 100% |
CPU Threads
Threads per core (Hyper-Threading)


| Number | Computers | Percent |
|---|---|---|
| 1 | 77 | 60.16% |
| 2 | 51 | 39.84% |
CPU Op-Modes
CPU Operation Modes (32-bit, 64-bit)


| Op mode | Computers | Percent |
|---|---|---|
| 32-bit, 64-bit | 116 | 90.63% |
| 32-bit | 12 | 9.38% |
CPU Microarch
Microarchitecture


| Name | Computers | Percent |
|---|---|---|
| Core | 27 | 21.09% |
| Skylake | 13 | 10.16% |
| SandyBridge | 11 | 8.59% |
| Silvermont | 10 | 7.81% |
| Haswell | 10 | 7.81% |
| Westmere | 9 | 7.03% |
| P6 | 9 | 7.03% |
| K10 | 6 | 4.69% |
| Piledriver | 5 | 3.91% |
| Bonnell | 4 | 3.13% |
| Jaguar | 3 | 2.34% |
| IvyBridge | 3 | 2.34% |
| Zen+ | 2 | 1.56% |
| Zen | 2 | 1.56% |
| NetBurst | 2 | 1.56% |
| K8 Hammer | 2 | 1.56% |
| Goldmont plus | 2 | 1.56% |
| Bobcat | 2 | 1.56% |
| KabyLake | 1 | 0.78% |
| K8 & K10 hybrid | 1 | 0.78% |
| Goldmont | 1 | 0.78% |
| Excavator | 1 | 0.78% |
| Broadwell | 1 | 0.78% |
| Unknown | 1 | 0.78% |
CPU Microcode
Microcode number


| Number | Computers | Percent |
|---|---|---|
| 0x206a7 | 11 | 8.59% |
| 0x1067a | 10 | 7.81% |
| Unknown | 9 | 7.03% |
| 0x6fd | 7 | 5.47% |
| 0x40651 | 6 | 4.69% |
| 0x806e9 | 4 | 3.13% |
| 0x6e8 | 4 | 3.13% |
| 0x406c4 | 4 | 3.13% |
| 0x306c3 | 4 | 3.13% |
| 0x20655 | 4 | 3.13% |
| 0x20652 | 4 | 3.13% |
| 0x806ec | 3 | 2.34% |
| 0x806ea | 3 | 2.34% |
| 0x6f6 | 3 | 2.34% |
| 0x306a9 | 3 | 2.34% |
| 0x30673 | 3 | 2.34% |
| 0x10676 | 3 | 2.34% |
| 0x0700010f | 3 | 2.34% |
| 0x06001119 | 3 | 2.34% |
| 0x906ed | 2 | 1.56% |
| 0x706a1 | 2 | 1.56% |
| 0x6fb | 2 | 1.56% |
| 0x6fa | 2 | 1.56% |
| 0x6d8 | 2 | 1.56% |
| 0x6d6 | 2 | 1.56% |
| 0x30678 | 2 | 1.56% |
| 0x106c2 | 2 | 1.56% |
| 0x0810100b | 2 | 1.56% |
| 0x06000852 | 2 | 1.56% |
| 0x05000119 | 2 | 1.56% |
| 0x010000c8 | 2 | 1.56% |
| 0xf49 | 1 | 0.78% |
| 0xf47 | 1 | 0.78% |
| 0x906e9 | 1 | 0.78% |
| 0x6ec | 1 | 0.78% |
| 0x506c9 | 1 | 0.78% |
| 0x306d4 | 1 | 0.78% |
| 0x30661 | 1 | 0.78% |
| 0x106ca | 1 | 0.78% |
| 0x0800820b | 1 | 0.78% |
| 0x06006704 | 1 | 0.78% |
| 0x02000057 | 1 | 0.78% |
| 0x010000db | 1 | 0.78% |
| 0x01000083 | 1 | 0.78% |
GPU Vendor
Vendors of graphics cards


| Vendor | Computers | Percent |
|---|---|---|
| Intel | 71 | 51.45% |
| AMD | 35 | 25.36% |
| Nvidia | 28 | 20.29% |
| VIA Technologies | 3 | 2.17% |
| Silicon Integrated Systems [SiS] | 1 | 0.72% |
GPU Model
Graphics card models


| Model | Computers | Percent |
|---|---|---|
| Mobile 945GM/GMS/GME, 943/940GML Express Integrated Graphics Controller | 10 | 6.45% |
| Mobile 945GM/GMS, 943/940GML Express Integrated Graphics Controller | 8 | 5.16% |
| Haswell-ULT Integrated Graphics Controller | 6 | 3.87% |
| Atom Processor Z36xxx/Z37xxx Series Graphics & Display | 6 | 3.87% |
| 2nd Generation Core Processor Family Integrated Graphics Controller | 6 | 3.87% |
| Mobile 4 Series Chipset Integrated Graphics Controller | 5 | 3.23% |
| HD Graphics 620 | 4 | 2.58% |
| Atom/Celeron/Pentium Processor x5-E8000/J3xxx/N3xxx Integrated Graphics Controller | 4 | 2.58% |
| UHD Graphics 620 | 3 | 1.94% |
| RV710/M92 [Mobility Radeon HD 4530/4570/545v] | 3 | 1.94% |
| GT218M [NVS 3100M] | 3 | 1.94% |
| 4th Gen Core Processor Integrated Graphics Controller | 3 | 1.94% |
| 3rd Gen Core processor Graphics Controller | 3 | 1.94% |
| UHD Graphics 605 | 2 | 1.29% |
| UHD Graphics | 2 | 1.29% |
| Raven Ridge [Radeon Vega Series / Radeon Vega Mobile Series] | 2 | 1.29% |
| Park [Mobility Radeon HD 5430/5450/5470] | 2 | 1.29% |
| Mobile GM965/GL960 Integrated Graphics Controller (secondary) | 2 | 1.29% |
| Mobile GM965/GL960 Integrated Graphics Controller (primary) | 2 | 1.29% |
| Mobile 945GSE Express Integrated Graphics Controller | 2 | 1.29% |
| Core Processor Integrated Graphics Controller | 2 | 1.29% |
| CN700/P4M800 Pro/P4M800 CE/VN800 Graphics [S3 UniChrome Pro] | 2 | 1.29% |
| Cedar [Radeon HD 5000/6000/7350/8350 Series] | 2 | 1.29% |
| Baffin [Radeon RX 460/560D / Pro 450/455/460/555/555X/560/560X] | 2 | 1.29% |
| Wrestler [Radeon HD 7310] | 1 | 0.65% |
| Wrestler [Radeon HD 6320] | 1 | 0.65% |
| Vega 20 [Radeon VII] | 1 | 0.65% |
| UHD Graphics 630 (Desktop 9 Series) | 1 | 0.65% |
| UHD Graphics 620 (Whiskey Lake) | 1 | 0.65% |
| TU116 [GeForce GTX 1660 Ti] | 1 | 0.65% |
| Trinity 2 [Radeon HD 7520G] | 1 | 0.65% |
| Trinity 2 [Radeon HD 7480D] | 1 | 0.65% |
| Topaz XT [Radeon R7 M260/M265 / M340/M360 / M440/M445 / 530/535 / 620/625 Mobile] | 1 | 0.65% |
| Temash [Radeon HD 8250/8280G] | 1 | 0.65% |
| Sun XT [Radeon HD 8670A/8670M/8690M / R5 M330 / M430 / Radeon 520 Mobile] | 1 | 0.65% |
| Stoney [Radeon R2/R3/R4/R5 Graphics] | 1 | 0.65% |
| RV710 [Radeon HD 4350/4550] | 1 | 0.65% |
| RV630/M76 [Mobility Radeon HD 2600] | 1 | 0.65% |
| RV620 LE [Radeon HD 3450] | 1 | 0.65% |
| RV610 [Radeon HD 2400 PRO] | 1 | 0.65% |
| RV380 [Radeon X300/X550/X1050 Series] (Secondary) | 1 | 0.65% |
| RV370 [Radeon X600/X600 SE] | 1 | 0.65% |
| RS880M [Mobility Radeon HD 4225/4250] | 1 | 0.65% |
| RS780C [Radeon 3100] | 1 | 0.65% |
| RS690 [Radeon X1200] | 1 | 0.65% |
| Richland [Radeon HD 8610G] | 1 | 0.65% |
| Redwood XT GL [FirePro V4800] | 1 | 0.65% |
| Mobile GME965/GLE960 Integrated Graphics Controller | 1 | 0.65% |
| Mobile 915GM/GMS/910GML Express Graphics Controller | 1 | 0.65% |
| Madison [Mobility Radeon HD 5650/5750 / 6530M/6550M] | 1 | 0.65% |
| Kabini [Radeon HD 8400 / R3 Series] | 1 | 0.65% |
| Kabini [Radeon HD 8210] | 1 | 0.65% |
| Juniper PRO [Radeon HD 5750] | 1 | 0.65% |
| HD Graphics 630 | 1 | 0.65% |
| HD Graphics 615 | 1 | 0.65% |
| HD Graphics 5500 | 1 | 0.65% |
| HD Graphics 500 | 1 | 0.65% |
| GT218 [NVS 300] | 1 | 0.65% |
| GT218 [GeForce 8400 GS Rev. 3] | 1 | 0.65% |
| GT216M [GeForce GT 320M] | 1 | 0.65% |
GPU Combo
Combinations of graphics cards


| Name | Computers | Percent |
|---|---|---|
| 1 x Intel | 61 | 47.66% |
| 1 x AMD | 27 | 21.09% |
| 1 x Nvidia | 21 | 16.41% |
| Intel + Nvidia | 7 | 5.47% |
| 2 x AMD | 5 | 3.91% |
| 1 x VIA | 3 | 2.34% |
| Intel + AMD | 2 | 1.56% |
| Other | 1 | 0.78% |
| 1 x SiS | 1 | 0.78% |
GPU Driver
Free vs proprietary


| Driver | Computers | Percent |
|---|---|---|
| Free | 106 | 82.81% |
| Proprietary | 11 | 8.59% |
| Unknown | 11 | 8.59% |
GPU Memory
Total video memory


| Size in GB | Computers | Percent |
|---|---|---|
| Unknown | 73 | 57.03% |
| 0.01-0.5 | 31 | 24.22% |
| 0.51-1.0 | 13 | 10.16% |
| 3.01-4.0 | 5 | 3.91% |
| 1.01-2.0 | 5 | 3.91% |
| 5.01-6.0 | 1 | 0.78% |
Monitor Vendor
Monitor vendors


| Vendor | Computers | Percent |
|---|---|---|
| Samsung Electronics | 24 | 20% |
| AU Optronics | 21 | 17.5% |
| LG Display | 12 | 10% |
| Chimei Innolux | 8 | 6.67% |
| Chi Mei Optoelectronics | 8 | 6.67% |
| BOE | 7 | 5.83% |
| Hewlett-Packard | 5 | 4.17% |
| Goldstar | 4 | 3.33% |
| Apple | 3 | 2.5% |
| ViewSonic | 2 | 1.67% |
| Unknown | 2 | 1.67% |
| Toshiba | 2 | 1.67% |
| Nvidia | 2 | 1.67% |
| Lenovo | 2 | 1.67% |
| InfoVision | 2 | 1.67% |
| Dell | 2 | 1.67% |
| BenQ | 2 | 1.67% |
| ___ | 1 | 0.83% |
| Vita | 1 | 0.83% |
| Videoseven | 1 | 0.83% |
| Sony | 1 | 0.83% |
| Quanta Display | 1 | 0.83% |
| Philips | 1 | 0.83% |
| MStar | 1 | 0.83% |
| LG Philips | 1 | 0.83% |
| HannStar | 1 | 0.83% |
| CHR | 1 | 0.83% |
| AOC | 1 | 0.83% |
| Acer | 1 | 0.83% |
Monitor Model
Monitor models


| Model | Computers | Percent |
|---|---|---|
| LCD Monitor AUO38ED 1920x1080 340x190mm 15.3-inch | 4 | 3.33% |
| LCD Monitor SEC3633 1280x800 331x207mm 15.4-inch | 3 | 2.5% |
| LCD Monitor LGD033A 1366x768 340x190mm 15.3-inch | 2 | 1.67% |
| LCD Monitor CMO1526 1280x800 331x207mm 15.4-inch | 2 | 1.67% |
| LCD Monitor CMN15DB 1366x768 344x193mm 15.5-inch | 2 | 1.67% |
| LCD Monitor AUO20EC 1366x768 344x193mm 15.5-inch | 2 | 1.67% |
| W2043 GSM4E9D 1600x900 443x249mm 20.0-inch | 1 | 0.83% |
| VX2255wm-2 VSC9B1F 1680x1050 474x296mm 22.0-inch | 1 | 0.83% |
| VT988 VIT03DC 1280x1024 376x301mm 19.0-inch | 1 | 0.83% |
| VG2021wm-2 VSCD91E 1680x1050 433x270mm 20.1-inch | 1 | 0.83% |
| TV_MONITOR MST0030 1440x900 1150x650mm 52.0-inch | 1 | 0.83% |
| SyncMaster SAM0598 1360x768 410x230mm 18.5-inch | 1 | 0.83% |
| SyncMaster SAM0564 1024x768 410x230mm 18.5-inch | 1 | 0.83% |
| SyncMaster SAM0486 1920x1080 | 1 | 0.83% |
| SyncMaster SAM0322 1440x900 428x255mm 19.6-inch | 1 | 0.83% |
| SyncMaster SAM0304 1680x1050 494x320mm 23.2-inch | 1 | 0.83% |
| SyncMaster SAM0088 1024x768 304x228mm 15.0-inch | 1 | 0.83% |
| SA300/SA350 SAM078F 1920x1080 477x268mm 21.5-inch | 1 | 0.83% |
| S27D360 SAM0B27 1920x1080 598x336mm 27.0-inch | 1 | 0.83% |
| S24D391 SAM0B87 1920x1080 521x293mm 23.5-inch | 1 | 0.83% |
| S2440L DELA08B 1920x1080 530x300mm 24.0-inch | 1 | 0.83% |
| PHL 436M6VBP PHLC179 3840x2160 941x529mm 42.5-inch | 1 | 0.83% |
| P2012H DEL4079 1600x900 443x249mm 20.0-inch | 1 | 0.83% |
| Nvidia Defaul SNY05FA 1366x768 290x170mm 13.2-inch | 1 | 0.83% |
| Monitor ranges (GTF): 48-62Hz V, 14-68kHz H, max dotclock 150MHz ___9000 1440x900 | 1 | 0.83% |
| M227WAP GSM579C 1920x1080 476x268mm 21.5-inch | 1 | 0.83% |
| M140NWR2 R1 IVO057A 1366x768 309x174mm 14.0-inch | 1 | 0.83% |
| LP2065 HWP0A72 1600x1200 408x306mm 20.1-inch | 1 | 0.83% |
| LP156WH2-TLBA LGD026C 1366x768 344x194mm 15.5-inch | 1 | 0.83% |
| LEN L171 LEN240B 1280x1024 337x270mm 17.0-inch | 1 | 0.83% |
| LCDTV16 9000 1360x768 1600x900mm 72.3-inch | 1 | 0.83% |
| LCD Monitor SMB2230 1920x1080 | 1 | 0.83% |
| LCD Monitor SEC5442 1440x900 367x230mm 17.1-inch | 1 | 0.83% |
| LCD Monitor SEC4E45 1280x800 331x207mm 15.4-inch | 1 | 0.83% |
| LCD Monitor SEC3845 1280x800 331x207mm 15.4-inch | 1 | 0.83% |
| LCD Monitor SEC3651 1366x768 344x194mm 15.5-inch | 1 | 0.83% |
| LCD Monitor SEC354C 1366x768 353x198mm 15.9-inch | 1 | 0.83% |
| LCD Monitor SEC3451 1366x768 344x194mm 15.5-inch | 1 | 0.83% |
| LCD Monitor SEC3245 1366x768 344x194mm 15.5-inch | 1 | 0.83% |
| LCD Monitor SEC3150 1366x768 344x193mm 15.5-inch | 1 | 0.83% |
| LCD Monitor SDC544B 1600x900 309x174mm 14.0-inch | 1 | 0.83% |
| LCD Monitor SAM04FA 1920x1080 886x498mm 40.0-inch | 1 | 0.83% |
| LCD Monitor QDS0015 1024x768 285x214mm 14.0-inch | 1 | 0.83% |
| LCD Monitor LPLA002 1440x900 367x230mm 17.1-inch | 1 | 0.83% |
| LCD Monitor LGDD801 1366x768 344x194mm 15.5-inch | 1 | 0.83% |
| LCD Monitor LGD0ABC 1280x800 304x190mm 14.1-inch | 1 | 0.83% |
| LCD Monitor LGD05D8 1920x1080 344x194mm 15.5-inch | 1 | 0.83% |
| LCD Monitor LGD0590 1920x1080 344x194mm 15.5-inch | 1 | 0.83% |
| LCD Monitor LGD046F 1920x1080 344x194mm 15.5-inch | 1 | 0.83% |
| LCD Monitor LGD0465 1366x768 344x194mm 15.5-inch | 1 | 0.83% |
| LCD Monitor LGD045E 1366x768 309x174mm 14.0-inch | 1 | 0.83% |
| LCD Monitor LGD0430 1366x768 345x194mm 15.6-inch | 1 | 0.83% |
| LCD Monitor LGD03DF 1366x768 344x194mm 15.5-inch | 1 | 0.83% |
| LCD Monitor LEN4000 1024x768 246x185mm 12.1-inch | 1 | 0.83% |
| LCD Monitor LCD5800 1280x800 264x159mm 12.1-inch | 1 | 0.83% |
| LCD Monitor LCD3707 1280x800 287x180mm 13.3-inch | 1 | 0.83% |
| LCD Monitor KA270H 1920x1080 | 1 | 0.83% |
| LCD Monitor IVO0489 1366x768 260x140mm 11.6-inch | 1 | 0.83% |
| LCD Monitor HSD03E9 1024x600 220x129mm 10.0-inch | 1 | 0.83% |
| LCD Monitor GW2765 2560x1440 | 1 | 0.83% |
Monitor Resolution
Monitor screen resolution


| Resolution | Computers | Percent |
|---|---|---|
| 1366x768 (WXGA) | 40 | 34.48% |
| 1920x1080 (FHD) | 27 | 23.28% |
| 1280x800 (WXGA) | 10 | 8.62% |
| 1600x900 (HD+) | 7 | 6.03% |
| 1280x1024 (SXGA) | 6 | 5.17% |
| 1440x900 (WXGA+) | 5 | 4.31% |
| 1680x1050 (WSXGA+) | 4 | 3.45% |
| 1360x768 | 4 | 3.45% |
| 1024x768 (XGA) | 3 | 2.59% |
| 1024x600 | 3 | 2.59% |
| 1280x768 | 2 | 1.72% |
| 3840x2160 (4K) | 1 | 0.86% |
| 2880x1800 | 1 | 0.86% |
| 2560x1440 (QHD) | 1 | 0.86% |
| 1920x1200 (WUXGA) | 1 | 0.86% |
| 1600x1200 | 1 | 0.86% |
Monitor Diagonal
Diagonal size in inches


| Inches | Computers | Percent |
|---|---|---|
| 15 | 41 | 34.45% |
| 13 | 13 | 10.92% |
| 14 | 11 | 9.24% |
| 17 | 8 | 6.72% |
| Unknown | 8 | 6.72% |
| 23 | 6 | 5.04% |
| 20 | 6 | 5.04% |
| 11 | 5 | 4.2% |
| 19 | 3 | 2.52% |
| 18 | 3 | 2.52% |
| 10 | 3 | 2.52% |
| 24 | 2 | 1.68% |
| 21 | 2 | 1.68% |
| 12 | 2 | 1.68% |
| 72 | 1 | 0.84% |
| 42 | 1 | 0.84% |
| 40 | 1 | 0.84% |
| 32 | 1 | 0.84% |
| 27 | 1 | 0.84% |
| 22 | 1 | 0.84% |
Monitor Width
Physical width


| Width in mm | Computers | Percent |
|---|---|---|
| 301-350 | 61 | 51.26% |
| 201-300 | 16 | 13.45% |
| 401-500 | 13 | 10.92% |
| 351-400 | 9 | 7.56% |
| 501-600 | 8 | 6.72% |
| Unknown | 8 | 6.72% |
| 801-900 | 1 | 0.84% |
| 701-800 | 1 | 0.84% |
| 1501-2000 | 1 | 0.84% |
| 901-1000 | 1 | 0.84% |
Aspect Ratio
Proportional relationship between the width and the height


| Ratio | Computers | Percent |
|---|---|---|
| 16/9 | 76 | 68.47% |
| 16/10 | 18 | 16.22% |
| 5/4 | 6 | 5.41% |
| Unknown | 6 | 5.41% |
| 4/3 | 4 | 3.6% |
| 3/2 | 1 | 0.9% |
Monitor Area
Area in inch²


| Area in inch² | Computers | Percent |
|---|---|---|
| 101-110 | 41 | 34.75% |
| 81-90 | 19 | 16.1% |
| 151-200 | 12 | 10.17% |
| 201-250 | 8 | 6.78% |
| Unknown | 8 | 6.78% |
| 51-60 | 5 | 4.24% |
| 141-150 | 5 | 4.24% |
| 71-80 | 4 | 3.39% |
| 121-130 | 4 | 3.39% |
| 41-50 | 3 | 2.54% |
| 61-70 | 2 | 1.69% |
| 501-1000 | 2 | 1.69% |
| More than 1000 | 1 | 0.85% |
| 351-500 | 1 | 0.85% |
| 301-350 | 1 | 0.85% |
| 131-140 | 1 | 0.85% |
| 91-100 | 1 | 0.85% |
Pixel Density
Pixels per inch


| Density | Computers | Percent |
|---|---|---|
| 101-120 | 47 | 40.87% |
| 51-100 | 35 | 30.43% |
| 121-160 | 22 | 19.13% |
| Unknown | 8 | 6.96% |
| 161-240 | 2 | 1.74% |
| 1-50 | 1 | 0.87% |
Multiple Monitors
Total monitors connected


| Total | Computers | Percent |
|---|---|---|
| 1 | 108 | 84.38% |
| 0 | 10 | 7.81% |
| 2 | 8 | 6.25% |
| 3 | 2 | 1.56% |
Net Controller Vendor
Controller vendors


| Vendor | Computers | Percent |
|---|---|---|
| Intel | 22 | 56.41% |
| VIA Technologies | 3 | 7.69% |
| Nvidia | 3 | 7.69% |
| Realtek Semiconductor | 2 | 5.13% |
| ZTE WCDMA Technologies MSM | 1 | 2.56% |
| Sony Ericsson Mobile Communications AB | 1 | 2.56% |
| Samsung Electronics | 1 | 2.56% |
| DisplayLink | 1 | 2.56% |
| D-Link | 1 | 2.56% |
| Broadcom Limited | 1 | 2.56% |
| Broadcom Inc. and subsidiaries | 1 | 2.56% |
| Broadcom | 1 | 2.56% |
| Apple | 1 | 2.56% |
Net Controller Model
Controller models


| Model | Computers | Percent |
|---|---|---|
| 82579LM Gigabit Network Connection (Lewisville) | 5 | 11.11% |
| VT6102/VT6103 [Rhine-II] | 3 | 6.67% |
| MCP61 Ethernet | 3 | 6.67% |
| BCM4401-B0 100Base-TX | 3 | 6.67% |
| 82577LM Gigabit Network Connection | 3 | 6.67% |
| PRO/100 VE Network Connection | 2 | 4.44% |
| Centrino Ultimate-N 6300 | 2 | 4.44% |
| Centrino Advanced-N 6205 [Taylor Peak] | 2 | 4.44% |
| AC'97 Modem Controller | 2 | 4.44% |
| 82567LM-3 Gigabit Network Connection | 2 | 4.44% |
| RTL8152 Fast Ethernet Adapter | 1 | 2.22% |
| NM10/ICH7 Family LAN Controller | 1 | 2.22% |
| iPad 4/Mini1 | 1 | 2.22% |
| I211 Gigabit Network Connection | 1 | 2.22% |
| GT-I9070 (network tethering, USB debugging enabled) | 1 | 2.22% |
| DWA-140 RangeBooster N Adapter(rev.B3) [Ralink RT5372] | 1 | 2.22% |
| Dell USB 3.0 Dock | 1 | 2.22% |
| D6503 | 1 | 2.22% |
| Centrino Advanced-N 6235 | 1 | 2.22% |
| Android | 1 | 2.22% |
| 82801FB/FBM/FR/FW/FRW (ICH6 Family) AC'97 Modem Controller | 1 | 2.22% |
| 82801DB/DBL/DBM (ICH4/ICH4-L/ICH4-M) AC'97 Modem Controller | 1 | 2.22% |
| 82579V Gigabit Network Connection | 1 | 2.22% |
| 82577LC Gigabit Network Connection | 1 | 2.22% |
| 82567LM Gigabit Network Connection | 1 | 2.22% |
| 82562V-2 10/100 Network Connection | 1 | 2.22% |
| 82562GT 10/100 Network Connection | 1 | 2.22% |
| 802.11ac NIC | 1 | 2.22% |
Net Controller Kind
Ethernet, WiFi or modem


| Kind | Computers | Percent |
|---|---|---|
| Ethernet | 31 | 72.09% |
| WiFi | 6 | 13.95% |
| Modem | 5 | 11.63% |
| Unknown | 1 | 2.33% |
Used Controller
Currently used network controller


| Kind | Computers | Percent |
|---|---|---|
| Ethernet | 16 | 76.19% |
| WiFi | 5 | 23.81% |
NICs
Total network controllers on board


| Total | Computers | Percent |
|---|---|---|
| 2 | 85 | 66.41% |
| 1 | 38 | 29.69% |
| 0 | 4 | 3.13% |
| 3 | 1 | 0.78% |
Unsupported Devices
Total unsupported devices on board


| Total | Computers | Percent |
|---|---|---|
| 0 | 87 | 67.97% |
| 1 | 38 | 29.69% |
| 2 | 3 | 2.34% |
Unsupported Device Types
Types of unsupported devices


| Type | Computers | Percent |
|---|---|---|
| Graphics card | 14 | 33.33% |
| Net/wireless | 7 | 16.67% |
| Chipcard | 7 | 16.67% |
| Fingerprint reader | 6 | 14.29% |
| Modem | 2 | 4.76% |
| Communication controller | 2 | 4.76% |
| Net/ethernet | 1 | 2.38% |
| Multimedia controller | 1 | 2.38% |
| Flash memory | 1 | 2.38% |
| Bluetooth | 1 | 2.38% |