Arch Hardware Trends
A project to identify most popular hardware characteristics and track their change over time based on data collected by Arch users at https://Linux-Hardware.org.
Anyone can contribute to the study by uploading probes of their computers by the hw-probe tool:
sudo hw-probe -all -uploadThis is a report for all computer types. See also reports for desktops and notebooks.
Full-feature report is available here: https://linux-hardware.org/?view=trends
Period: Apr, 2020.
Contents
- OS
- OS Family
- Kernel
- Kernel Family
- Kernel Major Ver.
- Arch
- DE
- Display Server
- Display Manager
- OS Lang
- Boot Mode
- Filesystem
- Dual Boot with Linux/BSD
- Dual Boot (Win)
- Country
- City
- Vendor
- Model
- Model Family
- MFG Year
- Form Factor
- Secure Boot
- Coreboot
- RAM Size
- RAM Used
- Drive Vendor
- Drive Model
- Drive Kind
- Drive Connector
- Drive Size
- Space Total
- Space Used
- Malfunc. Drives
- Malfunc. Drive Vendor
- Malfunc. Drive Kind
- Failed Drives
- Failed Drive Vendor
- Drive Status
- Storage Vendor
- Storage Model
- Storage Kind
- CPU Vendor
- CPU Model
- CPU Model Family
- CPU Cores
- CPU Sockets
- CPU Threads
- CPU Op-Modes
- CPU Microarch
- CPU Microcode
- GPU Vendor
- GPU Model
- GPU Combo
- GPU Driver
- GPU Memory
- Monitor Vendor
- Monitor Model
- Monitor Resolution
- Monitor Diagonal
- Monitor Width
- Aspect Ratio
- Monitor Area
- Pixel Density
- Multiple Monitors
- Net Controller Vendor
- Net Controller Model
- Net Controller Kind
- Used Controller
- NICs
- Unsupported Devices
- Unsupported Device Types
OS
Installed operating systems


| Name | Computers | Percent |
|---|---|---|
| Arch | 92 | 71.88% |
| Arch Rolling | 36 | 28.13% |
OS Family
OS without a version


| Name | Computers | Percent |
|---|---|---|
| Arch | 128 | 100% |
Kernel
Version of the Linux kernel


| Version | Computers | Percent |
|---|---|---|
| 5.6.4-arch1-1 | 24 | 18.75% |
| 5.6.3-arch1-1 | 16 | 12.5% |
| 5.6.6-arch1-1 | 15 | 11.72% |
| 5.5.13-arch2-1 | 15 | 11.72% |
| 5.6.7-arch1-1 | 12 | 9.38% |
| 5.6.5-arch3-1 | 7 | 5.47% |
| 5.4.28-2-lts | 5 | 3.91% |
| 5.6.2-arch1-2 | 4 | 3.13% |
| 5.6.7-zen1-1-zen | 3 | 2.34% |
| 5.6.3-zen1-1-zen | 3 | 2.34% |
| 5.4.31-1-lts | 3 | 2.34% |
| 5.5.7-arch1-1 | 2 | 1.56% |
| 5.4.32-1-lts | 2 | 1.56% |
| 5.6.8-arch1-1 | 1 | 0.78% |
| 5.6.4-arch1-1-vfio | 1 | 0.78% |
| 5.6.2-5-tkg-pds | 1 | 0.78% |
| 5.5.9-arch1-2 | 1 | 0.78% |
| 5.5.19-1-ck-zen2 | 1 | 0.78% |
| 5.5.18-1-ck-zen2 | 1 | 0.78% |
| 5.5.15-1-ck | 1 | 0.78% |
| 5.5.13.ll53-1-lingruby-ll | 1 | 0.78% |
| 5.5.13-zen2-1-zen | 1 | 0.78% |
| 5.5.11-arch1-1 | 1 | 0.78% |
| 5.4.34-1-lts | 1 | 0.78% |
| 5.4.33-3-lts | 1 | 0.78% |
| 5.4.30-1-lts | 1 | 0.78% |
| 5.4.28-1-lts | 1 | 0.78% |
| 5.4.27-1-lts | 1 | 0.78% |
| 5.4.14-arch1-1 | 1 | 0.78% |
| 4.8.13-1-ARCH | 1 | 0.78% |
Kernel Family
Linux kernel without a distro release


| Version | Computers | Percent |
|---|---|---|
| 5.6.4 | 25 | 19.53% |
| 5.6.3 | 19 | 14.84% |
| 5.5.13 | 17 | 13.28% |
| 5.6.7 | 15 | 11.72% |
| 5.6.6 | 15 | 11.72% |
| 5.6.5 | 7 | 5.47% |
| 5.4.28 | 6 | 4.69% |
| 5.6.2 | 5 | 3.91% |
| 5.4.31 | 3 | 2.34% |
| 5.5.7 | 2 | 1.56% |
| 5.4.32 | 2 | 1.56% |
| 5.6.8 | 1 | 0.78% |
| 5.5.9 | 1 | 0.78% |
| 5.5.19 | 1 | 0.78% |
| 5.5.18 | 1 | 0.78% |
| 5.5.15 | 1 | 0.78% |
| 5.5.11 | 1 | 0.78% |
| 5.4.34 | 1 | 0.78% |
| 5.4.33 | 1 | 0.78% |
| 5.4.30 | 1 | 0.78% |
| 5.4.27 | 1 | 0.78% |
| 5.4.14 | 1 | 0.78% |
| 4.8.13 | 1 | 0.78% |
Kernel Major Ver.
Linux kernel major version


| Version | Computers | Percent |
|---|---|---|
| 5.6 | 87 | 67.97% |
| 5.5 | 24 | 18.75% |
| 5.4 | 16 | 12.5% |
| 4.8 | 1 | 0.78% |
Arch
OS architecture (x86_64, i586, etc.)


| Name | Computers | Percent |
|---|---|---|
| x86_64 | 128 | 100% |
DE
Desktop Environment


| Name | Computers | Percent |
|---|---|---|
| GNOME | 67 | 52.34% |
| KDE5 | 14 | 10.94% |
| KDE | 14 | 10.94% |
| XFCE | 10 | 7.81% |
| Unknown | 6 | 4.69% |
| Deepin | 4 | 3.13% |
| X-Cinnamon | 3 | 2.34% |
| Cinnamon | 3 | 2.34% |
| Budgie | 3 | 2.34% |
| i3 | 2 | 1.56% |
| LXDE | 1 | 0.78% |
| GNOME Classic | 1 | 0.78% |
Display Server
X11 or Wayland


| Name | Computers | Percent |
|---|---|---|
| X11 | 86 | 67.19% |
| Wayland | 35 | 27.34% |
| Tty | 6 | 4.69% |
| Unknown | 1 | 0.78% |
Display Manager
SDDM, LightDM, etc.


| Name | Computers | Percent |
|---|---|---|
| Unknown | 78 | 60.94% |
| LightDM | 21 | 16.41% |
| SDDM | 14 | 10.94% |
| GDM | 12 | 9.38% |
| XDM | 1 | 0.78% |
| SLiM | 1 | 0.78% |
| KDM | 1 | 0.78% |
OS Lang
Language


| Lang | Computers | Percent |
|---|---|---|
| en_US | 55 | 42.97% |
| de_DE | 11 | 8.59% |
| pt_BR | 7 | 5.47% |
| en_GB | 7 | 5.47% |
| ru_RU | 6 | 4.69% |
| C | 5 | 3.91% |
| pl_PL | 4 | 3.13% |
| fr_FR | 4 | 3.13% |
| en_AU | 3 | 2.34% |
| Unknown | 3 | 2.34% |
| es_MX | 2 | 1.56% |
| es_ES | 2 | 1.56% |
| en_US.utf8 | 2 | 1.56% |
| sv_SE | 1 | 0.78% |
| ru_RU.utf8 | 1 | 0.78% |
| ro_RO | 1 | 0.78% |
| pl_PL.utf8 | 1 | 0.78% |
| nb_NO | 1 | 0.78% |
| lv_LV | 1 | 0.78% |
| it_IT | 1 | 0.78% |
| hu_HU | 1 | 0.78% |
| fr_CH | 1 | 0.78% |
| fr_CA | 1 | 0.78% |
| es_CO | 1 | 0.78% |
| en_NL | 1 | 0.78% |
| en_GB.utf8 | 1 | 0.78% |
| en_DK | 1 | 0.78% |
| en_CA.utf8 | 1 | 0.78% |
| en_CA | 1 | 0.78% |
| de_AT | 1 | 0.78% |
Boot Mode
EFI or BIOS


| Mode | Computers | Percent |
|---|---|---|
| EFI | 70 | 54.69% |
| BIOS | 58 | 45.31% |
Filesystem
Type of filesystem


| Type | Computers | Percent |
|---|---|---|
| Ext4 | 108 | 84.38% |
| Btrfs | 10 | 7.81% |
| Xfs | 5 | 3.91% |
| F2fs | 2 | 1.56% |
| Zfs | 1 | 0.78% |
| Ext3 | 1 | 0.78% |
| Unknown | 1 | 0.78% |
Dual Boot with Linux/BSD
Hosting more than one Linux/BSD


| Dual boot | Computers | Percent |
|---|---|---|
| No | 112 | 87.5% |
| Yes | 16 | 12.5% |
Dual Boot (Win)
Hosting Linux and Windows


| Dual boot | Computers | Percent |
|---|---|---|
| No | 103 | 80.47% |
| Yes | 25 | 19.53% |
Country
Geographic location (country)


| Country | Computers | Percent |
|---|---|---|
| USA | 24 | 18.75% |
| Germany | 13 | 10.16% |
| Russia | 10 | 7.81% |
| Canada | 9 | 7.03% |
| UK | 8 | 6.25% |
| Brazil | 7 | 5.47% |
| Spain | 5 | 3.91% |
| Poland | 5 | 3.91% |
| France | 5 | 3.91% |
| Australia | 4 | 3.13% |
| Switzerland | 3 | 2.34% |
| Netherlands | 3 | 2.34% |
| Italy | 3 | 2.34% |
| Austria | 3 | 2.34% |
| Qatar | 2 | 1.56% |
| Mexico | 2 | 1.56% |
| Colombia | 2 | 1.56% |
| Belgium | 2 | 1.56% |
| Turkey | 1 | 0.78% |
| Thailand | 1 | 0.78% |
| Taiwan | 1 | 0.78% |
| Sweden | 1 | 0.78% |
| Sri Lanka | 1 | 0.78% |
| South Africa | 1 | 0.78% |
| Romania | 1 | 0.78% |
| Norway | 1 | 0.78% |
| Latvia | 1 | 0.78% |
| Kazakhstan | 1 | 0.78% |
| Indonesia | 1 | 0.78% |
| India | 1 | 0.78% |
| Hungary | 1 | 0.78% |
| Hong Kong | 1 | 0.78% |
| Greece | 1 | 0.78% |
| Egypt | 1 | 0.78% |
| Cyprus | 1 | 0.78% |
| Bulgaria | 1 | 0.78% |
City
Geographic location (city)


| City | Computers | Percent |
|---|---|---|
| Barcelona | 3 | 2.34% |
| Waren | 2 | 1.56% |
| Tallahassee | 2 | 1.56% |
| St Petersburg | 2 | 1.56% |
| Sanford | 2 | 1.56% |
| Penrith | 2 | 1.56% |
| Munich | 2 | 1.56% |
| Moscow | 2 | 1.56% |
| Montreal | 2 | 1.56% |
| Juiz de Fora | 2 | 1.56% |
| Hanover | 2 | 1.56% |
| Durham | 2 | 1.56% |
| Doha | 2 | 1.56% |
| Bogotá | 2 | 1.56% |
| Austin | 2 | 1.56% |
| Zoetermeer | 1 | 0.78% |
| Zell unter Aichelberg | 1 | 0.78% |
| Yukon | 1 | 0.78% |
| Yoshkar-Ola | 1 | 0.78% |
| Wrocław | 1 | 0.78% |
| Werdohl | 1 | 0.78% |
| Warsaw | 1 | 0.78% |
| Waiblingen | 1 | 0.78% |
| Vladivostok | 1 | 0.78% |
| Villefranche-de-Rouergue | 1 | 0.78% |
| Villars | 1 | 0.78% |
| Vienna | 1 | 0.78% |
| Victoria | 1 | 0.78% |
| Uppsala | 1 | 0.78% |
| Tsuen Wan | 1 | 0.78% |
| Topeka | 1 | 0.78% |
| Taipei | 1 | 0.78% |
| São Paulo | 1 | 0.78% |
| Sydney | 1 | 0.78% |
| Sofiemyr | 1 | 0.78% |
| Sibiu | 1 | 0.78% |
| Sherbrooke | 1 | 0.78% |
| Schweinfurt | 1 | 0.78% |
| Sao Jose | 1 | 0.78% |
| Santa Monica | 1 | 0.78% |
| Rotherhithe | 1 | 0.78% |
| Regina | 1 | 0.78% |
| Reggio Calabria | 1 | 0.78% |
| Pune | 1 | 0.78% |
| Puerto del Rosario | 1 | 0.78% |
| Poznan | 1 | 0.78% |
| Portola Valley | 1 | 0.78% |
| Plouharnel | 1 | 0.78% |
| Parndorf | 1 | 0.78% |
| Pahrump | 1 | 0.78% |
| Orenburg | 1 | 0.78% |
| Novosibirsk | 1 | 0.78% |
| Nieuwendijk | 1 | 0.78% |
| New Bedford | 1 | 0.78% |
| Montes Claros | 1 | 0.78% |
| Mira | 1 | 0.78% |
| Mexicali | 1 | 0.78% |
| Merksem | 1 | 0.78% |
| Mercier | 1 | 0.78% |
| March | 1 | 0.78% |
Vendor
Motherboard manufacturer


| Name | Computers | Percent |
|---|---|---|
| ASUSTek Computer | 22 | 17.19% |
| Lenovo | 21 | 16.41% |
| Dell | 18 | 14.06% |
| Hewlett-Packard | 13 | 10.16% |
| MSI | 12 | 9.38% |
| Gigabyte Technology | 9 | 7.03% |
| Acer | 9 | 7.03% |
| ASRock | 5 | 3.91% |
| Sony | 3 | 2.34% |
| Notebook | 3 | 2.34% |
| Intel | 3 | 2.34% |
| Samsung Electronics | 2 | 1.56% |
| Apple | 2 | 1.56% |
| Unknown | 2 | 1.56% |
| Microsoft | 1 | 0.78% |
| Mediacom | 1 | 0.78% |
| ECS | 1 | 0.78% |
| Biostar | 1 | 0.78% |
Model
Motherboard model


| Name | Computers | Percent |
|---|---|---|
| MSI MS-7C37 | 2 | 1.56% |
| MSI MS-7B86 | 2 | 1.56% |
| Lenovo 1S7033H45MJDMVVK | 2 | 1.56% |
| HP ProBook 6470b | 2 | 1.56% |
| Dell Studio 1558 | 2 | 1.56% |
| ASUS PRIME A320M-K | 2 | 1.56% |
| ASUS Maximus VIII RANGER | 2 | 1.56% |
| Acer Aspire E5-571 | 2 | 1.56% |
| Unknown | 2 | 1.56% |
| Sony VPCEJ2Z1E | 1 | 0.78% |
| Sony VGN-CR590E | 1 | 0.78% |
| Sony SVP13215CDB | 1 | 0.78% |
| Samsung Electronics RF511/RF411/RF711 | 1 | 0.78% |
| Samsung Electronics 530U4E/540U4E | 1 | 0.78% |
| Notebook W65_67SZ | 1 | 0.78% |
| Notebook W54_55_94_95_97AU,AUQ | 1 | 0.78% |
| Notebook P65_P67RGRERA | 1 | 0.78% |
| MSI MS-7B79 | 1 | 0.78% |
| MSI MS-7B49 | 1 | 0.78% |
| MSI MS-7B25 | 1 | 0.78% |
| MSI MS-7B17 | 1 | 0.78% |
| MSI MS-7A64 | 1 | 0.78% |
| MSI MS-7693 | 1 | 0.78% |
| MSI GX720 | 1 | 0.78% |
| MSI GE70 2PE | 1 | 0.78% |
| Microsoft Surface Book | 1 | 0.78% |
| Mediacom SmartBook 14 FullHD - SB14UC | 1 | 0.78% |
| Lenovo Z50-70 20354 | 1 | 0.78% |
| Lenovo ThinkPad X390 Yoga 20NNCTO1WW | 1 | 0.78% |
| Lenovo ThinkPad X260 20F5S5MQ00 | 1 | 0.78% |
| Lenovo ThinkPad X230 232578G | 1 | 0.78% |
| Lenovo ThinkPad X1 Carbon 2nd 20A8S0ET00 | 1 | 0.78% |
| Lenovo ThinkPad T490 20N2000BRT | 1 | 0.78% |
| Lenovo ThinkPad T430 2349PT4 | 1 | 0.78% |
| Lenovo ThinkPad T420 4236A72 | 1 | 0.78% |
| Lenovo ThinkPad S1 Yoga 12 20DK001XMZ | 1 | 0.78% |
| Lenovo ThinkPad P53 20QNCTO1WW | 1 | 0.78% |
| Lenovo ThinkPad E480 20KN005CBM | 1 | 0.78% |
| Lenovo ThinkPad E470 20H2S00700 | 1 | 0.78% |
| Lenovo Legion Y540-15IRH-PG0 81SY | 1 | 0.78% |
| Lenovo IdeaPad Z575 12992PU | 1 | 0.78% |
| Lenovo IdeaPad Y510P 20217 | 1 | 0.78% |
| Lenovo IdeaPad FLEX 6-14ARR 81HA | 1 | 0.78% |
| Lenovo IdeaPad 330-15ARR 81D2 | 1 | 0.78% |
| Lenovo G700 20251 | 1 | 0.78% |
| Lenovo Flex 3-1480 | 1 | 0.78% |
| Intel NUC6CAYB J23203-402 | 1 | 0.78% |
| Intel DX79SR AAG57199-200 | 1 | 0.78% |
| Intel D54250WYK H13922-304 | 1 | 0.78% |
| HP Z400 Workstation | 1 | 0.78% |
| HP Stream Laptop 14-cb0XX | 1 | 0.78% |
| HP Pro x2 612 G2 | 1 | 0.78% |
| HP Pavilion Notebook | 1 | 0.78% |
| HP Pavilion Gaming Laptop 15-dk0xxx | 1 | 0.78% |
| HP Pavilion Gaming Laptop 15-cx0xxx | 1 | 0.78% |
| HP Mini 110-3100 | 1 | 0.78% |
| HP ENVY Laptop 13-aq0xxx | 1 | 0.78% |
| HP EliteBook 840 G6 | 1 | 0.78% |
| HP EliteBook 830 G6 | 1 | 0.78% |
| HP 250 G6 Notebook PC | 1 | 0.78% |
Model Family
Motherboard model prefix


| Name | Computers | Percent |
|---|---|---|
| Lenovo ThinkPad | 11 | 8.59% |
| Acer Aspire | 8 | 6.25% |
| Lenovo IdeaPad | 4 | 3.13% |
| Dell Inspiron | 4 | 3.13% |
| ASUS ROG | 4 | 3.13% |
| HP Pavilion | 3 | 2.34% |
| Dell XPS | 3 | 2.34% |
| Dell Precision | 3 | 2.34% |
| Dell Latitude | 3 | 2.34% |
| ASUS PRIME | 3 | 2.34% |
| MSI MS-7C37 | 2 | 1.56% |
| MSI MS-7B86 | 2 | 1.56% |
| Lenovo 1S7033H45MJDMVVK | 2 | 1.56% |
| HP ProBook | 2 | 1.56% |
| HP EliteBook | 2 | 1.56% |
| Gigabyte AX370-Gaming | 2 | 1.56% |
| Dell Studio | 2 | 1.56% |
| ASUS TUF | 2 | 1.56% |
| ASUS P8Z77-V | 2 | 1.56% |
| ASUS Maximus | 2 | 1.56% |
| ASRock X570 | 2 | 1.56% |
| Unknown | 2 | 1.56% |
| Sony VPCEJ2Z1E | 1 | 0.78% |
| Sony VGN-CR590E | 1 | 0.78% |
| Sony SVP13215CDB | 1 | 0.78% |
| Samsung Electronics RF511 | 1 | 0.78% |
| Samsung Electronics 530U4E | 1 | 0.78% |
| Notebook W65 | 1 | 0.78% |
| Notebook W54 | 1 | 0.78% |
| Notebook P65 | 1 | 0.78% |
| MSI MS-7B79 | 1 | 0.78% |
| MSI MS-7B49 | 1 | 0.78% |
| MSI MS-7B25 | 1 | 0.78% |
| MSI MS-7B17 | 1 | 0.78% |
| MSI MS-7A64 | 1 | 0.78% |
| MSI MS-7693 | 1 | 0.78% |
| MSI GX720 | 1 | 0.78% |
| MSI GE70 | 1 | 0.78% |
| Microsoft Surface | 1 | 0.78% |
| Mediacom SmartBook | 1 | 0.78% |
| Lenovo Z50-70 | 1 | 0.78% |
| Lenovo Legion | 1 | 0.78% |
| Lenovo G700 | 1 | 0.78% |
| Lenovo Flex | 1 | 0.78% |
| Intel NUC6CAYB | 1 | 0.78% |
| Intel DX79SR | 1 | 0.78% |
| Intel D54250WYK | 1 | 0.78% |
| HP Z400 | 1 | 0.78% |
| HP Stream | 1 | 0.78% |
| HP Pro | 1 | 0.78% |
| HP Mini | 1 | 0.78% |
| HP ENVY | 1 | 0.78% |
| HP 250 | 1 | 0.78% |
| Gigabyte Z87X-UD3H | 1 | 0.78% |
| Gigabyte Z77X-UD5H | 1 | 0.78% |
| Gigabyte X470 | 1 | 0.78% |
| Gigabyte H110M-S2V | 1 | 0.78% |
| Gigabyte B250-HD3 | 1 | 0.78% |
| Gigabyte AB350-Gaming | 1 | 0.78% |
| Gigabyte 970A-UD3P | 1 | 0.78% |
MFG Year
Motherboard manufacture year


| Year | Computers | Percent |
|---|---|---|
| 2019 | 39 | 30.47% |
| 2018 | 16 | 12.5% |
| 2014 | 13 | 10.16% |
| 2017 | 11 | 8.59% |
| 2013 | 9 | 7.03% |
| 2016 | 7 | 5.47% |
| 2015 | 7 | 5.47% |
| 2020 | 6 | 4.69% |
| 2012 | 6 | 4.69% |
| 2011 | 4 | 3.13% |
| 2010 | 3 | 2.34% |
| 2008 | 3 | 2.34% |
| 2009 | 2 | 1.56% |
| 2007 | 2 | 1.56% |
Form Factor
Physical design of the computer


| Name | Computers | Percent |
|---|---|---|
| Notebook | 69 | 53.91% |
| Desktop | 54 | 42.19% |
| Tablet | 2 | 1.56% |
| Convertible | 2 | 1.56% |
| Mini pc | 1 | 0.78% |
Secure Boot
Enabled or disabled


| State | Computers | Percent |
|---|---|---|
| Disabled | 128 | 100% |
Coreboot
Have coreboot on board


| Used | Computers | Percent |
|---|---|---|
| No | 128 | 100% |
RAM Size
Total RAM memory


| Size in GB | Computers | Percent |
|---|---|---|
| 16.01-24.0 | 39 | 30.47% |
| 8.01-16.0 | 33 | 25.78% |
| 4.01-8.0 | 25 | 19.53% |
| 3.01-4.0 | 11 | 8.59% |
| 32.01-64.0 | 10 | 7.81% |
| 64.01-256.0 | 5 | 3.91% |
| 1.01-2.0 | 3 | 2.34% |
| 24.01-32.0 | 2 | 1.56% |
RAM Used
Used RAM memory


| Used GB | Computers | Percent |
|---|---|---|
| 1.01-2.0 | 44 | 34.38% |
| 2.01-3.0 | 29 | 22.66% |
| 3.01-4.0 | 27 | 21.09% |
| 4.01-8.0 | 19 | 14.84% |
| 8.01-16.0 | 5 | 3.91% |
| 0.01-1.0 | 4 | 3.13% |
Drive Vendor
Hard drive vendors


| Vendor | Computers | Drives | Percent |
|---|---|---|---|
| Seagate | 42 | 49 | 19.91% |
| Samsung Electronics | 31 | 38 | 14.69% |
| WDC | 30 | 37 | 14.22% |
| Toshiba | 12 | 13 | 5.69% |
| SanDisk | 11 | 15 | 5.21% |
| Crucial | 11 | 11 | 5.21% |
| Unknown | 10 | 10 | 4.74% |
| Kingston | 10 | 10 | 4.74% |
| A-DATA Technology | 8 | 8 | 3.79% |
| Intel | 6 | 6 | 2.84% |
| HGST | 6 | 6 | 2.84% |
| SK Hynix | 4 | 4 | 1.9% |
| Corsair | 4 | 4 | 1.9% |
| Hitachi | 3 | 3 | 1.42% |
| DREVO | 3 | 3 | 1.42% |
| China | 3 | 3 | 1.42% |
| HL-DT-ST | 2 | Unknown | 0.95% |
| ASMT | 2 | 2 | 0.95% |
| Silicon Motion | 1 | 1 | 0.47% |
| S3U3 | 1 | 1 | 0.47% |
| Phison | 1 | 1 | 0.47% |
| Patriot | 1 | 1 | 0.47% |
| OCZ | 1 | 1 | 0.47% |
| Mushkin | 1 | 1 | 0.47% |
| MARVELL | 1 | 1 | 0.47% |
| LITEON | 1 | 1 | 0.47% |
| INDMEM | 1 | 1 | 0.47% |
| GOODRAM | 1 | 1 | 0.47% |
| Gigabyte Technology | 1 | 1 | 0.47% |
| Generic- | 1 | 1 | 0.47% |
| Fujitsu | 1 | 1 | 0.47% |
Drive Model
Hard drive models


| Model | Computers | Percent |
|---|---|---|
| ST1000LM024 HN-M101MBB 1TB | 4 | 1.7% |
| X1 SSD 120GB | 3 | 1.28% |
| SV300S37A120G 120GB SSD | 3 | 1.28% |
| ST500LT012-1DG142 500GB | 3 | 1.28% |
| ST2000LM015-2E8174 2TB | 3 | 1.28% |
| ST2000DM006-2DM164 2TB | 3 | 1.28% |
| ST1000LM048-2E7172 1TB | 3 | 1.28% |
| ST1000LM035-1RK172 1TB | 3 | 1.28% |
| SH00R480GB SSD | 3 | 1.28% |
| SA400S37120G 120GB SSD | 3 | 1.28% |
| MMC Card 32GB | 3 | 1.28% |
| HTS721010A9E630 1TB | 3 | 1.28% |
| WD5000AAKX-001CA0 500GB | 2 | 0.85% |
| WD40EZRZ-00GXCB0 4TB | 2 | 0.85% |
| WD3200AAKS-75L9A0 320GB | 2 | 0.85% |
| WD20EURX-57T0FY0 2TB | 2 | 0.85% |
| ST750LX003-1AC154 752GB | 2 | 0.85% |
| ST500DM005 HD502HJ 500GB | 2 | 0.85% |
| SSD 970 EVO Plus 500GB | 2 | 0.85% |
| SSD 970 EVO 250GB | 2 | 0.85% |
| SSD 850 EVO 250GB | 2 | 0.85% |
| SSD 850 EVO 1TB | 2 | 0.85% |
| SSD 850 EVO 120GB | 2 | 0.85% |
| SDSSDA240G 240GB | 2 | 0.85% |
| SA400S37240G 240GB SSD | 2 | 0.85% |
| MZ7TY256HDHP-000L7 256GB SSD | 2 | 0.85% |
| MQ01ABD100 1TB | 2 | 0.85% |
| HDWE160 6TB | 2 | 0.85% |
| DVDRAM GUC0N 1GB | 2 | 0.85% |
| CT500MX500SSD1 500GB | 2 | 0.85% |
| CT1000MX500SSD1 1TB | 2 | 0.85% |
| WDS500G2B0B-00YS70 500GB SSD | 1 | 0.43% |
| WDS480G2G0B-00EPW0 480GB SSD | 1 | 0.43% |
| WDS240G2G0A-00JH30 240GB SSD | 1 | 0.43% |
| WDS200T3X0C-00SJG0 2TB | 1 | 0.43% |
| WDBNCE2500PNC-WRSN 250GB SSD | 1 | 0.43% |
| WD8000AARS-00Y5B1 800GB | 1 | 0.43% |
| WD7500BPVX-22JC3T0 752GB | 1 | 0.43% |
| WD7500BPKX-00HPJT0 752GB | 1 | 0.43% |
| WD50EFRX-68MYMN1 5TB | 1 | 0.43% |
| WD5000BPVT-24HXZT3 500GB | 1 | 0.43% |
| WD5000BEKT-00KA9T0 500GB | 1 | 0.43% |
| WD5000AAKS-75V0A0 500GB | 1 | 0.43% |
| WD5000AAKS-00YGA0 500GB | 1 | 0.43% |
| WD30EZRX-00D8PB0 3TB | 1 | 0.43% |
| WD20NPVT-00Z2TT0 2TB | 1 | 0.43% |
| WD20EZRZ-00Z5HB0 2TB | 1 | 0.43% |
| WD20EARX-008FB0 2TB | 1 | 0.43% |
| WD1600JS-08MHB0 160GB | 1 | 0.43% |
| WD10SPZX-21Z10T0 1TB | 1 | 0.43% |
| WD10JPVX-22JC3T0 1TB | 1 | 0.43% |
| WD10EZRX-00A8LB0 1TB | 1 | 0.43% |
| WD10EZEX-08WN4A0 1TB | 1 | 0.43% |
| WD10EZEX-00WN4A0 1TB | 1 | 0.43% |
| WD10EZEX-00BN5A0 1TB | 1 | 0.43% |
| WD10EARX-22N0YB0 1TB | 1 | 0.43% |
| WD1003FZEX-00K3CA0 1TB | 1 | 0.43% |
| WD1001FAES-75W7A0 1TB | 1 | 0.43% |
| VERTEX3 240GB SSD | 1 | 0.43% |
| Ultra II 480GB SSD | 1 | 0.43% |
Drive Kind
HDD or SSD


| Kind | Computers | Drives | Percent |
|---|---|---|---|
| HDD | 73 | 104 | 41.71% |
| SSD | 68 | 96 | 38.86% |
| NVMe | 23 | 26 | 13.14% |
| MMC | 9 | 9 | 5.14% |
| Unknown | 2 | Unknown | 1.14% |
Drive Connector
SATA, SAS, NVMe, etc.


| Type | Computers | Drives | Percent |
|---|---|---|---|
| SATA | 107 | 197 | 74.83% |
| NVMe | 23 | 26 | 16.08% |
| MMC | 9 | 9 | 6.29% |
| SAS | 4 | 3 | 2.8% |
Drive Size
Size of hard drive


| Size in TB | Computers | Drives | Percent |
|---|---|---|---|
| 0.01-0.5 | 95 | 140 | 54.29% |
| 0.51-1.0 | 49 | 59 | 28% |
| 1.01-2.0 | 20 | 23 | 11.43% |
| 3.01-4.0 | 6 | 7 | 3.43% |
| 4.01-10.0 | 3 | 3 | 1.71% |
| 2.01-3.0 | 2 | 3 | 1.14% |
Space Total
Amount of disk space available on the file system


| Size in GB | Computers | Percent |
|---|---|---|
| 101-250 | 45 | 35.16% |
| 251-500 | 23 | 17.97% |
| 501-1000 | 23 | 17.97% |
| 1001-2000 | 15 | 11.72% |
| More than 3000 | 8 | 6.25% |
| 2001-3000 | 7 | 5.47% |
| 21-50 | 5 | 3.91% |
| 51-100 | 1 | 0.78% |
| Unknown | 1 | 0.78% |
Space Used
Amount of used disk space


| Used GB | Computers | Percent |
|---|---|---|
| 1-20 | 27 | 21.09% |
| 21-50 | 24 | 18.75% |
| 51-100 | 20 | 15.63% |
| 101-250 | 15 | 11.72% |
| 501-1000 | 15 | 11.72% |
| 1001-2000 | 12 | 9.38% |
| 251-500 | 10 | 7.81% |
| More than 3000 | 2 | 1.56% |
| 2001-3000 | 2 | 1.56% |
| Unknown | 1 | 0.78% |
Malfunc. Drives
Drive models with a malfunction


| Model | Computers | Drives | Percent |
|---|---|---|---|
| X1 SSD 120GB | 3 | 3 | 17.65% |
| SV300S37A120G 120GB SSD | 1 | 1 | 5.88% |
| SU635 480GB SSD | 1 | 1 | 5.88% |
| ST9250315AS 250GB | 1 | 1 | 5.88% |
| ST3640323AS 640GB | 1 | 1 | 5.88% |
| ST3500312CS 500GB | 1 | 1 | 5.88% |
| ST3160318AS 160GB | 1 | 1 | 5.88% |
| ST2000LX001-1RG174 2TB | 1 | 1 | 5.88% |
| SSDSA2M080G2GC 80GB | 1 | 1 | 5.88% |
| SH103S3240G 240GB SSD | 1 | 1 | 5.88% |
| SD7SB3Q128G1001 128GB SSD | 1 | 1 | 5.88% |
| MK3276GSX 320GB | 1 | 1 | 5.88% |
| HFS128G39TND-N210A 128GB SSD | 1 | 1 | 5.88% |
| Force GT 240GB SSD | 1 | 1 | 5.88% |
| Force 3 SSD 120GB | 1 | 1 | 5.88% |
Malfunc. Drive Vendor
Vendors of faulty drives


| Vendor | Computers | Drives | Percent |
|---|---|---|---|
| Seagate | 5 | 5 | 29.41% |
| DREVO | 3 | 3 | 17.65% |
| Kingston | 2 | 2 | 11.76% |
| Corsair | 2 | 2 | 11.76% |
| Toshiba | 1 | 1 | 5.88% |
| SK Hynix | 1 | 1 | 5.88% |
| SanDisk | 1 | 1 | 5.88% |
| Intel | 1 | 1 | 5.88% |
| A-DATA Technology | 1 | 1 | 5.88% |
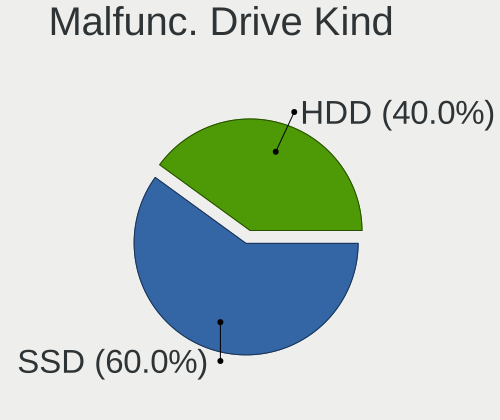
Malfunc. Drive Kind
Kinds of faulty drives

| Kind | Computers | Drives | Percent |
|---|---|---|---|
| SSD | 9 | 11 | 60% |
| HDD | 6 | 6 | 40% |
Failed Drives
Failed drive models
Zero info for selected period =(
Failed Drive Vendor
Failed drive vendors
Zero info for selected period =(
Drive Status
Number of failed and malfunc. drives


| Status | Computers | Drives | Percent |
|---|---|---|---|
| Detected | 72 | 130 | 54.14% |
| Works | 46 | 88 | 34.59% |
| Malfunc | 15 | 17 | 11.28% |
Storage Vendor
Storage controller vendors


| Vendor | Computers | Percent |
|---|---|---|
| Intel | 91 | 53.53% |
| AMD | 26 | 15.29% |
| Samsung Electronics | 17 | 10% |
| ASMedia Technology | 6 | 3.53% |
| Marvell Technology Group | 5 | 2.94% |
| Toshiba America Info Systems | 4 | 2.35% |
| Sandisk | 4 | 2.35% |
| Phison Electronics | 3 | 1.76% |
| SK Hynix | 2 | 1.18% |
| Silicon Motion | 2 | 1.18% |
| Nvidia | 2 | 1.18% |
| JMicron Technology | 2 | 1.18% |
| ADATA Technology | 2 | 1.18% |
| Micron/Crucial Technology | 1 | 0.59% |
| Micron Technology | 1 | 0.59% |
| Kingston Technology Company | 1 | 0.59% |
| Adaptec | 1 | 0.59% |
Storage Model
Storage controller models


| Model | Computers | Percent |
|---|---|---|
| FCH SATA Controller [AHCI mode] | 20 | 10.42% |
| NVMe SSD Controller SM981/PM981/PM983 | 13 | 6.77% |
| Sunrise Point-LP SATA Controller [AHCI mode] | 9 | 4.69% |
| 7 Series Chipset Family 6-port SATA Controller [AHCI mode] | 9 | 4.69% |
| 8 Series SATA Controller 1 [AHCI mode] | 8 | 4.17% |
| Wildcat Point-LP SATA Controller [AHCI Mode] | 6 | 3.13% |
| Non-Volatile memory controller | 6 | 3.13% |
| Cannon Lake Mobile PCH SATA AHCI Controller | 6 | 3.13% |
| 400 Series Chipset SATA Controller | 6 | 3.13% |
| SB7x0/SB8x0/SB9x0 SATA Controller [AHCI mode] | 5 | 2.6% |
| Q170/Q150/B150/H170/H110/Z170/CM236 Chipset SATA Controller [AHCI Mode] | 5 | 2.6% |
| ASM1062 Serial ATA Controller | 5 | 2.6% |
| 8 Series/C220 Series Chipset Family 6-port SATA Controller 1 [AHCI mode] | 5 | 2.6% |
| 200 Series PCH SATA controller [AHCI mode] | 5 | 2.6% |
| 7 Series/C210 Series Chipset Family 6-port SATA Controller [AHCI mode] | 4 | 2.08% |
| WD Black 2018/PC SN720 NVMe SSD | 3 | 1.56% |
| SSD 660P Series | 3 | 1.56% |
| NVMe SSD Controller SM961/PM961 | 3 | 1.56% |
| Cannon Lake PCH SATA AHCI Controller | 3 | 1.56% |
| 82801JI (ICH10 Family) SATA AHCI Controller | 3 | 1.56% |
| 82801 Mobile SATA Controller [RAID mode] | 3 | 1.56% |
| 6 Series/C200 Series Chipset Family 6 port Mobile SATA AHCI Controller | 3 | 1.56% |
| XPG SX8200 Pro PCIe Gen3x4 M.2 2280 Solid State Drive | 2 | 1.04% |
| X370 Series Chipset SATA Controller | 2 | 1.04% |
| SSD Pro 7600p/760p/E 6100p Series | 2 | 1.04% |
| NVMe SSD Controller SM951/PM951 | 2 | 1.04% |
| MCP61 SATA Controller | 2 | 1.04% |
| MCP61 IDE | 2 | 1.04% |
| HM170/QM170 Chipset SATA Controller [AHCI Mode] | 2 | 1.04% |
| FCH SATA Controller D | 2 | 1.04% |
| E12 NVMe Controller | 2 | 1.04% |
| Celeron N3350/Pentium N4200/Atom E3900 Series SATA AHCI Controller | 2 | 1.04% |
| 88SE9172 SATA 6Gb/s Controller | 2 | 1.04% |
| 6 Series/C200 Series Chipset Family 6 port Desktop SATA AHCI Controller | 2 | 1.04% |
| 5 Series/3400 Series Chipset 4 port SATA AHCI Controller | 2 | 1.04% |
| 300 Series Chipset SATA Controller | 2 | 1.04% |
| XG4 NVMe SSD Controller | 1 | 0.52% |
| Toshiba America Info Non-Volatile memory controller | 1 | 0.52% |
| SB7x0/SB8x0/SB9x0 SATA Controller [IDE mode] | 1 | 0.52% |
| SB7x0/SB8x0/SB9x0 IDE Controller | 1 | 0.52% |
| SATA Controller [RAID mode] | 1 | 0.52% |
| PC300 NVMe Solid State Drive 512GB | 1 | 0.52% |
| P1 NVMe PCIe SSD | 1 | 0.52% |
| NVMe Storage Controller | 1 | 0.52% |
| NVMe Controller | 1 | 0.52% |
| NM10/ICH7 Family SATA Controller [IDE mode] | 1 | 0.52% |
| NM10/ICH7 Family SATA Controller [AHCI mode] | 1 | 0.52% |
| JMB368 IDE controller | 1 | 0.52% |
| JMB363 SATA/IDE Controller | 1 | 0.52% |
| C610/X99 series chipset sSATA Controller [AHCI mode] | 1 | 0.52% |
| C610/X99 series chipset 6-Port SATA Controller [AHCI mode] | 1 | 0.52% |
| C600/X79 series chipset 4-Port SATA IDE Controller | 1 | 0.52% |
| C600/X79 series chipset 2-Port SATA IDE Controller | 1 | 0.52% |
| BG3 NVMe SSD Controller | 1 | 0.52% |
| ASM1061 SATA IDE Controller | 1 | 0.52% |
| AAC-RAID | 1 | 0.52% |
| 88SE9230 PCIe SATA 6Gb/s Controller | 1 | 0.52% |
| 88SE9128 PCIe SATA 6 Gb/s RAID controller with HyperDuo | 1 | 0.52% |
| 88SE6111/6121 SATA II / PATA Controller | 1 | 0.52% |
| 82801JI (ICH10 Family) 4 port SATA IDE Controller #1 | 1 | 0.52% |
Storage Kind
Kind of storage controller (IDE, SATA, NVMe, SAS, ...)


| Kind | Computers | Percent |
|---|---|---|
| SATA | 105 | 66.04% |
| NVMe | 38 | 23.9% |
| IDE | 11 | 6.92% |
| RAID | 5 | 3.14% |
CPU Vendor
Processor vendors


| Vendor | Computers | Percent |
|---|---|---|
| Intel | 99 | 77.34% |
| AMD | 29 | 22.66% |
CPU Model
Processor models


| Model | Computers | Percent |
|---|---|---|
| Intel Core i5-5200U CPU @ 2.20GHz | 5 | 3.91% |
| AMD Ryzen 3 2200G with Radeon Vega Graphics | 4 | 3.13% |
| Intel Core i7-9750H CPU @ 2.60GHz | 3 | 2.34% |
| Intel Core i7-8750H CPU @ 2.20GHz | 2 | 1.56% |
| Intel Core i7-8700K CPU @ 3.70GHz | 2 | 1.56% |
| Intel Core i7-8565U CPU @ 1.80GHz | 2 | 1.56% |
| Intel Core i7-8550U CPU @ 1.80GHz | 2 | 1.56% |
| Intel Core i7-6700K CPU @ 4.00GHz | 2 | 1.56% |
| Intel Core i7-3770K CPU @ 3.50GHz | 2 | 1.56% |
| Intel Core i7-3520M CPU @ 2.90GHz | 2 | 1.56% |
| Intel Core i5-9600K CPU @ 3.70GHz | 2 | 1.56% |
| Intel Core i5-8265U CPU @ 1.60GHz | 2 | 1.56% |
| Intel Core i5-8250U CPU @ 1.60GHz | 2 | 1.56% |
| Intel Core i5-6300U CPU @ 2.40GHz | 2 | 1.56% |
| Intel Core i5-3320M CPU @ 2.60GHz | 2 | 1.56% |
| Intel Core i5-3230M CPU @ 2.60GHz | 2 | 1.56% |
| Intel Core i5-2400 CPU @ 3.10GHz | 2 | 1.56% |
| Intel Core i3-4005U CPU @ 1.70GHz | 2 | 1.56% |
| AMD Ryzen 9 3950X 16-Core Processor | 2 | 1.56% |
| AMD Ryzen 7 3700X 8-Core Processor | 2 | 1.56% |
| AMD Ryzen 7 2700X Eight-Core Processor | 2 | 1.56% |
| AMD Ryzen 3 2200U with Radeon Vega Mobile Gfx | 2 | 1.56% |
| AMD FX-8350 Eight-Core Processor | 2 | 1.56% |
| AMD FX-6300 Six-Core Processor | 2 | 1.56% |
| Intel Xeon E-2286M CPU @ 2.40GHz | 1 | 0.78% |
| Intel Xeon CPU X5690 @ 3.47GHz | 1 | 0.78% |
| Intel Xeon CPU W3565 @ 3.20GHz | 1 | 0.78% |
| Intel Xeon CPU W3550 @ 3.07GHz | 1 | 0.78% |
| Intel Xeon CPU E3-1505M v5 @ 2.80GHz | 1 | 0.78% |
| Intel Pentium Dual CPU E2140 @ 1.60GHz | 1 | 0.78% |
| Intel Pentium CPU B970 @ 2.30GHz | 1 | 0.78% |
| Intel Pentium 3556U @ 1.70GHz | 1 | 0.78% |
| Intel Core i9-9880H CPU @ 2.30GHz | 1 | 0.78% |
| Intel Core i7-8665U CPU @ 1.90GHz | 1 | 0.78% |
| Intel Core i7-8650U CPU @ 1.90GHz | 1 | 0.78% |
| Intel Core i7-7700K CPU @ 4.20GHz | 1 | 0.78% |
| Intel Core i7-7700HQ CPU @ 2.80GHz | 1 | 0.78% |
| Intel Core i7-7500U CPU @ 2.70GHz | 1 | 0.78% |
| Intel Core i7-6700HQ CPU @ 2.60GHz | 1 | 0.78% |
| Intel Core i7-6700 CPU @ 3.40GHz | 1 | 0.78% |
| Intel Core i7-6500U CPU @ 2.50GHz | 1 | 0.78% |
| Intel Core i7-5820K CPU @ 3.30GHz | 1 | 0.78% |
| Intel Core i7-5500U CPU @ 2.40GHz | 1 | 0.78% |
| Intel Core i7-4770 CPU @ 3.40GHz | 1 | 0.78% |
| Intel Core i7-4712MQ CPU @ 2.30GHz | 1 | 0.78% |
| Intel Core i7-4702MQ CPU @ 2.20GHz | 1 | 0.78% |
| Intel Core i7-4700MQ CPU @ 2.40GHz | 1 | 0.78% |
| Intel Core i7-4700HQ CPU @ 2.40GHz | 1 | 0.78% |
| Intel Core i7-4600U CPU @ 2.10GHz | 1 | 0.78% |
| Intel Core i7-4510U CPU @ 2.00GHz | 1 | 0.78% |
| Intel Core i7-3820 CPU @ 3.60GHz | 1 | 0.78% |
| Intel Core i7-3770S CPU @ 3.10GHz | 1 | 0.78% |
| Intel Core i7-2640M CPU @ 2.80GHz | 1 | 0.78% |
| Intel Core i7 CPU Q 720 @ 1.60GHz | 1 | 0.78% |
| Intel Core i5-8400 CPU @ 2.80GHz | 1 | 0.78% |
| Intel Core i5-8300H CPU @ 2.30GHz | 1 | 0.78% |
| Intel Core i5-7Y54 CPU @ 1.20GHz | 1 | 0.78% |
| Intel Core i5-7600K CPU @ 3.80GHz | 1 | 0.78% |
| Intel Core i5-7400 CPU @ 3.00GHz | 1 | 0.78% |
| Intel Core i5-7200U CPU @ 2.50GHz | 1 | 0.78% |
CPU Model Family
Processor model prefix


| Model | Computers | Percent |
|---|---|---|
| Intel Core i7 | 38 | 29.69% |
| Intel Core i5 | 36 | 28.13% |
| AMD Ryzen 7 | 7 | 5.47% |
| AMD Ryzen 3 | 7 | 5.47% |
| Intel Xeon | 5 | 3.91% |
| Intel Celeron | 5 | 3.91% |
| Intel Core i3 | 4 | 3.13% |
| AMD FX | 4 | 3.13% |
| Intel Core 2 Quad | 3 | 2.34% |
| AMD Ryzen 9 | 3 | 2.34% |
| AMD Ryzen 5 | 3 | 2.34% |
| Intel Pentium | 2 | 1.56% |
| Intel Core 2 Duo | 2 | 1.56% |
| Intel Atom | 2 | 1.56% |
| Intel Pentium Dual | 1 | 0.78% |
| Intel Core i9 | 1 | 0.78% |
| AMD Phenom II X4 | 1 | 0.78% |
| AMD Phenom II | 1 | 0.78% |
| AMD Phenom | 1 | 0.78% |
| AMD Athlon 64 X2 | 1 | 0.78% |
| AMD A6 | 1 | 0.78% |
CPU Cores
Number of processor cores


| Number | Computers | Percent |
|---|---|---|
| 4 | 51 | 39.84% |
| 2 | 47 | 36.72% |
| 6 | 15 | 11.72% |
| 8 | 9 | 7.03% |
| 16 | 2 | 1.56% |
| 3 | 2 | 1.56% |
| 12 | 1 | 0.78% |
| 1 | 1 | 0.78% |
CPU Sockets
Number of sockets


| Number | Computers | Percent |
|---|---|---|
| 1 | 128 | 100% |
CPU Threads
Threads per core (Hyper-Threading)


| Number | Computers | Percent |
|---|---|---|
| 2 | 93 | 72.66% |
| 1 | 35 | 27.34% |
CPU Op-Modes
CPU Operation Modes (32-bit, 64-bit)


| Op mode | Computers | Percent |
|---|---|---|
| 32-bit, 64-bit | 128 | 100% |
CPU Microarch
Microarchitecture


| Name | Computers | Percent |
|---|---|---|
| Skylake | 31 | 24.22% |
| Haswell | 14 | 10.94% |
| IvyBridge | 12 | 9.38% |
| KabyLake | 10 | 7.81% |
| Zen | 9 | 7.03% |
| SandyBridge | 9 | 7.03% |
| Zen 2 | 7 | 5.47% |
| Core | 6 | 4.69% |
| Broadwell | 6 | 4.69% |
| Zen+ | 4 | 3.13% |
| Piledriver | 4 | 3.13% |
| Silvermont | 3 | 2.34% |
| Nehalem | 3 | 2.34% |
| K10 | 3 | 2.34% |
| Westmere | 2 | 1.56% |
| Goldmont | 2 | 1.56% |
| K8 Hammer | 1 | 0.78% |
| K10 Llano | 1 | 0.78% |
| Bonnell | 1 | 0.78% |
CPU Microcode
Microcode number


| Number | Computers | Percent |
|---|---|---|
| Unknown | 22 | 17.19% |
| 0x306a9 | 9 | 7.03% |
| 0x906ea | 8 | 6.25% |
| 0x40651 | 6 | 4.69% |
| 0x206a7 | 6 | 4.69% |
| 0x906e9 | 5 | 3.91% |
| 0x806ec | 5 | 3.91% |
| 0x306d4 | 5 | 3.91% |
| 0x08701013 | 5 | 3.91% |
| 0x406e3 | 4 | 3.13% |
| 0x306c3 | 4 | 3.13% |
| 0x08101016 | 4 | 3.13% |
| 0x806ea | 3 | 2.34% |
| 0x0800820d | 3 | 2.34% |
| 0x06000822 | 3 | 2.34% |
| 0x906ed | 2 | 1.56% |
| 0x906ec | 2 | 1.56% |
| 0x506c9 | 2 | 1.56% |
| 0x406c3 | 2 | 1.56% |
| 0x106a5 | 2 | 1.56% |
| 0x1067a | 2 | 1.56% |
| 0x0810100b | 2 | 1.56% |
| 0x08001138 | 2 | 1.56% |
| 0x806e9 | 1 | 0.78% |
| 0x6fd | 1 | 0.78% |
| 0x6fb | 1 | 0.78% |
| 0x506e3 | 1 | 0.78% |
| 0x406c4 | 1 | 0.78% |
| 0x306f2 | 1 | 0.78% |
| 0x206d7 | 1 | 0.78% |
| 0x206c2 | 1 | 0.78% |
| 0x20652 | 1 | 0.78% |
| 0x106e5 | 1 | 0.78% |
| 0x106ca | 1 | 0.78% |
| 0x10677 | 1 | 0.78% |
| 0x10676 | 1 | 0.78% |
| 0x08701012 | 1 | 0.78% |
| 0x0800820c | 1 | 0.78% |
| 0x08001126 | 1 | 0.78% |
| 0x03000027 | 1 | 0.78% |
| 0x010000c8 | 1 | 0.78% |
| 0x010000b6 | 1 | 0.78% |
| 0x01000065 | 1 | 0.78% |
GPU Vendor
Vendors of graphics cards


| Vendor | Computers | Percent |
|---|---|---|
| Intel | 76 | 49.03% |
| Nvidia | 50 | 32.26% |
| AMD | 29 | 18.71% |
GPU Model
Graphics card models


| Model | Computers | Percent |
|---|---|---|
| UHD Graphics 630 (Mobile) | 8 | 4.94% |
| Haswell-ULT Integrated Graphics Controller | 8 | 4.94% |
| 3rd Gen Core processor Graphics Controller | 8 | 4.94% |
| Raven Ridge [Radeon Vega Series / Radeon Vega Mobile Series] | 6 | 3.7% |
| HD Graphics 5500 | 6 | 3.7% |
| 2nd Generation Core Processor Family Integrated Graphics Controller | 6 | 3.7% |
| UHD Graphics 620 (Whiskey Lake) | 5 | 3.09% |
| UHD Graphics 620 | 5 | 3.09% |
| Skylake GT2 [HD Graphics 520] | 4 | 2.47% |
| Navi 10 [Radeon RX 5600 OEM/5600 XT / 5700/5700 XT] | 4 | 2.47% |
| Ellesmere [Radeon RX 470/480/570/570X/580/580X/590] | 4 | 2.47% |
| 4th Gen Core Processor Integrated Graphics Controller | 4 | 2.47% |
| Xeon E3-1200 v2/3rd Gen Core processor Graphics Controller | 3 | 1.85% |
| TU117M [GeForce GTX 1650 Mobile / Max-Q] | 3 | 1.85% |
| Tahiti PRO [Radeon HD 7950/8950 OEM / R9 280] | 3 | 1.85% |
| GP107M [GeForce GTX 1050 Ti Mobile] | 3 | 1.85% |
| GP107 [GeForce GTX 1050 Ti] | 3 | 1.85% |
| GM204 [GeForce GTX 970] | 3 | 1.85% |
| Atom/Celeron/Pentium Processor x5-E8000/J3xxx/N3xxx Integrated Graphics Controller | 3 | 1.85% |
| UHD Graphics 630 (Desktop 9 Series) | 2 | 1.23% |
| TU104GLM [Quadro RTX 4000 Mobile / Max-Q] | 2 | 1.23% |
| Park [Mobility Radeon HD 5430/5450/5470] | 2 | 1.23% |
| HD Graphics 620 | 2 | 1.23% |
| HD Graphics 500 | 2 | 1.23% |
| GP104 [GeForce GTX 1080] | 2 | 1.23% |
| GK208BM [GeForce 920M] | 2 | 1.23% |
| GF117M [GeForce 610M/710M/810M/820M / GT 620M/625M/630M/720M] | 2 | 1.23% |
| Baffin [Radeon RX 550 640SP / RX 560/560X] | 2 | 1.23% |
| Vega 20 [Radeon VII] | 1 | 0.62% |
| Vega 10 XL/XT [Radeon RX Vega 56/64] | 1 | 0.62% |
| UHD Graphics 630 (Desktop) | 1 | 0.62% |
| UHD Graphics | 1 | 0.62% |
| TU117 [GeForce GTX 1650] | 1 | 0.62% |
| TU116 [GeForce GTX 1660] | 1 | 0.62% |
| TU106 [GeForce RTX 2070 Rev. A] | 1 | 0.62% |
| TU106 [GeForce RTX 2060 SUPER] | 1 | 0.62% |
| TU104 [GeForce RTX 2070 SUPER] | 1 | 0.62% |
| Topaz XT [Radeon R7 M260/M265 / M340/M360 / M440/M445 / 530/535 / 620/625 Mobile] | 1 | 0.62% |
| Tahiti XT [Radeon HD 7970/8970 OEM / R9 280X] | 1 | 0.62% |
| Sumo [Radeon HD 6520G] | 1 | 0.62% |
| RV635 [Radeon HD 3650/3750/4570/4580] | 1 | 0.62% |
| Redwood PRO [Radeon HD 5550/5570/5630/6510/6610/7570] | 1 | 0.62% |
| Navi 14 [Radeon RX 5500/5500M / Pro 5500M] | 1 | 0.62% |
| Mobile GM965/GL960 Integrated Graphics Controller (secondary) | 1 | 0.62% |
| Mobile GM965/GL960 Integrated Graphics Controller (primary) | 1 | 0.62% |
| HD Graphics P530 | 1 | 0.62% |
| HD Graphics 630 | 1 | 0.62% |
| HD Graphics 615 | 1 | 0.62% |
| HD Graphics 530 | 1 | 0.62% |
| GT216 [GeForce GT 220] | 1 | 0.62% |
| GP108 [GeForce GT 1030] | 1 | 0.62% |
| GP107 [GeForce GTX 1050] | 1 | 0.62% |
| GP106M [GeForce GTX 1060 Mobile] | 1 | 0.62% |
| GP104 [GeForce GTX 1070] | 1 | 0.62% |
| GP104 [GeForce GTX 1070 Ti] | 1 | 0.62% |
| GM206 [GeForce GTX 950] | 1 | 0.62% |
| GM204M [GeForce GTX 970M] | 1 | 0.62% |
| GM200GL [Quadro M6000] | 1 | 0.62% |
| GM200 [GeForce GTX 980 Ti] | 1 | 0.62% |
| GM108M [GeForce 940MX] | 1 | 0.62% |
GPU Combo
Combinations of graphics cards


| Name | Computers | Percent |
|---|---|---|
| 1 x Intel | 51 | 39.84% |
| 1 x Nvidia | 24 | 18.75% |
| 1 x AMD | 23 | 17.97% |
| Intel + Nvidia | 22 | 17.19% |
| 2 x AMD | 3 | 2.34% |
| 2 x Nvidia | 2 | 1.56% |
| AMD + Nvidia | 2 | 1.56% |
| Intel + AMD | 1 | 0.78% |
GPU Driver
Free vs proprietary


| Driver | Computers | Percent |
|---|---|---|
| Free | 94 | 73.44% |
| Proprietary | 33 | 25.78% |
| Unknown | 1 | 0.78% |
GPU Memory
Total video memory


| Size in GB | Computers | Percent |
|---|---|---|
| Unknown | 71 | 55.47% |
| 1.01-2.0 | 14 | 10.94% |
| 7.01-8.0 | 12 | 9.38% |
| 3.01-4.0 | 10 | 7.81% |
| 0.01-0.5 | 8 | 6.25% |
| 2.01-3.0 | 5 | 3.91% |
| 0.51-1.0 | 4 | 3.13% |
| 5.01-6.0 | 3 | 2.34% |
| 8.01-16.0 | 1 | 0.78% |
Monitor Vendor
Monitor vendors


| Vendor | Computers | Percent |
|---|---|---|
| AU Optronics | 19 | 12.58% |
| LG Display | 17 | 11.26% |
| Samsung Electronics | 16 | 10.6% |
| Chimei Innolux | 14 | 9.27% |
| Goldstar | 10 | 6.62% |
| BOE | 7 | 4.64% |
| Dell | 6 | 3.97% |
| BenQ | 5 | 3.31% |
| AOC | 5 | 3.31% |
| Ancor Communications | 5 | 3.31% |
| Acer | 5 | 3.31% |
| Sharp | 3 | 1.99% |
| Iiyama | 3 | 1.99% |
| Hewlett-Packard | 3 | 1.99% |
| ViewSonic | 2 | 1.32% |
| Unknown | 2 | 1.32% |
| Philips | 2 | 1.32% |
| Panasonic | 2 | 1.32% |
| NEC Computers | 2 | 1.32% |
| LG Electronics | 2 | 1.32% |
| Hitachi | 2 | 1.32% |
| Apple | 2 | 1.32% |
| Vizio | 1 | 0.66% |
| Unknown (AAA) | 1 | 0.66% |
| Toshiba | 1 | 0.66% |
| Sony | 1 | 0.66% |
| Sceptre | 1 | 0.66% |
| PANDA | 1 | 0.66% |
| Orion | 1 | 0.66% |
| ONN | 1 | 0.66% |
| Lenovo | 1 | 0.66% |
| ITE | 1 | 0.66% |
| Insignia | 1 | 0.66% |
| InnoLux Display | 1 | 0.66% |
| InfoVision | 1 | 0.66% |
| HannStar | 1 | 0.66% |
| GRUNDIG | 1 | 0.66% |
| CPT | 1 | 0.66% |
| ASUSTek Computer | 1 | 0.66% |
Monitor Model
Monitor models


| Model | Computers | Percent |
|---|---|---|
| LG FULL HD GSM5AB9 1680x1050 480x270mm 21.7-inch | 3 | 1.95% |
| 2260WG5 AOC2260 1920x1080 477x268mm 21.5-inch | 3 | 1.95% |
| ZOWIE XL LCD BNQ7F31 1920x1080 531x298mm 24.0-inch | 2 | 1.3% |
| X93S D-sub HIT7009 1280x1024 376x301mm 19.0-inch | 2 | 1.3% |
| VVX13F009G00 MEI96A2 1920x1080 290x170mm 13.2-inch | 2 | 1.3% |
| Ultra HD GSM5B09 3840x2160 600x340mm 27.2-inch | 2 | 1.3% |
| LCD Monitor LGD033A 1366x768 340x190mm 15.3-inch | 2 | 1.3% |
| LCD Monitor CMN15BF 1366x768 344x193mm 15.5-inch | 2 | 1.3% |
| LCD Monitor CMN14C9 1920x1080 309x173mm 13.9-inch | 2 | 1.3% |
| LCD Monitor AUO423D 1920x1080 309x173mm 13.9-inch | 2 | 1.3% |
| LCD Monitor AUO40EC 1366x768 340x190mm 15.3-inch | 2 | 1.3% |
| LCD Monitor AUO213E 1600x900 309x174mm 14.0-inch | 2 | 1.3% |
| C27F390 SAM0D32 1920x1080 600x340mm 27.2-inch | 2 | 1.3% |
| W2043 GSM4E9E 1600x900 443x249mm 20.0-inch | 1 | 0.65% |
| VX2776 Series VSC3E32 1920x1080 598x336mm 27.0-inch | 1 | 0.65% |
| VX2453 Series VSC0C28 1920x1080 520x290mm 23.4-inch | 1 | 0.65% |
| VE247 ACI2493 1920x1080 531x299mm 24.0-inch | 1 | 0.65% |
| VC279 ACI27C4 1920x1080 598x336mm 27.0-inch | 1 | 0.65% |
| V246HL ACR0336 1920x1080 531x299mm 24.0-inch | 1 | 0.65% |
| ULTRAWIDE GSM76FC 3840x1600 874x366mm 37.3-inch | 1 | 0.65% |
| ULTRAWIDE GSM5AFB 2560x1080 798x334mm 34.1-inch | 1 | 0.65% |
| U28E590 SAM0C4E 3840x2160 608x345mm 27.5-inch | 1 | 0.65% |
| U28E590 SAM0C4D 3840x2160 607x345mm 27.5-inch | 1 | 0.65% |
| U2412M DELA07B 1920x1200 518x324mm 24.1-inch | 1 | 0.65% |
| U2212HM DELD047 1920x1080 475x267mm 21.5-inch | 1 | 0.65% |
| TV TSB0105 1920x1080 708x398mm 32.0-inch | 1 | 0.65% |
| TV SNYE903 1920x1080 1600x900mm 72.3-inch | 1 | 0.65% |
| SyncMaster SAM041D 1920x1200 459x296mm 21.5-inch | 1 | 0.65% |
| SyncMaster SAM02B6 1920x1200 518x324mm 24.1-inch | 1 | 0.65% |
| SMB2430L SAM0645 1920x1080 521x293mm 23.5-inch | 1 | 0.65% |
| S27F350 SAM0D22 1920x1080 598x336mm 27.0-inch | 1 | 0.65% |
| S24D300 SAM0B43 1920x1080 531x299mm 24.0-inch | 1 | 0.65% |
| ROG PG278QR AUS27B1 2560x1440 600x340mm 27.2-inch | 1 | 0.65% |
| PLX2283H IVM5638 1920x1080 477x268mm 21.5-inch | 1 | 0.65% |
| PL2474H IVM6137 1920x1080 521x293mm 23.5-inch | 1 | 0.65% |
| PL2409HD IVM560C 1920x1080 521x293mm 23.5-inch | 1 | 0.65% |
| P221 HWP3058 1920x1080 476x268mm 21.5-inch | 1 | 0.65% |
| ORION ORN1208 1920x540 | 1 | 0.65% |
| ONA18HO015 ONN0101 1920x1080 698x393mm 31.5-inch | 1 | 0.65% |
| LM05 HSP0013 1440x900 408x255mm 18.9-inch | 1 | 0.65% |
| LEN LT2223zwC LEN60A2 1920x1080 477x268mm 21.5-inch | 1 | 0.65% |
| LED Cinema APP9226 2560x1440 600x340mm 27.2-inch | 1 | 0.65% |
| LCDTV AAA3393 1360x768 890x500mm 40.2-inch | 1 | 0.65% |
| LCD Monitor X34 3440x1440 | 1 | 0.65% |
| LCD Monitor WUXGA | 1 | 0.65% |
| LCD Monitor W2340 3840x1080 | 1 | 0.65% |
| LCD Monitor U28E590 3840x2160 | 1 | 0.65% |
| LCD Monitor SHP148D 3840x2160 344x194mm 15.5-inch | 1 | 0.65% |
| LCD Monitor SHP1453 1920x1080 346x194mm 15.6-inch | 1 | 0.65% |
| LCD Monitor SEC4256 1600x900 382x215mm 17.3-inch | 1 | 0.65% |
| LCD Monitor SEC3847 1440x900 367x230mm 17.1-inch | 1 | 0.65% |
| LCD Monitor SEC334D 1600x900 382x214mm 17.2-inch | 1 | 0.65% |
| LCD Monitor SDC4852 3840x2160 340x190mm 15.3-inch | 1 | 0.65% |
| LCD Monitor SDC334D 1920x1080 309x174mm 14.0-inch | 1 | 0.65% |
| LCD Monitor S24B300 1920x1080 | 1 | 0.65% |
| LCD Monitor PHL BDM4065 3840x2160 | 1 | 0.65% |
| LCD Monitor NCP0036 1920x1080 344x194mm 15.5-inch | 1 | 0.65% |
| LCD Monitor LGD05EA 1920x1080 294x165mm 13.3-inch | 1 | 0.65% |
| LCD Monitor LGD05E5 1920x1080 344x194mm 15.5-inch | 1 | 0.65% |
| LCD Monitor LGD0590 1920x1080 344x194mm 15.5-inch | 1 | 0.65% |
Monitor Resolution
Monitor screen resolution


| Resolution | Computers | Percent |
|---|---|---|
| 1920x1080 (FHD) | 62 | 44.29% |
| 1366x768 (WXGA) | 31 | 22.14% |
| 3840x2160 (4K) | 11 | 7.86% |
| 1600x900 (HD+) | 6 | 4.29% |
| 2560x1440 (QHD) | 5 | 3.57% |
| 3840x1080 | 3 | 2.14% |
| 1920x1200 (WUXGA) | 3 | 2.14% |
| 1680x1050 (WSXGA+) | 3 | 2.14% |
| 1280x1024 (SXGA) | 3 | 2.14% |
| Unknown | 3 | 2.14% |
| 1440x900 (WXGA+) | 2 | 1.43% |
| 1360x768 | 2 | 1.43% |
| 3840x1600 | 1 | 0.71% |
| 3440x1440 | 1 | 0.71% |
| 2560x1080 | 1 | 0.71% |
| 1920x540 | 1 | 0.71% |
| 1920x1280 | 1 | 0.71% |
| 1280x800 (WXGA) | 1 | 0.71% |
Monitor Diagonal
Diagonal size in inches


| Inches | Computers | Percent |
|---|---|---|
| 15 | 32 | 21.77% |
| 13 | 20 | 13.61% |
| 27 | 15 | 10.2% |
| Unknown | 14 | 9.52% |
| 21 | 11 | 7.48% |
| 24 | 10 | 6.8% |
| 14 | 10 | 6.8% |
| 23 | 9 | 6.12% |
| 17 | 5 | 3.4% |
| 12 | 4 | 2.72% |
| 19 | 3 | 2.04% |
| 72 | 2 | 1.36% |
| 22 | 2 | 1.36% |
| 20 | 2 | 1.36% |
| 40 | 1 | 0.68% |
| 37 | 1 | 0.68% |
| 34 | 1 | 0.68% |
| 32 | 1 | 0.68% |
| 31 | 1 | 0.68% |
| 26 | 1 | 0.68% |
| 18 | 1 | 0.68% |
| 11 | 1 | 0.68% |
Monitor Width
Physical width


| Width in mm | Computers | Percent |
|---|---|---|
| 301-350 | 53 | 36.3% |
| 501-600 | 32 | 21.92% |
| 401-500 | 16 | 10.96% |
| 201-300 | 14 | 9.59% |
| Unknown | 14 | 9.59% |
| 351-400 | 8 | 5.48% |
| 601-700 | 3 | 2.05% |
| 801-900 | 2 | 1.37% |
| 701-800 | 2 | 1.37% |
| 1501-2000 | 2 | 1.37% |
Aspect Ratio
Proportional relationship between the width and the height


| Ratio | Computers | Percent |
|---|---|---|
| 16/9 | 105 | 78.36% |
| Unknown | 13 | 9.7% |
| 16/10 | 9 | 6.72% |
| 5/4 | 3 | 2.24% |
| 21/9 | 2 | 1.49% |
| 32/9 | 1 | 0.75% |
| 3/2 | 1 | 0.75% |
Monitor Area
Area in inch²


| Area in inch² | Computers | Percent |
|---|---|---|
| 101-110 | 32 | 21.33% |
| 201-250 | 23 | 15.33% |
| 81-90 | 21 | 14% |
| 301-350 | 15 | 10% |
| 151-200 | 14 | 9.33% |
| Unknown | 14 | 9.33% |
| 71-80 | 9 | 6% |
| 251-300 | 5 | 3.33% |
| 61-70 | 4 | 2.67% |
| 351-500 | 4 | 2.67% |
| 121-130 | 3 | 2% |
| More than 1000 | 2 | 1.33% |
| 131-140 | 2 | 1.33% |
| 51-60 | 1 | 0.67% |
| 501-1000 | 1 | 0.67% |
Pixel Density
Pixels per inch


| Density | Computers | Percent |
|---|---|---|
| 101-120 | 47 | 32.87% |
| 51-100 | 34 | 23.78% |
| 121-160 | 29 | 20.28% |
| 161-240 | 14 | 9.79% |
| Unknown | 14 | 9.79% |
| 1-50 | 3 | 2.1% |
| More than 240 | 2 | 1.4% |
Multiple Monitors
Total monitors connected


| Total | Computers | Percent |
|---|---|---|
| 1 | 102 | 79.69% |
| 2 | 24 | 18.75% |
| 3 | 1 | 0.78% |
| 0 | 1 | 0.78% |
Net Controller Vendor
Controller vendors


| Vendor | Computers | Percent |
|---|---|---|
| Intel | 27 | 72.97% |
| Realtek Semiconductor | 4 | 10.81% |
| Nvidia | 2 | 5.41% |
| NetGear | 1 | 2.7% |
| Microchip Technology | 1 | 2.7% |
| FIBOCOM | 1 | 2.7% |
| Ericsson Business Mobile Networks | 1 | 2.7% |
Net Controller Model
Controller models


| Model | Computers | Percent |
|---|---|---|
| 82579LM Gigabit Network Connection (Lewisville) | 9 | 20% |
| I211 Gigabit Network Connection | 8 | 17.78% |
| Wi-Fi 6 AX200 | 7 | 15.56% |
| Centrino Advanced-N 6205 [Taylor Peak] | 5 | 11.11% |
| 82579V Gigabit Network Connection | 4 | 8.89% |
| RTL8153 Gigabit Ethernet Adapter | 3 | 6.67% |
| MCP61 Ethernet | 2 | 4.44% |
| 82574L Gigabit Network Connection | 2 | 4.44% |
| RTL8111/8168/8411 PCI Express Gigabit Ethernet Controller | 1 | 2.22% |
| L830-EB-00 | 1 | 2.22% |
| HTC Hub Controller | 1 | 2.22% |
| H5321 gw Mobile Broadband Driver | 1 | 2.22% |
| A6210 | 1 | 2.22% |
Net Controller Kind
Ethernet, WiFi or modem


| Kind | Computers | Percent |
|---|---|---|
| Ethernet | 28 | 65.12% |
| WiFi | 14 | 32.56% |
| Modem | 1 | 2.33% |
Used Controller
Currently used network controller


| Kind | Computers | Percent |
|---|---|---|
| Ethernet | 13 | 61.9% |
| WiFi | 8 | 38.1% |
NICs
Total network controllers on board


| Total | Computers | Percent |
|---|---|---|
| 2 | 69 | 53.91% |
| 1 | 51 | 39.84% |
| 3 | 6 | 4.69% |
| 0 | 2 | 1.56% |
Unsupported Devices
Total unsupported devices on board


| Total | Computers | Percent |
|---|---|---|
| 0 | 92 | 71.88% |
| 1 | 29 | 22.66% |
| 2 | 6 | 4.69% |
| 3 | 1 | 0.78% |
Unsupported Device Types
Types of unsupported devices


| Type | Computers | Percent |
|---|---|---|
| Fingerprint reader | 10 | 22.73% |
| Graphics card | 8 | 18.18% |
| Chipcard | 7 | 15.91% |
| Camera | 6 | 13.64% |
| Net/wireless | 3 | 6.82% |
| Communication controller | 3 | 6.82% |
| Unassigned class | 1 | 2.27% |
| Storage/ide | 1 | 2.27% |
| Storage | 1 | 2.27% |
| Sound | 1 | 2.27% |
| Net/ethernet | 1 | 2.27% |
| Dvb card | 1 | 2.27% |
| Card reader | 1 | 2.27% |