Zorin Hardware Trends
A project to identify most popular hardware characteristics and track their change over time based on data collected by Zorin users at https://Linux-Hardware.org.
Anyone can contribute to the study by uploading probes of their computers by the hw-probe tool:
sudo hw-probe -all -uploadThis is a report for all computer types. See also reports for desktops and notebooks.
Full-feature report is available here: https://linux-hardware.org/?view=trends
Period: Mar, 2020.
Contents
- OS
- OS Family
- Kernel
- Kernel Family
- Kernel Major Ver.
- Arch
- DE
- Display Server
- OS Lang
- Boot Mode
- Filesystem
- Dual Boot with Linux
- Dual Boot (Win)
- Country
- City
- Vendor
- Model
- Model Family
- MFG Year
- Form Factor
- Secure Boot
- Coreboot
- RAM Size
- RAM Used
- Drive Vendor
- Drive Model
- Drive Kind
- Drive Connector
- Drive Size
- Space Total
- Space Used
- Malfunc. Drives
- Malfunc. Drive Vendor
- Malfunc. Drive Kind
- Failed Drives
- Failed Drive Vendor
- Drive Status
- Storage Vendor
- Storage Model
- Storage Kind
- CPU Vendor
- CPU Model
- CPU Model Family
- CPU Cores
- CPU Sockets
- CPU Threads
- CPU Op-Modes
- CPU Microarch
- CPU Microcode
- GPU Vendor
- GPU Model
- GPU Combo
- GPU Driver
- GPU Memory
- Monitor Vendor
- Monitor Model
- Monitor Resolution
- Monitor Diagonal
- Monitor Width
- Aspect Ratio
- Monitor Area
- Pixel Density
- Multiple Monitors
- Net Controller Vendor
- Net Controller Model
- Net Controller Kind
- Used Controller
- NICs
- Unsupported Devices
- Unsupported Device Types
OS
Installed operating systems


| Name | Computers | Percent |
|---|---|---|
| Zorin 15 | 113 | 91.87% |
| Zorin 12 | 10 | 8.13% |
OS Family
OS without a version


| Name | Computers | Percent |
|---|---|---|
| Zorin | 123 | 100% |
Kernel
Version of the Linux kernel


| Version | Computers | Percent |
|---|---|---|
| 5.3.0-40-generic | 54 | 43.9% |
| 5.3.0-42-generic | 49 | 39.84% |
| 4.15.0-88-generic | 4 | 3.25% |
| 5.3.0-45-generic | 3 | 2.44% |
| 4.18.0-21-generic | 3 | 2.44% |
| 4.15.0-91-generic | 3 | 2.44% |
| 5.0.0-37-generic | 2 | 1.63% |
| 5.6.0-999-lowlatency | 1 | 0.81% |
| 5.6.0-050600rc7-generic | 1 | 0.81% |
| 4.4.0-176-generic | 1 | 0.81% |
| 4.15.0-76-generic | 1 | 0.81% |
| 4.15.0-30-generic | 1 | 0.81% |
Kernel Family
Linux kernel without a distro release


| Version | Computers | Percent |
|---|---|---|
| 5.3.0 | 106 | 86.18% |
| 4.15.0 | 9 | 7.32% |
| 4.18.0 | 3 | 2.44% |
| 5.6.0 | 2 | 1.63% |
| 5.0.0 | 2 | 1.63% |
| 4.4.0 | 1 | 0.81% |
Kernel Major Ver.
Linux kernel major version


| Version | Computers | Percent |
|---|---|---|
| 5.3 | 106 | 86.18% |
| 4.15 | 9 | 7.32% |
| 4.18 | 3 | 2.44% |
| 5.6 | 2 | 1.63% |
| 5.0 | 2 | 1.63% |
| 4.4 | 1 | 0.81% |
Arch
OS architecture (x86_64, i586, etc.)


| Name | Computers | Percent |
|---|---|---|
| x86_64 | 109 | 88.62% |
| i686 | 14 | 11.38% |
DE
Desktop Environment


| Name | Computers | Percent |
|---|---|---|
| GNOME | 84 | 68.29% |
| XFCE | 38 | 30.89% |
| Unity | 1 | 0.81% |
Display Server
X11 or Wayland


| Name | Computers | Percent |
|---|---|---|
| X11 | 121 | 98.37% |
| Wayland | 2 | 1.63% |
OS Lang
Language


| Lang | Computers | Percent |
|---|---|---|
| en_US | 33 | 26.83% |
| de_DE | 10 | 8.13% |
| pt_BR | 9 | 7.32% |
| it_IT | 7 | 5.69% |
| pl_PL | 6 | 4.88% |
| en_GB | 6 | 4.88% |
| ru_RU | 4 | 3.25% |
| nl_NL | 4 | 3.25% |
| fr_FR | 4 | 3.25% |
| sv_SE | 3 | 2.44% |
| pt_PT | 3 | 2.44% |
| es_MX | 3 | 2.44% |
| es_ES | 3 | 2.44% |
| en_CA | 3 | 2.44% |
| en_AU | 3 | 2.44% |
| ru_UA | 2 | 1.63% |
| es_PE | 2 | 1.63% |
| es_AR | 2 | 1.63% |
| en_NZ | 2 | 1.63% |
| en_IN | 2 | 1.63% |
| de_CH | 2 | 1.63% |
| de_AT | 2 | 1.63% |
| uk_UA | 1 | 0.81% |
| sl_SI | 1 | 0.81% |
| ja_JP | 1 | 0.81% |
| it_CH | 1 | 0.81% |
| el_GR | 1 | 0.81% |
| da_DK | 1 | 0.81% |
| cs_CZ | 1 | 0.81% |
| C | 1 | 0.81% |
Boot Mode
EFI or BIOS


| Mode | Computers | Percent |
|---|---|---|
| BIOS | 76 | 61.79% |
| EFI | 47 | 38.21% |
Filesystem
Type of filesystem


| Type | Computers | Percent |
|---|---|---|
| Ext4 | 118 | 95.93% |
| Overlay | 4 | 3.25% |
| Ext2 | 1 | 0.81% |
Dual Boot with Linux
Hosting more than one Linux


| Dual boot | Computers | Percent |
|---|---|---|
| No | 106 | 86.18% |
| Yes | 17 | 13.82% |
Dual Boot (Win)
Hosting Linux and Windows


| Dual boot | Computers | Percent |
|---|---|---|
| No | 83 | 67.48% |
| Yes | 40 | 32.52% |
Country
Geographic location (country)


| Country | Computers | Percent |
|---|---|---|
| USA | 19 | 15.45% |
| Germany | 10 | 8.13% |
| Brazil | 9 | 7.32% |
| Italy | 7 | 5.69% |
| Ukraine | 5 | 4.07% |
| UK | 5 | 4.07% |
| Sweden | 5 | 4.07% |
| Poland | 5 | 4.07% |
| Canada | 5 | 4.07% |
| Netherlands | 4 | 3.25% |
| Mexico | 4 | 3.25% |
| France | 4 | 3.25% |
| Switzerland | 3 | 2.44% |
| Russia | 3 | 2.44% |
| New Zealand | 3 | 2.44% |
| Australia | 3 | 2.44% |
| Spain | 2 | 1.63% |
| Portugal | 2 | 1.63% |
| Peru | 2 | 1.63% |
| Norway | 2 | 1.63% |
| India | 2 | 1.63% |
| Greece | 2 | 1.63% |
| Austria | 2 | 1.63% |
| Argentina | 2 | 1.63% |
| Slovenia | 1 | 0.81% |
| Serbia | 1 | 0.81% |
| Romania | 1 | 0.81% |
| Pakistan | 1 | 0.81% |
| Lebanon | 1 | 0.81% |
| Kuwait | 1 | 0.81% |
| Korea, Republic of | 1 | 0.81% |
| Japan | 1 | 0.81% |
| Denmark | 1 | 0.81% |
| Czech Republic | 1 | 0.81% |
| Belgium | 1 | 0.81% |
| Bangladesh | 1 | 0.81% |
| Angola | 1 | 0.81% |
City
Geographic location (city)


| City | Computers | Percent |
|---|---|---|
| Zurich | 2 | 1.63% |
| Vienna | 2 | 1.63% |
| Sydney | 2 | 1.63% |
| Odesa | 2 | 1.63% |
| New Delhi | 2 | 1.63% |
| Munich | 2 | 1.63% |
| Lisbon | 2 | 1.63% |
| Jastrzębie Zdrój | 2 | 1.63% |
| Düsseldorf | 2 | 1.63% |
| Škofja Loka | 1 | 0.81% |
| Woerden | 1 | 0.81% |
| Winona | 1 | 0.81% |
| Wettingen | 1 | 0.81% |
| Westerville | 1 | 0.81% |
| Werl | 1 | 0.81% |
| Vikarbyn | 1 | 0.81% |
| Venosa | 1 | 0.81% |
| Valladolid | 1 | 0.81% |
| Tunkhannock | 1 | 0.81% |
| Trinec | 1 | 0.81% |
| Tijuana | 1 | 0.81% |
| Taubate | 1 | 0.81% |
| Taby | 1 | 0.81% |
| São Paulo | 1 | 0.81% |
| Stuttgart | 1 | 0.81% |
| Stittsville | 1 | 0.81% |
| St. Albert | 1 | 0.81% |
| Skellefteå | 1 | 0.81% |
| Skegness | 1 | 0.81% |
| Santee | 1 | 0.81% |
| Sandy | 1 | 0.81% |
| San Martino Buon Albergo | 1 | 0.81% |
| San Luis Potosí City | 1 | 0.81% |
| San Fernando | 1 | 0.81% |
| Roverbella | 1 | 0.81% |
| Rotterdam | 1 | 0.81% |
| Rochester | 1 | 0.81% |
| Rafaela | 1 | 0.81% |
| Pyeongtaek-si | 1 | 0.81% |
| Puebla | 1 | 0.81% |
| Pratt | 1 | 0.81% |
| Phoenix | 1 | 0.81% |
| Perth | 1 | 0.81% |
| Pereslavl'-Zalesskiy | 1 | 0.81% |
| Pelplin | 1 | 0.81% |
| Ostrów Wielkopolski | 1 | 0.81% |
| Oslo | 1 | 0.81% |
| Oscoda | 1 | 0.81% |
| Osby | 1 | 0.81% |
| Okara | 1 | 0.81% |
| North Bergen | 1 | 0.81% |
| Mount Juliet | 1 | 0.81% |
| Mount Holly | 1 | 0.81% |
| Moscow | 1 | 0.81% |
| Montreal | 1 | 0.81% |
| Mongagua | 1 | 0.81% |
| Maua | 1 | 0.81% |
| Manaus | 1 | 0.81% |
| Maassluis | 1 | 0.81% |
| Lycksele | 1 | 0.81% |
Vendor
Motherboard manufacturer


| Name | Computers | Percent |
|---|---|---|
| Hewlett-Packard | 31 | 25.2% |
| ASUSTek Computer | 13 | 10.57% |
| Dell | 12 | 9.76% |
| Lenovo | 11 | 8.94% |
| Toshiba | 6 | 4.88% |
| Gigabyte Technology | 6 | 4.88% |
| Acer | 6 | 4.88% |
| Samsung Electronics | 5 | 4.07% |
| ASRock | 5 | 4.07% |
| MSI | 4 | 3.25% |
| Apple | 4 | 3.25% |
| Sony | 2 | 1.63% |
| Pegatron | 2 | 1.63% |
| Fujitsu | 2 | 1.63% |
| QDI | 1 | 0.81% |
| Positivo | 1 | 0.81% |
| PCChips | 1 | 0.81% |
| Panasonic | 1 | 0.81% |
| Medion | 1 | 0.81% |
| LG Electronics | 1 | 0.81% |
| Irbis | 1 | 0.81% |
| I-Life Digital Technologies | 1 | 0.81% |
| 1 | 0.81% | |
| eMachines | 1 | 0.81% |
| ECS | 1 | 0.81% |
| Dixonsxp | 1 | 0.81% |
| Biostar | 1 | 0.81% |
| ABIT | 1 | 0.81% |
Model
Motherboard model


| Name | Computers | Percent |
|---|---|---|
| Toshiba Satellite C660 | 3 | 2.44% |
| Unknown | 3 | 2.44% |
| Fujitsu ESPRIMO P2560 | 2 | 1.63% |
| Dell Inspiron 1520 | 2 | 1.63% |
| Toshiba Toshiba | 1 | 0.81% |
| Toshiba Satellite L455D | 1 | 0.81% |
| Toshiba Satellite L305 | 1 | 0.81% |
| Sony VPCM13M1E | 1 | 0.81% |
| Sony SVF15A17CLB | 1 | 0.81% |
| Samsung Electronics R519/R719 | 1 | 0.81% |
| Samsung Electronics N102 | 1 | 0.81% |
| Samsung Electronics 800G5M/800G5W | 1 | 0.81% |
| Samsung Electronics 340XAA/350XAA/550XAA | 1 | 0.81% |
| Samsung Electronics 305V4A/305V5A/3415VA | 1 | 0.81% |
| QDI P4I865MA | 1 | 0.81% |
| Positivo POS-EIBTDB | 1 | 0.81% |
| Pegatron NE502AV-ABA a6750t | 1 | 0.81% |
| Pegatron DB | 1 | 0.81% |
| PCChips P49G | 1 | 0.81% |
| Panasonic CF-31ACJAXPM | 1 | 0.81% |
| MSI MS-7B84 | 1 | 0.81% |
| MSI MS-7B79 | 1 | 0.81% |
| MSI MS-7135 | 1 | 0.81% |
| MSI GE62 6QF | 1 | 0.81% |
| Medion MD34185/2592 | 1 | 0.81% |
| LG Electronics S460-L.BG24P1 | 1 | 0.81% |
| Lenovo Yoga 300-11IBR 80M1 | 1 | 0.81% |
| Lenovo Y70-70 Touch 80DU | 1 | 0.81% |
| Lenovo ThinkPad T510 4349AW2 | 1 | 0.81% |
| Lenovo ThinkPad T430s 23563RB | 1 | 0.81% |
| Lenovo ThinkPad S3-S440 20AY00BMMD | 1 | 0.81% |
| Lenovo ThinkPad R400 7440WWQ | 1 | 0.81% |
| Lenovo ThinkPad L412 058542G | 1 | 0.81% |
| Lenovo IdeaPad Z570 HuronRiver Platform | 1 | 0.81% |
| Lenovo IdeaPad Y570 20091 | 1 | 0.81% |
| Lenovo G510 20238 | 1 | 0.81% |
| Lenovo Flex 2-15 20405 | 1 | 0.81% |
| Irbis NB111 | 1 | 0.81% |
| I-Life Digital Technologies ZED_AIR_PLUS | 1 | 0.81% |
| HP ZBook 14u G4 | 1 | 0.81% |
| HP ProBook 6550b | 1 | 0.81% |
| HP ProBook 645 G1 | 1 | 0.81% |
| HP ProBook 640 G4 | 1 | 0.81% |
| HP ProBook 4525s | 1 | 0.81% |
| HP ProBook 4320s | 1 | 0.81% |
| HP Presario C500 (RY510EA#ABZ) | 1 | 0.81% |
| HP Pavilion x2 Detachable | 1 | 0.81% |
| HP Pavilion tx1000 | 1 | 0.81% |
| HP Pavilion Notebook 15-bc5xxx | 1 | 0.81% |
| HP Pavilion Laptop 14-ce0xxx | 1 | 0.81% |
| HP Pavilion g6 | 1 | 0.81% |
| HP Pavilion dv9700 | 1 | 0.81% |
| HP Pavilion dv7 | 1 | 0.81% |
| HP Pavilion dv5 | 1 | 0.81% |
| HP Pavilion 15 | 1 | 0.81% |
| HP Pavilion 11 x360 PC | 1 | 0.81% |
| HP Pavilion 10 TS | 1 | 0.81% |
| HP OMEN by HP Laptop | 1 | 0.81% |
| HP Notebook | 1 | 0.81% |
| HP G62 | 1 | 0.81% |
Model Family
Motherboard model prefix


| Name | Computers | Percent |
|---|---|---|
| HP Pavilion | 11 | 8.94% |
| Toshiba Satellite | 5 | 4.07% |
| Lenovo ThinkPad | 5 | 4.07% |
| HP ProBook | 5 | 4.07% |
| Dell Inspiron | 5 | 4.07% |
| HP Compaq | 4 | 3.25% |
| Dell Latitude | 4 | 3.25% |
| Acer Aspire | 3 | 2.44% |
| Unknown | 3 | 2.44% |
| Lenovo IdeaPad | 2 | 1.63% |
| HP EliteBook | 2 | 1.63% |
| Fujitsu ESPRIMO | 2 | 1.63% |
| Dell OptiPlex | 2 | 1.63% |
| ASRock X570 | 2 | 1.63% |
| Toshiba Toshiba | 1 | 0.81% |
| Sony VPCM13M1E | 1 | 0.81% |
| Sony SVF15A17CLB | 1 | 0.81% |
| Samsung Electronics R519 | 1 | 0.81% |
| Samsung Electronics N102 | 1 | 0.81% |
| Samsung Electronics 800G5M | 1 | 0.81% |
| Samsung Electronics 340XAA | 1 | 0.81% |
| Samsung Electronics 305V4A | 1 | 0.81% |
| QDI P4I865MA | 1 | 0.81% |
| Positivo POS-EIBTDB | 1 | 0.81% |
| Pegatron NE502AV-ABA | 1 | 0.81% |
| Pegatron DB | 1 | 0.81% |
| PCChips P49G | 1 | 0.81% |
| Panasonic CF-31ACJAXPM | 1 | 0.81% |
| MSI MS-7B84 | 1 | 0.81% |
| MSI MS-7B79 | 1 | 0.81% |
| MSI MS-7135 | 1 | 0.81% |
| MSI GE62 | 1 | 0.81% |
| Medion MD34185 | 1 | 0.81% |
| LG Electronics S460-L.BG24P1 | 1 | 0.81% |
| Lenovo Yoga | 1 | 0.81% |
| Lenovo Y70-70 | 1 | 0.81% |
| Lenovo G510 | 1 | 0.81% |
| Lenovo Flex | 1 | 0.81% |
| Irbis NB111 | 1 | 0.81% |
| I-Life Digital Technologies ZED | 1 | 0.81% |
| HP ZBook | 1 | 0.81% |
| HP Presario | 1 | 0.81% |
| HP OMEN | 1 | 0.81% |
| HP Notebook | 1 | 0.81% |
| HP G62 | 1 | 0.81% |
| HP G42 | 1 | 0.81% |
| HP 500-312nsm | 1 | 0.81% |
| Google Gnawty | 1 | 0.81% |
| Gigabyte Z170N-Gaming | 1 | 0.81% |
| Gigabyte H61M-DS2 | 1 | 0.81% |
| Gigabyte H61M-D2H-USB3 | 1 | 0.81% |
| Gigabyte GA-78LMT-S2P | 1 | 0.81% |
| Gigabyte GA-770TA-UD3 | 1 | 0.81% |
| Gigabyte AB350-Gaming | 1 | 0.81% |
| eMachines eME728 | 1 | 0.81% |
| ECS K8M890M-M | 1 | 0.81% |
| Dell XPS | 1 | 0.81% |
| Biostar N61PC-M2S | 1 | 0.81% |
| ASUS X553MA | 1 | 0.81% |
| ASUS VivoBook | 1 | 0.81% |
MFG Year
Motherboard manufacture year


| Year | Computers | Percent |
|---|---|---|
| 2019 | 21 | 17.07% |
| 2008 | 13 | 10.57% |
| 2010 | 12 | 9.76% |
| 2014 | 11 | 8.94% |
| 2011 | 10 | 8.13% |
| 2009 | 9 | 7.32% |
| 2018 | 8 | 6.5% |
| 2006 | 8 | 6.5% |
| 2013 | 7 | 5.69% |
| 2017 | 6 | 4.88% |
| 2015 | 6 | 4.88% |
| 2012 | 6 | 4.88% |
| 2020 | 2 | 1.63% |
| 2016 | 1 | 0.81% |
| 2005 | 1 | 0.81% |
| 2004 | 1 | 0.81% |
| 2003 | 1 | 0.81% |
Form Factor
Physical design of the computer


| Name | Computers | Percent |
|---|---|---|
| Notebook | 81 | 65.85% |
| Desktop | 36 | 29.27% |
| Convertible | 3 | 2.44% |
| All in one | 3 | 2.44% |
Secure Boot
Enabled or disabled


| State | Computers | Percent |
|---|---|---|
| Disabled | 117 | 95.12% |
| Enabled | 6 | 4.88% |
Coreboot
Have coreboot on board


| Used | Computers | Percent |
|---|---|---|
| No | 122 | 99.19% |
| Yes | 1 | 0.81% |
RAM Size
Total RAM memory


| Size in GB | Computers | Percent |
|---|---|---|
| 3.01-4.0 | 39 | 31.71% |
| 4.01-8.0 | 23 | 18.7% |
| 1.01-2.0 | 19 | 15.45% |
| 16.01-24.0 | 15 | 12.2% |
| 8.01-16.0 | 15 | 12.2% |
| 0.01-1.0 | 5 | 4.07% |
| 2.01-3.0 | 4 | 3.25% |
| 32.01-64.0 | 2 | 1.63% |
| 24.01-32.0 | 1 | 0.81% |
RAM Used
Used RAM memory


| Used GB | Computers | Percent |
|---|---|---|
| 1.01-2.0 | 61 | 49.59% |
| 2.01-3.0 | 30 | 24.39% |
| 0.01-1.0 | 18 | 14.63% |
| 4.01-8.0 | 7 | 5.69% |
| 3.01-4.0 | 7 | 5.69% |
Drive Vendor
Hard drive vendors


| Vendor | Computers | Drives | Percent |
|---|---|---|---|
| Seagate | 27 | 27 | 18.75% |
| WDC | 23 | 27 | 15.97% |
| Toshiba | 16 | 16 | 11.11% |
| Hitachi | 13 | 13 | 9.03% |
| Samsung Electronics | 11 | 12 | 7.64% |
| Unknown | 9 | 11 | 6.25% |
| MAXTOR | 6 | 6 | 4.17% |
| HGST | 6 | 6 | 4.17% |
| Kingston | 5 | 5 | 3.47% |
| SanDisk | 4 | 4 | 2.78% |
| Fujitsu | 3 | 3 | 2.08% |
| SK Hynix | 2 | 2 | 1.39% |
| Micron Technology | 2 | 2 | 1.39% |
| GOODRAM | 2 | 2 | 1.39% |
| Crucial | 2 | 2 | 1.39% |
| A-DATA Technology | 2 | 2 | 1.39% |
| Transcend | 1 | 1 | 0.69% |
| PLEXTOR | 1 | 1 | 0.69% |
| Phison | 1 | 1 | 0.69% |
| KingDian | 1 | 1 | 0.69% |
| Kingchuxing | 1 | 1 | 0.69% |
| Intel | 1 | 1 | 0.69% |
| China | 1 | 1 | 0.69% |
| ASMT | 1 | 1 | 0.69% |
| Artisan | 1 | 1 | 0.69% |
| Apacer | 1 | 1 | 0.69% |
| AMD-RAID | 1 | 2 | 0.69% |
Drive Model
Hard drive models


| Model | Computers | Percent |
|---|---|---|
| ST9320423AS 320GB | 4 | 2.65% |
| MQ01ABF050 500GB | 4 | 2.65% |
| ST500LT012-1DG142 500GB | 3 | 1.99% |
| MMC Card 32GB | 3 | 1.99% |
| WD40EZRX-00SPEB0 4TB | 2 | 1.32% |
| SV300S37A240G 240GB SSD | 2 | 1.32% |
| ST1000LX015-1U7172 1TB | 2 | 1.32% |
| ST1000LM035-1RK172 1TB | 2 | 1.32% |
| ST1000LM024 HN-M101MBB 1TB | 2 | 1.32% |
| SSD 860 EVO 500GB | 2 | 1.32% |
| SP550 240GB SSD | 2 | 1.32% |
| SA400S37120G 120GB SSD | 2 | 1.32% |
| MQ04ABF100 1TB | 2 | 1.32% |
| MMC Card 64GB | 2 | 1.32% |
| MMC Card 16GB | 2 | 1.32% |
| MK2561GSYN 250GB | 2 | 1.32% |
| HTS721010A9E630 1TB | 2 | 1.32% |
| WDS500G2B0B-00YS70 500GB SSD | 1 | 0.66% |
| WDS120G2G0A-00JH30 120GB SSD | 1 | 0.66% |
| WD800JB-22JJC0 80GB | 1 | 0.66% |
| WD800BEVS-22RST0 80GB | 1 | 0.66% |
| WD7500BPVT-35HXZT1 752GB | 1 | 0.66% |
| WD5000LPVT-60G33T0 500GB | 1 | 0.66% |
| WD40EZRZ-00GXCB0 4TB | 1 | 0.66% |
| WD3200BPVT-35ZEST0 320GB | 1 | 0.66% |
| WD3200BPVT-22JJ5T0 320GB | 1 | 0.66% |
| WD3200BEVT-22ZCT0 320GB | 1 | 0.66% |
| WD3200AAJS-00L7A0 320GB | 1 | 0.66% |
| WD3000GLFS-01F8U0 304GB | 1 | 0.66% |
| WD2500JS-00SGB0 250GB | 1 | 0.66% |
| WD2500BEVT-22A23T0 250GB | 1 | 0.66% |
| WD2500BEVS-60UST0 250GB | 1 | 0.66% |
| WD2500AAKX-60U6AA0 250GB | 1 | 0.66% |
| WD20EZRZ-00Z5HB0 2TB | 1 | 0.66% |
| WD1500HLFS-01G6U0 150GB | 1 | 0.66% |
| WD1200BEVS-22UST0 120GB | 1 | 0.66% |
| WD10S21X-24R1BT0-SSHD-8GB | 1 | 0.66% |
| WD10JPLX-00MBPT0 1TB | 1 | 0.66% |
| WD10JPCX-24UE4T0 1TB | 1 | 0.66% |
| WD10EZEX-08WN4A0 1TB | 1 | 0.66% |
| WD10EALX-229BA0 1TB | 1 | 0.66% |
| TS256GSSD370 256GB | 1 | 0.66% |
| Tribute 1TB | 1 | 0.66% |
| SV300S37A120G 120GB SSD | 1 | 0.66% |
| STM380215AS 80GB | 1 | 0.66% |
| STM3750330AS 752GB | 1 | 0.66% |
| STM3320820AS 320GB | 1 | 0.66% |
| STM3320613AS 320GB | 1 | 0.66% |
| STM3160212A 160GB | 1 | 0.66% |
| ST9250315AS 250GB | 1 | 0.66% |
| ST9100823A 100GB | 1 | 0.66% |
| ST500LM030-2E717D 500GB | 1 | 0.66% |
| ST500LM012 HN-M500MBB 500GB | 1 | 0.66% |
| ST500DM002-1BD142 500GB | 1 | 0.66% |
| ST3808110AS 80GB | 1 | 0.66% |
| ST360021A 64GB | 1 | 0.66% |
| ST3500418AS 500GB | 1 | 0.66% |
| ST3400832AS 400GB | 1 | 0.66% |
| ST320LT012-1DG14C 320GB | 1 | 0.66% |
| ST3200827AS 200GB | 1 | 0.66% |
Drive Kind
HDD or SSD


| Kind | Computers | Drives | Percent |
|---|---|---|---|
| HDD | 90 | 100 | 66.67% |
| SSD | 34 | 39 | 25.19% |
| MMC | 8 | 10 | 5.93% |
| Unknown | 2 | 2 | 1.48% |
| NVMe | 1 | 1 | 0.74% |
Drive Connector
SATA, SAS, NVMe, etc.


| Type | Computers | Drives | Percent |
|---|---|---|---|
| SATA | 114 | 136 | 90.48% |
| MMC | 8 | 10 | 6.35% |
| SAS | 3 | 5 | 2.38% |
| NVMe | 1 | 1 | 0.79% |
Drive Size
Size of hard drive


| Size in TB | Computers | Drives | Percent |
|---|---|---|---|
| 0.01-0.5 | 100 | 118 | 76.34% |
| 0.51-1.0 | 23 | 24 | 17.56% |
| 1.01-2.0 | 4 | 4 | 3.05% |
| 3.01-4.0 | 3 | 5 | 2.29% |
| 2.01-3.0 | 1 | 1 | 0.76% |
Space Total
Amount of disk space available on the file system


| Size in GB | Computers | Percent |
|---|---|---|
| 251-500 | 35 | 28.46% |
| 101-250 | 34 | 27.64% |
| 51-100 | 22 | 17.89% |
| 501-1000 | 16 | 13.01% |
| 21-50 | 8 | 6.5% |
| More than 3000 | 3 | 2.44% |
| 1001-2000 | 3 | 2.44% |
| 1-20 | 2 | 1.63% |
Space Used
Amount of used disk space


| Used GB | Computers | Percent |
|---|---|---|
| 1-20 | 84 | 68.29% |
| 21-50 | 18 | 14.63% |
| 251-500 | 7 | 5.69% |
| 101-250 | 6 | 4.88% |
| 51-100 | 6 | 4.88% |
| More than 3000 | 2 | 1.63% |
Malfunc. Drives
Drive models with a malfunction


| Model | Computers | Drives | Percent |
|---|---|---|---|
| MTFDDAV256TBN-1AR15ABHA 256GB SSD | 1 | 1 | 100% |
Malfunc. Drive Vendor
Vendors of faulty drives


| Vendor | Computers | Drives | Percent |
|---|---|---|---|
| Micron Technology | 1 | 1 | 100% |
Malfunc. Drive Kind
Kinds of faulty drives


| Kind | Computers | Drives | Percent |
|---|---|---|---|
| SSD | 1 | 1 | 100% |
Failed Drives
Failed drive models
Zero info for selected period =(
Failed Drive Vendor
Failed drive vendors
Zero info for selected period =(
Drive Status
Number of failed and malfunc. drives


| Status | Computers | Drives | Percent |
|---|---|---|---|
| Detected | 117 | 148 | 96.69% |
| Works | 3 | 3 | 2.48% |
| Malfunc | 1 | 1 | 0.83% |
Storage Vendor
Storage controller vendors


| Vendor | Computers | Percent |
|---|---|---|
| Intel | 88 | 66.67% |
| AMD | 20 | 15.15% |
| Nvidia | 9 | 6.82% |
| Phison Electronics | 3 | 2.27% |
| VIA Technologies | 2 | 1.52% |
| Samsung Electronics | 2 | 1.52% |
| JMicron Technology | 2 | 1.52% |
| Toshiba America Info Systems | 1 | 0.76% |
| Micron/Crucial Technology | 1 | 0.76% |
| Marvell Technology Group | 1 | 0.76% |
| Lite-On IT Corp. / Plextor | 1 | 0.76% |
| Kingston Technology Company | 1 | 0.76% |
| Apple | 1 | 0.76% |
Storage Model
Storage controller models


| Model | Computers | Percent |
|---|---|---|
| FCH SATA Controller [AHCI mode] | 11 | 6.63% |
| Sunrise Point-LP SATA Controller [AHCI mode] | 7 | 4.22% |
| 82801HM/HEM (ICH8M/ICH8M-E) IDE Controller | 7 | 4.22% |
| NM10/ICH7 Family SATA Controller [IDE mode] | 6 | 3.61% |
| 82801HM/HEM (ICH8M/ICH8M-E) SATA Controller [AHCI mode] | 6 | 3.61% |
| 82801 Mobile SATA Controller [RAID mode] | 6 | 3.61% |
| 82801G (ICH7 Family) IDE Controller | 5 | 3.01% |
| 7 Series Chipset Family 6-port SATA Controller [AHCI mode] | 5 | 3.01% |
| 6 Series/C200 Series Chipset Family 6 port Mobile SATA AHCI Controller | 5 | 3.01% |
| HM170/QM170 Chipset SATA Controller [AHCI Mode] | 4 | 2.41% |
| 82801IBM/IEM (ICH9M/ICH9M-E) 4 port SATA Controller [AHCI mode] | 4 | 2.41% |
| 8 Series/C220 Series Chipset Family 6-port SATA Controller 1 [AHCI mode] | 4 | 2.41% |
| 8 Series SATA Controller 1 [AHCI mode] | 4 | 2.41% |
| 5 Series/3400 Series Chipset 6 port SATA AHCI Controller | 4 | 2.41% |
| SB7x0/SB8x0/SB9x0 SATA Controller [IDE mode] | 3 | 1.81% |
| SB7x0/SB8x0/SB9x0 SATA Controller [AHCI mode] | 3 | 1.81% |
| SB7x0/SB8x0/SB9x0 IDE Controller | 3 | 1.81% |
| E12 NVMe Controller | 3 | 1.81% |
| Wildcat Point-LP SATA Controller [AHCI Mode] | 2 | 1.2% |
| VT82C586A/B/VT82C686/A/B/VT823x/A/C PIPC Bus Master IDE | 2 | 1.2% |
| VIA VT6420 SATA RAID Controller | 2 | 1.2% |
| SATA controller | 2 | 1.2% |
| NVMe SSD Controller SM981/PM981/PM983 | 2 | 1.2% |
| MCP61 SATA Controller | 2 | 1.2% |
| Celeron N3350/Pentium N4200/Atom E3900 Series SATA AHCI Controller | 2 | 1.2% |
| Atom Processor E3800 Series SATA AHCI Controller | 2 | 1.2% |
| 82801FBM (ICH6M) SATA Controller | 2 | 1.2% |
| 82801EB/ER (ICH5/ICH5R) IDE Controller | 2 | 1.2% |
| 6 Series/C200 Series Chipset Family 6 port Desktop SATA AHCI Controller | 2 | 1.2% |
| 5 Series/3400 Series Chipset 4 port SATA AHCI Controller | 2 | 1.2% |
| XG4 NVMe SSD Controller | 1 | 0.6% |
| US15W/US15X/US15L/UL11L SCH [Poulsbo] IDE Controller | 1 | 0.6% |
| RS690 PCI to PCI Bridge (PCI Express Port 2) | 1 | 0.6% |
| Q170/Q150/B150/H170/H110/Z170/CM236 Chipset SATA Controller [AHCI Mode] | 1 | 0.6% |
| P1 NVMe PCIe SSD | 1 | 0.6% |
| Non-Volatile memory controller | 1 | 0.6% |
| NM10/ICH7 Family SATA Controller [AHCI mode] | 1 | 0.6% |
| nForce2 IDE | 1 | 0.6% |
| Mobile PM965/GM965 PT IDER Controller | 1 | 0.6% |
| MCP78S [GeForce 8200] SATA Controller (non-AHCI mode) | 1 | 0.6% |
| MCP78S [GeForce 8200] IDE | 1 | 0.6% |
| MCP73 SATA Controller (IDE mode) | 1 | 0.6% |
| MCP73 IDE Controller | 1 | 0.6% |
| MCP67 IDE Controller | 1 | 0.6% |
| MCP67 AHCI Controller | 1 | 0.6% |
| MCP61 IDE | 1 | 0.6% |
| MCP55 SATA Controller | 1 | 0.6% |
| MCP55 IDE | 1 | 0.6% |
| MCP51 Serial ATA Controller | 1 | 0.6% |
| MCP51 IDE | 1 | 0.6% |
| M6e PCI Express SSD [Marvell 88SS9183] | 1 | 0.6% |
| JMB368 IDE controller | 1 | 0.6% |
| JMB363 SATA/IDE Controller | 1 | 0.6% |
| IXP SB4x0 IDE Controller | 1 | 0.6% |
| FCH SATA Controller [IDE mode] | 1 | 0.6% |
| FCH SATA Controller D | 1 | 0.6% |
| FCH RAID Controller | 1 | 0.6% |
| CK804 Serial ATA Controller | 1 | 0.6% |
| CK804 IDE | 1 | 0.6% |
| Cannon Lake PCH SATA AHCI Controller | 1 | 0.6% |
Storage Kind
Kind of storage controller (IDE, SATA, NVMe, SAS, ...)


| Kind | Computers | Percent |
|---|---|---|
| SATA | 81 | 58.27% |
| IDE | 41 | 29.5% |
| NVMe | 9 | 6.47% |
| RAID | 8 | 5.76% |
CPU Vendor
Processor vendors


| Vendor | Computers | Percent |
|---|---|---|
| Intel | 93 | 75.61% |
| AMD | 30 | 24.39% |
CPU Model
Processor models


| Model | Computers | Percent |
|---|---|---|
| Intel Core i7-7700HQ CPU @ 2.80GHz | 3 | 2.44% |
| Intel Core i5-8250U CPU @ 1.60GHz | 2 | 1.63% |
| Intel Core i5-7200U CPU @ 2.50GHz | 2 | 1.63% |
| Intel Core i5 CPU M 520 @ 2.40GHz | 2 | 1.63% |
| Intel Core i3-2310M CPU @ 2.10GHz | 2 | 1.63% |
| Intel Celeron N4000 CPU @ 1.10GHz | 2 | 1.63% |
| AMD Sempron SI-42 | 2 | 1.63% |
| Intel Xeon W-2140B CPU @ 3.20GHz | 1 | 0.81% |
| Intel Pentium M processor 1.86GHz | 1 | 0.81% |
| Intel Pentium M processor 1.60GHz | 1 | 0.81% |
| Intel Pentium Dual-Core CPU T4500 @ 2.30GHz | 1 | 0.81% |
| Intel Pentium Dual-Core CPU T4400 @ 2.20GHz | 1 | 0.81% |
| Intel Pentium Dual-Core CPU T4300 @ 2.10GHz | 1 | 0.81% |
| Intel Pentium Dual-Core CPU E6700 @ 3.20GHz | 1 | 0.81% |
| Intel Pentium Dual-Core CPU E5700 @ 3.00GHz | 1 | 0.81% |
| Intel Pentium Dual-Core CPU E5300 @ 2.60GHz | 1 | 0.81% |
| Intel Pentium Dual CPU T2310 @ 1.46GHz | 1 | 0.81% |
| Intel Pentium CPU N4200 @ 1.10GHz | 1 | 0.81% |
| Intel Pentium CPU N3700 @ 1.60GHz | 1 | 0.81% |
| Intel Pentium CPU N3520 @ 2.16GHz | 1 | 0.81% |
| Intel Pentium CPU B960 @ 2.20GHz | 1 | 0.81% |
| Intel Pentium CPU B950 @ 2.10GHz | 1 | 0.81% |
| Intel Genuine CPU T2050 @ 1.60GHz | 1 | 0.81% |
| Intel Core i7-8750H CPU @ 2.20GHz | 1 | 0.81% |
| Intel Core i7-8550U CPU @ 1.80GHz | 1 | 0.81% |
| Intel Core i7-7500U CPU @ 2.70GHz | 1 | 0.81% |
| Intel Core i7-6700K CPU @ 4.00GHz | 1 | 0.81% |
| Intel Core i7-6700HQ CPU @ 2.60GHz | 1 | 0.81% |
| Intel Core i7-5500U CPU @ 2.40GHz | 1 | 0.81% |
| Intel Core i7-4790 CPU @ 3.60GHz | 1 | 0.81% |
| Intel Core i7-4710HQ CPU @ 2.50GHz | 1 | 0.81% |
| Intel Core i7-4702MQ CPU @ 2.20GHz | 1 | 0.81% |
| Intel Core i7-4700HQ CPU @ 2.40GHz | 1 | 0.81% |
| Intel Core i7-4600U CPU @ 2.10GHz | 1 | 0.81% |
| Intel Core i7-3610QM CPU @ 2.30GHz | 1 | 0.81% |
| Intel Core i7-3537U CPU @ 2.00GHz | 1 | 0.81% |
| Intel Core i7-2600 CPU @ 3.40GHz | 1 | 0.81% |
| Intel Core i7 CPU M 620 @ 2.67GHz | 1 | 0.81% |
| Intel Core i5-9400 CPU @ 2.90GHz | 1 | 0.81% |
| Intel Core i5-9300H CPU @ 2.40GHz | 1 | 0.81% |
| Intel Core i5-8350U CPU @ 1.70GHz | 1 | 0.81% |
| Intel Core i5-8265U CPU @ 1.60GHz | 1 | 0.81% |
| Intel Core i5-5300U CPU @ 2.30GHz | 1 | 0.81% |
| Intel Core i5-4590 CPU @ 3.30GHz | 1 | 0.81% |
| Intel Core i5-4260U CPU @ 1.40GHz | 1 | 0.81% |
| Intel Core i5-4210U CPU @ 1.70GHz | 1 | 0.81% |
| Intel Core i5-4200U CPU @ 1.60GHz | 1 | 0.81% |
| Intel Core i5-3570K CPU @ 3.40GHz | 1 | 0.81% |
| Intel Core i5-3320M CPU @ 2.60GHz | 1 | 0.81% |
| Intel Core i5-3317U CPU @ 1.70GHz | 1 | 0.81% |
| Intel Core i5-3210M CPU @ 2.50GHz | 1 | 0.81% |
| Intel Core i5-2450M CPU @ 2.50GHz | 1 | 0.81% |
| Intel Core i5-2430M CPU @ 2.40GHz | 1 | 0.81% |
| Intel Core i5-2320 CPU @ 3.00GHz | 1 | 0.81% |
| Intel Core i5 CPU M 460 @ 2.53GHz | 1 | 0.81% |
| Intel Core i3-7020U CPU @ 2.30GHz | 1 | 0.81% |
| Intel Core i3-4030U CPU @ 1.90GHz | 1 | 0.81% |
| Intel Core i3-3220 CPU @ 3.30GHz | 1 | 0.81% |
| Intel Core i3 CPU M 380 @ 2.53GHz | 1 | 0.81% |
| Intel Core i3 CPU 550 @ 3.20GHz | 1 | 0.81% |
CPU Model Family
Processor model prefix


| Model | Computers | Percent |
|---|---|---|
| Intel Core i5 | 23 | 18.7% |
| Intel Core i7 | 18 | 14.63% |
| Intel Core 2 Duo | 11 | 8.94% |
| Intel Celeron | 9 | 7.32% |
| Intel Core i3 | 7 | 5.69% |
| Intel Pentium Dual-Core | 6 | 4.88% |
| Intel Pentium | 5 | 4.07% |
| Intel Atom | 4 | 3.25% |
| AMD Sempron | 3 | 2.44% |
| AMD Ryzen 5 | 3 | 2.44% |
| AMD A4 | 3 | 2.44% |
| Intel Pentium M | 2 | 1.63% |
| Intel Core 2 Quad | 2 | 1.63% |
| Intel Core 2 | 2 | 1.63% |
| AMD Turion 64 X2 Mobile | 2 | 1.63% |
| AMD Ryzen 7 | 2 | 1.63% |
| AMD Ryzen 3 | 2 | 1.63% |
| AMD Athlon 64 X2 | 2 | 1.63% |
| AMD A6 | 2 | 1.63% |
| Intel Xeon | 1 | 0.81% |
| Intel Pentium Dual | 1 | 0.81% |
| Intel Genuine | 1 | 0.81% |
| Intel Core 2 Extreme | 1 | 0.81% |
| AMD Turion II | 1 | 0.81% |
| AMD Turion 64 Mobile | 1 | 0.81% |
| AMD Phenom II X2 | 1 | 0.81% |
| AMD Phenom II | 1 | 0.81% |
| AMD FX | 1 | 0.81% |
| AMD Dual Core Opteron | 1 | 0.81% |
| AMD Athlon XP | 1 | 0.81% |
| AMD Athlon X2 | 1 | 0.81% |
| AMD Athlon II X2 | 1 | 0.81% |
| AMD Athlon 64 | 1 | 0.81% |
| AMD A8 | 1 | 0.81% |
CPU Cores
Number of processor cores


| Number | Computers | Percent |
|---|---|---|
| 2 | 69 | 56.1% |
| 4 | 30 | 24.39% |
| 1 | 15 | 12.2% |
| 6 | 5 | 4.07% |
| 8 | 3 | 2.44% |
| 3 | 1 | 0.81% |
CPU Sockets
Number of sockets


| Number | Computers | Percent |
|---|---|---|
| 1 | 123 | 100% |
CPU Threads
Threads per core (Hyper-Threading)


| Number | Computers | Percent |
|---|---|---|
| 1 | 65 | 52.85% |
| 2 | 58 | 47.15% |
CPU Op-Modes
CPU Operation Modes (32-bit, 64-bit)


| Op mode | Computers | Percent |
|---|---|---|
| 32-bit, 64-bit | 117 | 95.12% |
| 32-bit | 6 | 4.88% |
CPU Microarch
Microarchitecture


| Name | Computers | Percent |
|---|---|---|
| Core | 22 | 17.89% |
| Skylake | 17 | 13.82% |
| Haswell | 10 | 8.13% |
| SandyBridge | 8 | 6.5% |
| K8 Hammer | 8 | 6.5% |
| Westmere | 7 | 5.69% |
| IvyBridge | 7 | 5.69% |
| Silvermont | 6 | 4.88% |
| K10 | 4 | 3.25% |
| Zen | 3 | 2.44% |
| Piledriver | 3 | 2.44% |
| P6 | 3 | 2.44% |
| K8 & K10 hybrid | 3 | 2.44% |
| Bonnell | 3 | 2.44% |
| Zen+ | 2 | 1.63% |
| Zen 2 | 2 | 1.63% |
| Penryn | 2 | 1.63% |
| Goldmont plus | 2 | 1.63% |
| Goldmont | 2 | 1.63% |
| Broadwell | 2 | 1.63% |
| Puma | 1 | 0.81% |
| NetBurst | 1 | 0.81% |
| KabyLake | 1 | 0.81% |
| K6 | 1 | 0.81% |
| K10 Llano | 1 | 0.81% |
| Jaguar | 1 | 0.81% |
| Bulldozer | 1 | 0.81% |
CPU Microcode
Microcode number


| Number | Computers | Percent |
|---|---|---|
| Unknown | 19 | 15.45% |
| 0x1067a | 10 | 8.13% |
| 0x206a7 | 8 | 6.5% |
| 0x306a9 | 7 | 5.69% |
| 0x806ea | 5 | 4.07% |
| 0x20655 | 5 | 4.07% |
| 0x40651 | 4 | 3.25% |
| 0x306c3 | 4 | 3.25% |
| 0x010000c8 | 4 | 3.25% |
| 0x906ea | 3 | 2.44% |
| 0x906e9 | 3 | 2.44% |
| 0x6fd | 3 | 2.44% |
| 0x02000057 | 3 | 2.44% |
| 0x806e9 | 2 | 1.63% |
| 0x706a1 | 2 | 1.63% |
| 0x6fb | 2 | 1.63% |
| 0x6f6 | 2 | 1.63% |
| 0x6d8 | 2 | 1.63% |
| 0x506e3 | 2 | 1.63% |
| 0x506c9 | 2 | 1.63% |
| 0x306d4 | 2 | 1.63% |
| 0x30678 | 2 | 1.63% |
| 0x30673 | 2 | 1.63% |
| 0x106ca | 2 | 1.63% |
| 0x10676 | 2 | 1.63% |
| 0x0810100b | 2 | 1.63% |
| 0x06001119 | 2 | 1.63% |
| 0xf29 | 1 | 0.81% |
| 0x806ec | 1 | 0.81% |
| 0x6e8 | 1 | 0.81% |
| 0x50654 | 1 | 0.81% |
| 0x406c3 | 1 | 0.81% |
| 0x20652 | 1 | 0.81% |
| 0x106c2 | 1 | 0.81% |
| 0x10677 | 1 | 0.81% |
| 0x10661 | 1 | 0.81% |
| 0x08701013 | 1 | 0.81% |
| 0x0800820d | 1 | 0.81% |
| 0x0800820c | 1 | 0.81% |
| 0x08001126 | 1 | 0.81% |
| 0x07030106 | 1 | 0.81% |
| 0x0700010f | 1 | 0.81% |
| 0x0600063e | 1 | 0.81% |
| 0x03000027 | 1 | 0.81% |
GPU Vendor
Vendors of graphics cards


| Vendor | Computers | Percent |
|---|---|---|
| Intel | 72 | 50.7% |
| Nvidia | 38 | 26.76% |
| AMD | 32 | 22.54% |
GPU Model
Graphics card models


| Model | Computers | Percent |
|---|---|---|
| Core Processor Integrated Graphics Controller | 7 | 4.64% |
| Mobile 4 Series Chipset Integrated Graphics Controller | 6 | 3.97% |
| Haswell-ULT Integrated Graphics Controller | 5 | 3.31% |
| 3rd Gen Core processor Graphics Controller | 5 | 3.31% |
| 2nd Generation Core Processor Family Integrated Graphics Controller | 5 | 3.31% |
| UHD Graphics 620 | 4 | 2.65% |
| HD Graphics 620 | 4 | 2.65% |
| Ellesmere [Radeon RX 470/480/570/570X/580/580X/590] | 4 | 2.65% |
| Atom Processor Z36xxx/Z37xxx Series Graphics & Display | 4 | 2.65% |
| Mobile GM965/GL960 Integrated Graphics Controller (secondary) | 3 | 1.99% |
| Mobile GM965/GL960 Integrated Graphics Controller (primary) | 3 | 1.99% |
| HD Graphics 630 | 3 | 1.99% |
| 4th Gen Core Processor Integrated Graphics Controller | 3 | 1.99% |
| UHD Graphics 630 (Mobile) | 2 | 1.32% |
| UHD Graphics 605 | 2 | 1.32% |
| Sun XT [Radeon HD 8670A/8670M/8690M / R5 M330 / M430 / Radeon 520 Mobile] | 2 | 1.32% |
| RV410/M26 [Mobility Radeon X700] | 2 | 1.32% |
| Raven Ridge [Radeon Vega Series / Radeon Vega Mobile Series] | 2 | 1.32% |
| Park [Mobility Radeon HD 5430/5450/5470] | 2 | 1.32% |
| Mobile 945GM/GMS/GME, 943/940GML Express Integrated Graphics Controller | 2 | 1.32% |
| Mobile 945GM/GMS, 943/940GML Express Integrated Graphics Controller | 2 | 1.32% |
| HD Graphics 5500 | 2 | 1.32% |
| GP107M [GeForce GTX 1050 Ti Mobile] | 2 | 1.32% |
| GP107M [GeForce GTX 1050 Mobile] | 2 | 1.32% |
| Atom/Celeron/Pentium Processor x5-E8000/J3xxx/N3xxx Integrated Graphics Controller | 2 | 1.32% |
| Atom Processor D4xx/D5xx/N4xx/N5xx Integrated Graphics Controller | 2 | 1.32% |
| 82865G Integrated Graphics Controller | 2 | 1.32% |
| 4 Series Chipset Integrated Graphics Controller | 2 | 1.32% |
| Xeon E3-1200 v3/4th Gen Core Processor Integrated Graphics Controller | 1 | 0.66% |
| Xeon E3-1200 v2/3rd Gen Core processor Graphics Controller | 1 | 0.66% |
| Whistler [Radeon HD 6630M/6650M/6750M/7670M/7690M] | 1 | 0.66% |
| Vega 10 XL [Radeon Pro Vega 56] | 1 | 0.66% |
| US15W/US15X SCH [Poulsbo] Graphics Controller | 1 | 0.66% |
| UHD Graphics 620 (Whiskey Lake) | 1 | 0.66% |
| TU116 [GeForce GTX 1660] | 1 | 0.66% |
| Trinity 2 [Radeon HD 7420G] | 1 | 0.66% |
| Topaz XT [Radeon R7 M260/M265 / M340/M360 / M440/M445 / 530/535 / 620/625 Mobile] | 1 | 0.66% |
| Thames [Radeon HD 7500M/7600M Series] | 1 | 0.66% |
| Sumo [Radeon HD 6620G] | 1 | 0.66% |
| RV730 [Radeon HD 4600 AGP Series] | 1 | 0.66% |
| RV630/M76 [Mobility Radeon HD 2600] | 1 | 0.66% |
| RV630/M76 [Mobility Radeon HD 2600 XT/2700] | 1 | 0.66% |
| RV515 PRO [Radeon X1300/X1550 Series] (Secondary) | 1 | 0.66% |
| RV515 PRO [Radeon X1300/X1550 Series] | 1 | 0.66% |
| RV370/M22 [Mobility Radeon X300] | 1 | 0.66% |
| RS880M [Mobility Radeon HD 4225/4250] | 1 | 0.66% |
| RS780MC [Mobility Radeon HD 3100] | 1 | 0.66% |
| RS780M [Mobility Radeon HD 3200] | 1 | 0.66% |
| Richland [Radeon HD 8450G] | 1 | 0.66% |
| Opal XT [Radeon R7 M265/M365X/M465] | 1 | 0.66% |
| NV44 [GeForce 7100 GS] | 1 | 0.66% |
| NV41 [GeForce 6800] | 1 | 0.66% |
| NV36 [GeForce FX 5700] | 1 | 0.66% |
| Navi 10 [Radeon RX 5600 OEM/5600 XT / 5700/5700 XT] | 1 | 0.66% |
| Mullins [Radeon R4/R5 Graphics] | 1 | 0.66% |
| Kabini [Radeon HD 8180] | 1 | 0.66% |
| HD Graphics 530 | 1 | 0.66% |
| HD Graphics 500 | 1 | 0.66% |
| GT218M [GeForce 315M] | 1 | 0.66% |
| GT218 [GeForce 210] | 1 | 0.66% |
GPU Combo
Combinations of graphics cards


| Name | Computers | Percent |
|---|---|---|
| 1 x Intel | 53 | 43.09% |
| 1 x AMD | 24 | 19.51% |
| 1 x Nvidia | 23 | 18.7% |
| Intel + Nvidia | 15 | 12.2% |
| 2 x AMD | 4 | 3.25% |
| Intel + AMD | 4 | 3.25% |
GPU Driver
Free vs proprietary


| Driver | Computers | Percent |
|---|---|---|
| Free | 95 | 77.24% |
| Proprietary | 18 | 14.63% |
| Unknown | 10 | 8.13% |
GPU Memory
Total video memory


| Size in GB | Computers | Percent |
|---|---|---|
| Unknown | 62 | 50.41% |
| 0.01-0.5 | 21 | 17.07% |
| 1.01-2.0 | 14 | 11.38% |
| 3.01-4.0 | 10 | 8.13% |
| 0.51-1.0 | 9 | 7.32% |
| 7.01-8.0 | 4 | 3.25% |
| 5.01-6.0 | 2 | 1.63% |
| 2.01-3.0 | 1 | 0.81% |
Monitor Vendor
Monitor vendors


| Vendor | Computers | Percent |
|---|---|---|
| Samsung Electronics | 19 | 16.52% |
| AU Optronics | 14 | 12.17% |
| LG Display | 13 | 11.3% |
| Chimei Innolux | 11 | 9.57% |
| LG Philips | 5 | 4.35% |
| Chi Mei Optoelectronics | 5 | 4.35% |
| Lenovo | 4 | 3.48% |
| Apple | 4 | 3.48% |
| Hewlett-Packard | 3 | 2.61% |
| Goldstar | 3 | 2.61% |
| Dell | 3 | 2.61% |
| BOE | 3 | 2.61% |
| BenQ | 3 | 2.61% |
| Ancor Communications | 3 | 2.61% |
| SAC | 2 | 1.74% |
| Xiaomi | 1 | 0.87% |
| VIZ | 1 | 0.87% |
| ViewSonic | 1 | 0.87% |
| Unknown | 1 | 0.87% |
| Sharp | 1 | 0.87% |
| Sceptre Tech | 1 | 0.87% |
| Sanyo | 1 | 0.87% |
| Philips | 1 | 0.87% |
| PANDA | 1 | 0.87% |
| NUL | 1 | 0.87% |
| LSC | 1 | 0.87% |
| KTC | 1 | 0.87% |
| KLF | 1 | 0.87% |
| InfoVision | 1 | 0.87% |
| HannStar | 1 | 0.87% |
| Grundig | 1 | 0.87% |
| Eizo | 1 | 0.87% |
| CVT | 1 | 0.87% |
| CPT | 1 | 0.87% |
| AOC | 1 | 0.87% |
Monitor Model
Monitor models


| Model | Computers | Percent |
|---|---|---|
| LCD Monitor AUO38ED 1920x1080 340x190mm 15.3-inch | 3 | 2.59% |
| LED MONITOR SAC309A 1920x1080 443x249mm 20.0-inch | 2 | 1.72% |
| LCD Monitor SEC5541 1366x768 344x193mm 15.5-inch | 2 | 1.72% |
| W55 SPT15B9 3840x2160 575x323mm 26.0-inch | 1 | 0.86% |
| W1934 GSM4B7A 1440x900 410x260mm 19.1-inch | 1 | 0.86% |
| vs17 HWP2647 1280x1024 340x270mm 17.1-inch | 1 | 0.86% |
| TV SAN0105 1360x768 886x498mm 40.0-inch | 1 | 0.86% |
| SyncMaster SAM0598 1360x768 410x230mm 18.5-inch | 1 | 0.86% |
| SyncMaster SAM041F 2048x1152 510x287mm 23.0-inch | 1 | 0.86% |
| SyncMaster SAM027C 1680x1050 433x271mm 20.1-inch | 1 | 0.86% |
| O-7005L-D KTC1771 1280x1024 338x270mm 17.0-inch | 1 | 0.86% |
| Mi TV XMD00E1 3840x2160 708x398mm 32.0-inch | 1 | 0.86% |
| LP156WH1-TLA1 LGD6301 1366x768 344x194mm 15.5-inch | 1 | 0.86% |
| LP154WX4-TLC8 LPL0120 1280x800 331x207mm 15.4-inch | 1 | 0.86% |
| LCD Monitor VA2259 Series 1920x1080 | 1 | 0.86% |
| LCD Monitor U2212HM 3840x1080 | 1 | 0.86% |
| LCD Monitor SHP1453 1920x1080 346x194mm 15.6-inch | 1 | 0.86% |
| LCD Monitor SEC5742 1366x768 309x174mm 14.0-inch | 1 | 0.86% |
| LCD Monitor SEC4351 1366x768 344x194mm 15.5-inch | 1 | 0.86% |
| LCD Monitor SEC4241 1280x800 261x163mm 12.1-inch | 1 | 0.86% |
| LCD Monitor SEC3633 1280x800 331x207mm 15.4-inch | 1 | 0.86% |
| LCD Monitor SEC3551 1366x768 344x194mm 15.5-inch | 1 | 0.86% |
| LCD Monitor SEC324C 1366x768 353x198mm 15.9-inch | 1 | 0.86% |
| LCD Monitor SEC324A 1366x768 344x194mm 15.5-inch | 1 | 0.86% |
| LCD Monitor SEC3245 1366x768 344x194mm 15.5-inch | 1 | 0.86% |
| LCD Monitor SDC4D42 1366x768 309x174mm 14.0-inch | 1 | 0.86% |
| LCD Monitor SDC4752 1366x768 340x190mm 15.3-inch | 1 | 0.86% |
| LCD Monitor SAMSUNG 3840x2160 | 1 | 0.86% |
| LCD Monitor SAM0F14 3840x2160 1872x1053mm 84.6-inch | 1 | 0.86% |
| LCD Monitor SAM07BC 1360x768 | 1 | 0.86% |
| LCD Monitor SAM0663 1280x720 | 1 | 0.86% |
| LCD Monitor NCP000D 1920x1080 344x194mm 15.5-inch | 1 | 0.86% |
| LCD Monitor MX279 1920x1080 | 1 | 0.86% |
| LCD Monitor LPLC500 1280x800 331x207mm 15.4-inch | 1 | 0.86% |
| LCD Monitor LPLBC00 1280x800 331x207mm 15.4-inch | 1 | 0.86% |
| LCD Monitor LPL0A01 1440x900 367x230mm 17.1-inch | 1 | 0.86% |
| LCD Monitor LPL0601 1280x800 331x207mm 15.4-inch | 1 | 0.86% |
| LCD Monitor LGD0497 1366x768 256x144mm 11.6-inch | 1 | 0.86% |
| LCD Monitor LGD046F 1920x1080 344x194mm 15.5-inch | 1 | 0.86% |
| LCD Monitor LGD046A 1366x768 344x194mm 15.5-inch | 1 | 0.86% |
| LCD Monitor LGD0469 1920x1080 382x215mm 17.3-inch | 1 | 0.86% |
| LCD Monitor LGD0438 1366x768 340x190mm 15.3-inch | 1 | 0.86% |
| LCD Monitor LGD03F8 1366x768 345x194mm 15.6-inch | 1 | 0.86% |
| LCD Monitor LGD03D3 1600x900 309x174mm 14.0-inch | 1 | 0.86% |
| LCD Monitor LGD0384 1366x768 344x194mm 15.5-inch | 1 | 0.86% |
| LCD Monitor LGD033C 1366x768 309x174mm 14.0-inch | 1 | 0.86% |
| LCD Monitor LGD02DC 1366x768 344x194mm 15.5-inch | 1 | 0.86% |
| LCD Monitor LGD027A 1600x900 380x210mm 17.1-inch | 1 | 0.86% |
| LCD Monitor LGD01DA 1366x768 294x166mm 13.3-inch | 1 | 0.86% |
| LCD Monitor LEN40B1 1600x900 344x194mm 15.5-inch | 1 | 0.86% |
| LCD Monitor LEN40B0 1366x768 344x194mm 15.5-inch | 1 | 0.86% |
| LCD Monitor LEN40A0 1366x768 309x174mm 14.0-inch | 1 | 0.86% |
| LCD Monitor LEN4035 1280x800 304x190mm 14.1-inch | 1 | 0.86% |
| LCD Monitor IVO8C66 1920x1080 309x174mm 14.0-inch | 1 | 0.86% |
| LCD Monitor HSD03E9 1024x600 220x129mm 10.0-inch | 1 | 0.86% |
| LCD Monitor G2410HD 1920x1080 | 1 | 0.86% |
| LCD Monitor F22 | 1 | 0.86% |
| LCD Monitor E320VT 1920x1080 | 1 | 0.86% |
| LCD Monitor CPT141F 1280x800 331x207mm 15.4-inch | 1 | 0.86% |
| LCD Monitor CMO1720 1920x1080 382x215mm 17.3-inch | 1 | 0.86% |
Monitor Resolution
Monitor screen resolution


| Resolution | Computers | Percent |
|---|---|---|
| 1920x1080 (FHD) | 35 | 30.43% |
| 1366x768 (WXGA) | 34 | 29.57% |
| 1280x800 (WXGA) | 14 | 12.17% |
| 3840x2160 (4K) | 6 | 5.22% |
| 1600x900 (HD+) | 6 | 5.22% |
| 1440x900 (WXGA+) | 4 | 3.48% |
| 1280x1024 (SXGA) | 3 | 2.61% |
| 1680x1050 (WSXGA+) | 2 | 1.74% |
| 1360x768 | 2 | 1.74% |
| 1024x600 | 2 | 1.74% |
| 3840x1080 | 1 | 0.87% |
| 2048x1152 | 1 | 0.87% |
| 1920x1200 (WUXGA) | 1 | 0.87% |
| 1600x1200 | 1 | 0.87% |
| 1360x765 | 1 | 0.87% |
| 1280x720 (HD) | 1 | 0.87% |
| Unknown | 1 | 0.87% |
Monitor Diagonal
Diagonal size in inches


| Inches | Computers | Percent |
|---|---|---|
| 15 | 39 | 33.91% |
| Unknown | 10 | 8.7% |
| 17 | 9 | 7.83% |
| 14 | 9 | 7.83% |
| 13 | 7 | 6.09% |
| 24 | 5 | 4.35% |
| 11 | 5 | 4.35% |
| 21 | 4 | 3.48% |
| 20 | 4 | 3.48% |
| 10 | 4 | 3.48% |
| 23 | 3 | 2.61% |
| 84 | 2 | 1.74% |
| 26 | 2 | 1.74% |
| 19 | 2 | 1.74% |
| 18 | 2 | 1.74% |
| 12 | 2 | 1.74% |
| 72 | 1 | 0.87% |
| 44 | 1 | 0.87% |
| 40 | 1 | 0.87% |
| 32 | 1 | 0.87% |
| 27 | 1 | 0.87% |
| 22 | 1 | 0.87% |
Monitor Width
Physical width


| Width in mm | Computers | Percent |
|---|---|---|
| 301-350 | 55 | 47.83% |
| 201-300 | 14 | 12.17% |
| 401-500 | 13 | 11.3% |
| 501-600 | 11 | 9.57% |
| Unknown | 10 | 8.7% |
| 351-400 | 6 | 5.22% |
| 1501-2000 | 3 | 2.61% |
| 801-900 | 1 | 0.87% |
| 701-800 | 1 | 0.87% |
| 901-1000 | 1 | 0.87% |
Aspect Ratio
Proportional relationship between the width and the height


| Ratio | Computers | Percent |
|---|---|---|
| 16/9 | 74 | 70.48% |
| 16/10 | 20 | 19.05% |
| Unknown | 8 | 7.62% |
| 5/4 | 3 | 2.86% |
Monitor Area
Area in inch²


| Area in inch² | Computers | Percent |
|---|---|---|
| 101-110 | 38 | 33.04% |
| 81-90 | 13 | 11.3% |
| 151-200 | 10 | 8.7% |
| Unknown | 10 | 8.7% |
| 201-250 | 8 | 6.96% |
| 51-60 | 5 | 4.35% |
| 121-130 | 5 | 4.35% |
| 41-50 | 4 | 3.48% |
| 251-300 | 4 | 3.48% |
| 141-150 | 4 | 3.48% |
| More than 1000 | 3 | 2.61% |
| 71-80 | 3 | 2.61% |
| 61-70 | 2 | 1.74% |
| 501-1000 | 2 | 1.74% |
| 351-500 | 1 | 0.87% |
| 301-350 | 1 | 0.87% |
| 131-140 | 1 | 0.87% |
| 91-100 | 1 | 0.87% |
Pixel Density
Pixels per inch


| Density | Computers | Percent |
|---|---|---|
| 101-120 | 39 | 35.45% |
| 121-160 | 28 | 25.45% |
| 51-100 | 27 | 24.55% |
| Unknown | 10 | 9.09% |
| 1-50 | 3 | 2.73% |
| 161-240 | 3 | 2.73% |
Multiple Monitors
Total monitors connected

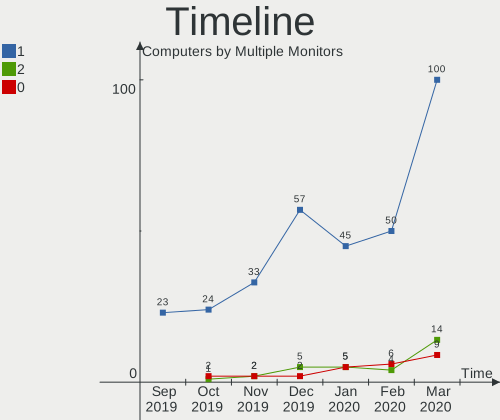
| Total | Computers | Percent |
|---|---|---|
| 1 | 100 | 81.3% |
| 2 | 14 | 11.38% |
| 0 | 9 | 7.32% |
Net Controller Vendor
Controller vendors


| Vendor | Computers | Percent |
|---|---|---|
| Intel | 16 | 47.06% |
| Nvidia | 5 | 14.71% |
| Broadcom Inc. and subsidiaries | 3 | 8.82% |
| Realtek Semiconductor | 2 | 5.88% |
| VIA Technologies | 1 | 2.94% |
| Samsung Electronics | 1 | 2.94% |
| NetGear | 1 | 2.94% |
| Microchip Technology | 1 | 2.94% |
| MediaTek | 1 | 2.94% |
| Huawei Technologies | 1 | 2.94% |
| Broadcom Limited | 1 | 2.94% |
| AMD | 1 | 2.94% |
Net Controller Model
Controller models


| Model | Computers | Percent |
|---|---|---|
| BCM4401-B0 100Base-TX | 3 | 7.69% |
| Wi-Fi 6 AX200 | 2 | 5.13% |
| MCP61 Ethernet | 2 | 5.13% |
| I211 Gigabit Network Connection | 2 | 5.13% |
| Centrino Advanced-N 6200 | 2 | 5.13% |
| 82801FB/FBM/FR/FW/FRW (ICH6 Family) AC'97 Modem Controller | 2 | 5.13% |
| 82579LM Gigabit Network Connection (Lewisville) | 2 | 5.13% |
| 82577LM Gigabit Network Connection | 2 | 5.13% |
| 82567LM Gigabit Network Connection | 2 | 5.13% |
| Wireless 8265 / 8275 | 1 | 2.56% |
| VT6102/VT6103 [Rhine-II] | 1 | 2.56% |
| RTL8723BU 802.11n WLAN Adapter | 1 | 2.56% |
| RTL8111/8168/8411 PCI Express Gigabit Ethernet Controller | 1 | 2.56% |
| Power Ice Evo | 1 | 2.56% |
| MCP55 Ethernet | 1 | 2.56% |
| MCP51 Ethernet Controller | 1 | 2.56% |
| MCP2200 USB Serial Port Emulator | 1 | 2.56% |
| IXP SB400 AC'97 Modem Controller | 1 | 2.56% |
| GT-I9500 [Galaxy S4] / GT-I9250 [Galaxy Nexus] (network tethering) | 1 | 2.56% |
| DLI-TL20 | 1 | 2.56% |
| CK804 Ethernet Controller | 1 | 2.56% |
| Centrino Ultimate-N 6300 | 1 | 2.56% |
| Centrino Advanced-N 6235 | 1 | 2.56% |
| Centrino Advanced-N 6205 [Taylor Peak] | 1 | 2.56% |
| BCM4331 802.11a/b/g/n | 1 | 2.56% |
| A6210 | 1 | 2.56% |
| 82577LC Gigabit Network Connection | 1 | 2.56% |
| 82567LF Gigabit Network Connection | 1 | 2.56% |
| 82566MM Gigabit Network Connection | 1 | 2.56% |
Net Controller Kind
Ethernet, WiFi or modem


| Kind | Computers | Percent |
|---|---|---|
| Ethernet | 23 | 60.53% |
| WiFi | 11 | 28.95% |
| Modem | 4 | 10.53% |
Used Controller
Currently used network controller


| Kind | Computers | Percent |
|---|---|---|
| Ethernet | 10 | 62.5% |
| WiFi | 6 | 37.5% |
NICs
Total network controllers on board


| Total | Computers | Percent |
|---|---|---|
| 2 | 85 | 69.11% |
| 1 | 38 | 30.89% |
Unsupported Devices
Total unsupported devices on board


| Total | Computers | Percent |
|---|---|---|
| 0 | 80 | 65.04% |
| 1 | 38 | 30.89% |
| 2 | 5 | 4.07% |
Unsupported Device Types
Types of unsupported devices


| Type | Computers | Percent |
|---|---|---|
| Graphics card | 14 | 29.79% |
| Fingerprint reader | 11 | 23.4% |
| Net/wireless | 9 | 19.15% |
| Chipcard | 4 | 8.51% |
| Sound | 2 | 4.26% |
| Multimedia controller | 2 | 4.26% |
| Modem | 2 | 4.26% |
| Bluetooth | 2 | 4.26% |
| Storage/nvme | 1 | 2.13% |