Manjaro Hardware Trends
A project to identify most popular hardware characteristics and track their change over time based on data collected by Manjaro users at https://Linux-Hardware.org.
Anyone can contribute to the study by uploading probes of their computers by the hw-probe tool:
sudo hw-probe -all -uploadThis is a report for all computer types. See also reports for desktops and notebooks.
Full-feature report is available here: https://linux-hardware.org/?view=trends
Period: Mar, 2020.
Contents
- OS
- OS Family
- Kernel
- Kernel Family
- Kernel Major Ver.
- Arch
- DE
- Display Server
- OS Lang
- Boot Mode
- Filesystem
- Dual Boot with Linux
- Dual Boot (Win)
- Country
- City
- Vendor
- Model
- Model Family
- MFG Year
- Form Factor
- Secure Boot
- Coreboot
- RAM Size
- RAM Used
- Drive Vendor
- Drive Model
- Drive Kind
- Drive Connector
- Drive Size
- Space Total
- Space Used
- Malfunc. Drives
- Malfunc. Drive Vendor
- Malfunc. Drive Kind
- Failed Drives
- Failed Drive Vendor
- Drive Status
- Storage Vendor
- Storage Model
- Storage Kind
- CPU Vendor
- CPU Model
- CPU Model Family
- CPU Cores
- CPU Sockets
- CPU Threads
- CPU Op-Modes
- CPU Microarch
- CPU Microcode
- GPU Vendor
- GPU Model
- GPU Combo
- GPU Driver
- GPU Memory
- Monitor Vendor
- Monitor Model
- Monitor Resolution
- Monitor Diagonal
- Monitor Width
- Aspect Ratio
- Monitor Area
- Pixel Density
- Multiple Monitors
- Net Controller Vendor
- Net Controller Model
- Net Controller Kind
- Used Controller
- NICs
- Unsupported Devices
- Unsupported Device Types
OS
Installed operating systems


| Name | Computers | Percent |
|---|---|---|
| Manjaro 19.0.2 | 56 | 45.53% |
| Manjaro | 55 | 44.72% |
| Manjaro 19.0.1 | 10 | 8.13% |
| Manjaro 19.0 | 1 | 0.81% |
| Manjaro 18.1.5 | 1 | 0.81% |
OS Family
OS without a version


| Name | Computers | Percent |
|---|---|---|
| Manjaro | 123 | 100% |
Kernel
Version of the Linux kernel


| Version | Computers | Percent |
|---|---|---|
| 5.4.23-1-MANJARO | 21 | 17.07% |
| 5.5.8-1-MANJARO | 15 | 12.2% |
| 5.4.24-1-MANJARO | 12 | 9.76% |
| 5.4.22-1-MANJARO | 12 | 9.76% |
| 5.5.7-1-MANJARO | 9 | 7.32% |
| 5.5.13-1-MANJARO | 8 | 6.5% |
| 5.4.27-1-MANJARO | 8 | 6.5% |
| 5.6.0-2-MANJARO | 7 | 5.69% |
| 5.5.6-1-MANJARO | 4 | 3.25% |
| 5.5.11-1-MANJARO | 4 | 3.25% |
| 4.19.108-1-MANJARO | 4 | 3.25% |
| 5.4.28-1-MANJARO | 3 | 2.44% |
| 5.4.18-1-MANJARO | 3 | 2.44% |
| 5.6.0-1-MANJARO | 2 | 1.63% |
| 4.19.107-1-MANJARO | 2 | 1.63% |
| 4.19.106-1-MANJARO | 2 | 1.63% |
| 5.6.0-rc4-1-clear-current | 1 | 0.81% |
| 5.5.3-14-tkg-pds | 1 | 0.81% |
| 5.5.10-1-MANJARO | 1 | 0.81% |
| 5.4.6-2-MANJARO | 1 | 0.81% |
| 5.4.19-rt11-MANJARO | 1 | 0.81% |
| 5.3.18-1-MANJARO | 1 | 0.81% |
| 4.19.112-1-MANJARO | 1 | 0.81% |
Kernel Family
Linux kernel without a distro release


| Version | Computers | Percent |
|---|---|---|
| 5.4.23 | 21 | 17.07% |
| 5.5.8 | 15 | 12.2% |
| 5.4.24 | 12 | 9.76% |
| 5.4.22 | 12 | 9.76% |
| 5.6.0 | 10 | 8.13% |
| 5.5.7 | 9 | 7.32% |
| 5.5.13 | 8 | 6.5% |
| 5.4.27 | 8 | 6.5% |
| 5.5.6 | 4 | 3.25% |
| 5.5.11 | 4 | 3.25% |
| 4.19.108 | 4 | 3.25% |
| 5.4.28 | 3 | 2.44% |
| 5.4.18 | 3 | 2.44% |
| 4.19.107 | 2 | 1.63% |
| 4.19.106 | 2 | 1.63% |
| 5.5.3 | 1 | 0.81% |
| 5.5.10 | 1 | 0.81% |
| 5.4.6 | 1 | 0.81% |
| 5.4.19 | 1 | 0.81% |
| 5.3.18 | 1 | 0.81% |
| 4.19.112 | 1 | 0.81% |
Kernel Major Ver.
Linux kernel major version


| Version | Computers | Percent |
|---|---|---|
| 5.4 | 61 | 49.59% |
| 5.5 | 42 | 34.15% |
| 5.6 | 10 | 8.13% |
| 4.19 | 9 | 7.32% |
| 5.3 | 1 | 0.81% |
Arch
OS architecture (x86_64, i586, etc.)


| Name | Computers | Percent |
|---|---|---|
| x86_64 | 123 | 100% |
DE
Desktop Environment


| Name | Computers | Percent |
|---|---|---|
| XFCE | 39 | 31.71% |
| KDE5 | 23 | 18.7% |
| GNOME | 23 | 18.7% |
| KDE | 16 | 13.01% |
| Unknown | 6 | 4.88% |
| X-Cinnamon | 4 | 3.25% |
| Cinnamon | 3 | 2.44% |
| Budgie | 3 | 2.44% |
| i3 | 2 | 1.63% |
| MATE | 1 | 0.81% |
| i3-with-shmlog | 1 | 0.81% |
| Deepin | 1 | 0.81% |
| Awesome | 1 | 0.81% |
Display Server
X11 or Wayland


| Name | Computers | Percent |
|---|---|---|
| X11 | 115 | 93.5% |
| Wayland | 5 | 4.07% |
| Unknown | 2 | 1.63% |
| Tty | 1 | 0.81% |
OS Lang
Language


| Lang | Computers | Percent |
|---|---|---|
| en_US | 42 | 34.15% |
| en_US.utf8 | 17 | 13.82% |
| ru_RU | 9 | 7.32% |
| de_DE | 6 | 4.88% |
| en_GB.utf8 | 5 | 4.07% |
| en_GB | 5 | 4.07% |
| es_ES | 3 | 2.44% |
| en_CA | 3 | 2.44% |
| en_AU | 3 | 2.44% |
| de_DE.utf8 | 3 | 2.44% |
| sv_SE | 2 | 1.63% |
| ru_RU.utf8 | 2 | 1.63% |
| pt_BR | 2 | 1.63% |
| it_IT | 2 | 1.63% |
| en_CA.utf8 | 2 | 1.63% |
| zh_CN.utf8 | 1 | 0.81% |
| zh_CN | 1 | 0.81% |
| uk_UA | 1 | 0.81% |
| ru_UA | 1 | 0.81% |
| pt_BR.utf8 | 1 | 0.81% |
| pl_PL | 1 | 0.81% |
| it_IT.utf8 | 1 | 0.81% |
| hu_HU.utf8 | 1 | 0.81% |
| fr_FR.utf8 | 1 | 0.81% |
| fr_FR | 1 | 0.81% |
| fi_FI | 1 | 0.81% |
| es_MX | 1 | 0.81% |
| es_ES.utf8 | 1 | 0.81% |
| en_IE | 1 | 0.81% |
| da_DK.utf8 | 1 | 0.81% |
| cs_CZ.utf8 | 1 | 0.81% |
| Unknown | 1 | 0.81% |
Boot Mode
EFI or BIOS


| Mode | Computers | Percent |
|---|---|---|
| BIOS | 66 | 53.66% |
| EFI | 57 | 46.34% |
Filesystem
Type of filesystem


| Type | Computers | Percent |
|---|---|---|
| Ext4 | 105 | 85.37% |
| Btrfs | 8 | 6.5% |
| Overlay | 4 | 3.25% |
| Xfs | 3 | 2.44% |
| Tmpfs | 1 | 0.81% |
| F2fs | 1 | 0.81% |
| Unknown | 1 | 0.81% |
Dual Boot with Linux
Hosting more than one Linux


| Dual boot | Computers | Percent |
|---|---|---|
| No | 110 | 89.43% |
| Yes | 13 | 10.57% |
Dual Boot (Win)
Hosting Linux and Windows


| Dual boot | Computers | Percent |
|---|---|---|
| No | 84 | 68.29% |
| Yes | 39 | 31.71% |
Country
Geographic location (country)


| Country | Computers | Percent |
|---|---|---|
| USA | 28 | 22.76% |
| Germany | 13 | 10.57% |
| Russia | 10 | 8.13% |
| Sweden | 6 | 4.88% |
| Ukraine | 5 | 4.07% |
| Canada | 5 | 4.07% |
| Spain | 4 | 3.25% |
| Italy | 4 | 3.25% |
| France | 4 | 3.25% |
| China | 4 | 3.25% |
| Brazil | 4 | 3.25% |
| UK | 3 | 2.44% |
| Australia | 3 | 2.44% |
| Romania | 2 | 1.63% |
| Poland | 2 | 1.63% |
| Norway | 2 | 1.63% |
| Mexico | 2 | 1.63% |
| Bulgaria | 2 | 1.63% |
| Belgium | 2 | 1.63% |
| Switzerland | 1 | 0.81% |
| South Africa | 1 | 0.81% |
| Slovenia | 1 | 0.81% |
| Serbia | 1 | 0.81% |
| Portugal | 1 | 0.81% |
| Luxembourg | 1 | 0.81% |
| Lithuania | 1 | 0.81% |
| Ireland | 1 | 0.81% |
| Indonesia | 1 | 0.81% |
| India | 1 | 0.81% |
| Hungary | 1 | 0.81% |
| Greece | 1 | 0.81% |
| Finland | 1 | 0.81% |
| Denmark | 1 | 0.81% |
| Czech Republic | 1 | 0.81% |
| Colombia | 1 | 0.81% |
| Bosnia and Herzegovina | 1 | 0.81% |
| Austria | 1 | 0.81% |
City
Geographic location (city)


| City | Computers | Percent |
|---|---|---|
| Kyiv | 3 | 2.44% |
| Stockholm | 2 | 1.63% |
| Sofia | 2 | 1.63% |
| Seattle | 2 | 1.63% |
| Neuburg an der Donau | 2 | 1.63% |
| Moscow | 2 | 1.63% |
| Montreal | 2 | 1.63% |
| Madrid | 2 | 1.63% |
| Ekaterinburg | 2 | 1.63% |
| Brussels | 2 | 1.63% |
| Xi'an | 1 | 0.81% |
| Worthing | 1 | 0.81% |
| West Branch | 1 | 0.81% |
| Warsaw | 1 | 0.81% |
| Warren | 1 | 0.81% |
| Voronezh | 1 | 0.81% |
| Vojnuv Mestec | 1 | 0.81% |
| Vladikavkaz | 1 | 0.81% |
| Vilnius | 1 | 0.81% |
| Vienna | 1 | 0.81% |
| Verona | 1 | 0.81% |
| Uppsala | 1 | 0.81% |
| Udine | 1 | 0.81% |
| Tuzla | 1 | 0.81% |
| Timișoara | 1 | 0.81% |
| Tianjin | 1 | 0.81% |
| Tampere | 1 | 0.81% |
| São Paulo | 1 | 0.81% |
| Södertälje | 1 | 0.81% |
| Stuttgart | 1 | 0.81% |
| Strassen | 1 | 0.81% |
| St Petersburg | 1 | 0.81% |
| Speyer | 1 | 0.81% |
| Skien | 1 | 0.81% |
| Sevnica | 1 | 0.81% |
| Schortens | 1 | 0.81% |
| Savannah | 1 | 0.81% |
| Sault Ste. Marie | 1 | 0.81% |
| Sao Jose | 1 | 0.81% |
| Santo André | 1 | 0.81% |
| Salem | 1 | 0.81% |
| Saeffle | 1 | 0.81% |
| Ruelle-sur-Touvre | 1 | 0.81% |
| Rome | 1 | 0.81% |
| Rocklin | 1 | 0.81% |
| Rio de Janeiro | 1 | 0.81% |
| Qujing | 1 | 0.81% |
| Puebla City | 1 | 0.81% |
| Povoa de Santa Iria | 1 | 0.81% |
| Port Elizabeth | 1 | 0.81% |
| Phoenix | 1 | 0.81% |
| Perth | 1 | 0.81% |
| Owasso | 1 | 0.81% |
| Ottawa | 1 | 0.81% |
| Oslo | 1 | 0.81% |
| Orsay | 1 | 0.81% |
| Orenburg | 1 | 0.81% |
| Novi Sad | 1 | 0.81% |
| North Augusta | 1 | 0.81% |
| Nizhniy Novgorod | 1 | 0.81% |
Vendor
Motherboard manufacturer


| Name | Computers | Percent |
|---|---|---|
| Lenovo | 23 | 18.7% |
| ASUSTek Computer | 21 | 17.07% |
| Hewlett-Packard | 15 | 12.2% |
| Dell | 15 | 12.2% |
| Gigabyte Technology | 10 | 8.13% |
| MSI | 9 | 7.32% |
| Acer | 7 | 5.69% |
| ASRock | 5 | 4.07% |
| Notebook | 3 | 2.44% |
| Intel | 2 | 1.63% |
| Apple | 2 | 1.63% |
| Timi | 1 | 0.81% |
| StationX | 1 | 0.81% |
| Shuttle | 1 | 0.81% |
| Samsung Electronics | 1 | 0.81% |
| Multilaser Industrial | 1 | 0.81% |
| Medion | 1 | 0.81% |
| IntegralTech | 1 | 0.81% |
| GPD | 1 | 0.81% |
| Biostar | 1 | 0.81% |
| Bak USA Technologies | 1 | 0.81% |
| Unknown | 1 | 0.81% |
Model
Motherboard model


| Name | Computers | Percent |
|---|---|---|
| MSI MS-7B79 | 2 | 1.63% |
| Lenovo IdeaPad 330S-15ARR 81FB | 2 | 1.63% |
| Gigabyte B450M DS3H | 2 | 1.63% |
| Timi TM1613 | 1 | 0.81% |
| StationX Manjaro Spitfire | 1 | 0.81% |
| Shuttle SH87R | 1 | 0.81% |
| Samsung Electronics 530U3BI/530U4BI/530U4BH | 1 | 0.81% |
| Notebook W35xSTQ_370ST | 1 | 0.81% |
| Notebook P65_P67RGRERA | 1 | 0.81% |
| Notebook N141CU | 1 | 0.81% |
| Multilaser Industrial PC150 | 1 | 0.81% |
| MSI PS63 Modern 8SC | 1 | 0.81% |
| MSI MS-7A63 | 1 | 0.81% |
| MSI MS-7996 | 1 | 0.81% |
| MSI MS-7979 | 1 | 0.81% |
| MSI MS-7977 | 1 | 0.81% |
| MSI MS-7821 | 1 | 0.81% |
| MSI MS-6657 | 1 | 0.81% |
| Medion MS-7621 | 1 | 0.81% |
| Lenovo Yoga C940-14IIL 81Q9 | 1 | 0.81% |
| Lenovo Yoga C930-13IKB | 1 | 0.81% |
| Lenovo Yoga C740-15IML 81TD | 1 | 0.81% |
| Lenovo YB1-X91F | 1 | 0.81% |
| Lenovo XiaoXinPro-13IML 2019 81XB | 1 | 0.81% |
| Lenovo V580c 20160 | 1 | 0.81% |
| Lenovo ThinkPad X220 4290FP2 | 1 | 0.81% |
| Lenovo ThinkPad X1 Carbon 7th 20R1S04100 | 1 | 0.81% |
| Lenovo ThinkPad X1 Carbon 7th 20QDCTO1WW | 1 | 0.81% |
| Lenovo ThinkPad X1 Carbon 7th 20QD003LRT | 1 | 0.81% |
| Lenovo ThinkPad X1 Carbon 3rd 20BSCTO1WW | 1 | 0.81% |
| Lenovo ThinkPad T480 20L5CTO1WW | 1 | 0.81% |
| Lenovo ThinkPad T470 20HES2SF00 | 1 | 0.81% |
| Lenovo ThinkPad T440s 20ARA0K400 | 1 | 0.81% |
| Lenovo ThinkPad S1 Yoga 20CD0038MZ | 1 | 0.81% |
| Lenovo ThinkCentre M93p 10A6S0RN00 | 1 | 0.81% |
| Lenovo ThinkCentre M920s 10SJ001JPB | 1 | 0.81% |
| Lenovo ThinkCentre M91p 0266RZ1 | 1 | 0.81% |
| Lenovo Legion Y530-15ICH 81FV | 1 | 0.81% |
| Lenovo IdeaPad S540-14API 81NH | 1 | 0.81% |
| Lenovo IdeaPad 100-15IBD 80QQ | 1 | 0.81% |
| Intel NUC5PPYB H76558-106 | 1 | 0.81% |
| Intel NUC10i7FNH | 1 | 0.81% |
| IntegralTech 35404V4C4D0S | 1 | 0.81% |
| HP ProOne 400 G3 20.0-in Non-Touch AiO | 1 | 0.81% |
| HP ProBook 650 G5 | 1 | 0.81% |
| HP ProBook 450 G5 | 1 | 0.81% |
| HP Pavilion Gaming Desktop 690-00xx | 1 | 0.81% |
| HP Laptop 17-by0xxx | 1 | 0.81% |
| HP Laptop 15-bs1xx | 1 | 0.81% |
| HP G42 | 1 | 0.81% |
| HP ENVY x360 Convertible 15-ds0xxx | 1 | 0.81% |
| HP ENVY x360 Convertible 13-ar0xxx | 1 | 0.81% |
| HP ENVY Laptop 13-aq0xxx | 1 | 0.81% |
| HP EliteBook 840 G6 | 1 | 0.81% |
| HP EliteBook 840 G5 | 1 | 0.81% |
| HP EliteBook 840 G2 | 1 | 0.81% |
| HP Compaq 8710w (GC125EA#ABN) | 1 | 0.81% |
| HP 500-480nr | 1 | 0.81% |
| GPD P2 MAX | 1 | 0.81% |
| Gigabyte Z87X-UD7 TH | 1 | 0.81% |
Model Family
Motherboard model prefix


| Name | Computers | Percent |
|---|---|---|
| Lenovo ThinkPad | 9 | 7.32% |
| Dell Inspiron | 5 | 4.07% |
| Lenovo IdeaPad | 4 | 3.25% |
| Dell Latitude | 4 | 3.25% |
| ASUS ROG | 4 | 3.25% |
| Acer Aspire | 4 | 3.25% |
| Lenovo Yoga | 3 | 2.44% |
| Lenovo ThinkCentre | 3 | 2.44% |
| HP ENVY | 3 | 2.44% |
| HP EliteBook | 3 | 2.44% |
| Dell Precision | 3 | 2.44% |
| MSI MS-7B79 | 2 | 1.63% |
| HP ProBook | 2 | 1.63% |
| HP Laptop | 2 | 1.63% |
| Gigabyte B450M | 2 | 1.63% |
| Dell OptiPlex | 2 | 1.63% |
| ASUS TUF | 2 | 1.63% |
| Timi TM1613 | 1 | 0.81% |
| StationX Manjaro | 1 | 0.81% |
| Shuttle SH87R | 1 | 0.81% |
| Samsung Electronics 530U3BI | 1 | 0.81% |
| Notebook W35xSTQ | 1 | 0.81% |
| Notebook P65 | 1 | 0.81% |
| Notebook N141CU | 1 | 0.81% |
| Multilaser Industrial PC150 | 1 | 0.81% |
| MSI PS63 | 1 | 0.81% |
| MSI MS-7A63 | 1 | 0.81% |
| MSI MS-7996 | 1 | 0.81% |
| MSI MS-7979 | 1 | 0.81% |
| MSI MS-7977 | 1 | 0.81% |
| MSI MS-7821 | 1 | 0.81% |
| MSI MS-6657 | 1 | 0.81% |
| Medion MS-7621 | 1 | 0.81% |
| Lenovo YB1-X91F | 1 | 0.81% |
| Lenovo XiaoXinPro-13IML | 1 | 0.81% |
| Lenovo V580c | 1 | 0.81% |
| Lenovo Legion | 1 | 0.81% |
| Intel NUC5PPYB | 1 | 0.81% |
| Intel NUC10i7FNH | 1 | 0.81% |
| IntegralTech 35404V4C4D0S | 1 | 0.81% |
| HP ProOne | 1 | 0.81% |
| HP Pavilion | 1 | 0.81% |
| HP G42 | 1 | 0.81% |
| HP Compaq | 1 | 0.81% |
| HP 500-480nr | 1 | 0.81% |
| GPD P2 | 1 | 0.81% |
| Gigabyte Z87X-UD7 | 1 | 0.81% |
| Gigabyte Z370P | 1 | 0.81% |
| Gigabyte Z270X-Ultra | 1 | 0.81% |
| Gigabyte X570 | 1 | 0.81% |
| Gigabyte Q270M-D3H | 1 | 0.81% |
| Gigabyte H170-HD3-CF | 1 | 0.81% |
| Gigabyte B250M-DS3H | 1 | 0.81% |
| Gigabyte AB350-Gaming | 1 | 0.81% |
| Dell G7 | 1 | 0.81% |
| Biostar B350ET2 | 1 | 0.81% |
| Bak USA Technologies Atlas | 1 | 0.81% |
| ASUS X750LB | 1 | 0.81% |
| ASUS X540SA | 1 | 0.81% |
| ASUS X510UAR | 1 | 0.81% |
MFG Year
Motherboard manufacture year


| Year | Computers | Percent |
|---|---|---|
| 2019 | 56 | 45.53% |
| 2018 | 16 | 13.01% |
| 2016 | 9 | 7.32% |
| 2020 | 7 | 5.69% |
| 2013 | 7 | 5.69% |
| 2017 | 5 | 4.07% |
| 2015 | 5 | 4.07% |
| 2014 | 4 | 3.25% |
| 2011 | 4 | 3.25% |
| 2010 | 3 | 2.44% |
| 2012 | 2 | 1.63% |
| 2008 | 2 | 1.63% |
| 2007 | 2 | 1.63% |
| 2009 | 1 | 0.81% |
Form Factor
Physical design of the computer


| Name | Computers | Percent |
|---|---|---|
| Notebook | 68 | 55.28% |
| Desktop | 44 | 35.77% |
| Convertible | 7 | 5.69% |
| Mini pc | 2 | 1.63% |
| All in one | 2 | 1.63% |
Secure Boot
Enabled or disabled


| State | Computers | Percent |
|---|---|---|
| Disabled | 123 | 100% |
Coreboot
Have coreboot on board


| Used | Computers | Percent |
|---|---|---|
| No | 123 | 100% |
RAM Size
Total RAM memory


| Size in GB | Computers | Percent |
|---|---|---|
| 16.01-24.0 | 47 | 38.21% |
| 4.01-8.0 | 28 | 22.76% |
| 8.01-16.0 | 19 | 15.45% |
| 3.01-4.0 | 15 | 12.2% |
| 32.01-64.0 | 7 | 5.69% |
| 1.01-2.0 | 4 | 3.25% |
| 64.01-256.0 | 2 | 1.63% |
| 24.01-32.0 | 1 | 0.81% |
RAM Used
Used RAM memory


| Used GB | Computers | Percent |
|---|---|---|
| 2.01-3.0 | 42 | 34.15% |
| 1.01-2.0 | 33 | 26.83% |
| 3.01-4.0 | 23 | 18.7% |
| 4.01-8.0 | 18 | 14.63% |
| 0.01-1.0 | 5 | 4.07% |
| 8.01-16.0 | 2 | 1.63% |
Drive Vendor
Hard drive vendors


| Vendor | Computers | Drives | Percent |
|---|---|---|---|
| Samsung Electronics | 33 | 39 | 19.88% |
| Seagate | 31 | 34 | 18.67% |
| WDC | 25 | 27 | 15.06% |
| Intel | 11 | 11 | 6.63% |
| Toshiba | 7 | 8 | 4.22% |
| Kingston | 7 | 8 | 4.22% |
| SanDisk | 6 | 7 | 3.61% |
| Crucial | 6 | 6 | 3.61% |
| Unknown | 5 | 5 | 3.01% |
| Hitachi | 4 | 4 | 2.41% |
| A-DATA Technology | 4 | 5 | 2.41% |
| SK Hynix | 3 | 3 | 1.81% |
| Intenso | 3 | 3 | 1.81% |
| Transcend | 2 | 2 | 1.2% |
| SPCC | 2 | 2 | 1.2% |
| Micron Technology | 2 | 2 | 1.2% |
| LITEONIT | 2 | 2 | 1.2% |
| Apple | 2 | 2 | 1.2% |
| XPG | 1 | 1 | 0.6% |
| SKhynix | 1 | 1 | 0.6% |
| PNY | 1 | 1 | 0.6% |
| Phison | 1 | 1 | 0.6% |
| Patriot | 1 | 1 | 0.6% |
| HGST | 1 | 1 | 0.6% |
| Hewlett-Packard | 1 | 1 | 0.6% |
| FORESEE | 1 | 1 | 0.6% |
| China | 1 | 1 | 0.6% |
| BIWIN | 1 | 1 | 0.6% |
| Apacer | 1 | 1 | 0.6% |
Drive Model
Hard drive models


| Model | Computers | Percent |
|---|---|---|
| ST1000LM035-1RK172 1TB | 4 | 2.23% |
| SSD 850 EVO 250GB | 4 | 2.23% |
| SSDPEKKF010T8L 1TB | 3 | 1.68% |
| SSD 840 EVO 250GB | 3 | 1.68% |
| WDS240G2G0B-00EPW0 240GB SSD | 2 | 1.12% |
| SV300S37A120G 120GB SSD | 2 | 1.12% |
| ST3000DM001-1ER166 3TB | 2 | 1.12% |
| ST3000DM001-1CH166 3TB | 2 | 1.12% |
| ST1000LM024 HN-M101MBB 1TB | 2 | 1.12% |
| ST1000DM003-1SB102 1TB | 2 | 1.12% |
| ST1000DM003-1CH162 1TB | 2 | 1.12% |
| SSD 860 EVO 250GB | 2 | 1.12% |
| SSD 860 EVO 1TB | 2 | 1.12% |
| SSD 850 PRO 256GB | 2 | 1.12% |
| SA400S37120G 120GB SSD | 2 | 1.12% |
| SA400M8240G 240GB SSD | 2 | 1.12% |
| MZVLB512HBJQ-000L2 512GB | 2 | 1.12% |
| DT01ACA200 2TB | 2 | 1.12% |
| CT525MX300SSD1 528GB | 2 | 1.12% |
| WDS500G2B0B-00YS70 500GB SSD | 1 | 0.56% |
| WDS100T2B0A-00SM50 1TB SSD | 1 | 0.56% |
| WD5001AALS-00E3A0 500GB | 1 | 0.56% |
| WD5000AAKX-75U6AA0 500GB | 1 | 0.56% |
| WD40EFRX-68N32N0 4TB | 1 | 0.56% |
| WD4005FZBX-00K5WB0 4TB | 1 | 0.56% |
| WD3200KS-00PFB0 320GB | 1 | 0.56% |
| WD3200BPVT-22JJ5T0 320GB | 1 | 0.56% |
| WD3200BEVT-22ZCT0 320GB | 1 | 0.56% |
| WD3200BEVT-00ZAT0 320GB | 1 | 0.56% |
| WD3200AAKX-221CA1 320GB | 1 | 0.56% |
| WD2500BPVT-22ZEST0 250GB | 1 | 0.56% |
| WD2500AAKX-083CA1 250GB | 1 | 0.56% |
| WD20EARX-00PASB0 2TB | 1 | 0.56% |
| WD1600AAJS-65WAA0 160GB | 1 | 0.56% |
| WD1600AAJS-00B4A0 160GB | 1 | 0.56% |
| WD10SPZX-21Z10T0 1TB | 1 | 0.56% |
| WD10EZEX-22BN5A0 1TB | 1 | 0.56% |
| WD10EZEX-08M2NA0 1TB | 1 | 0.56% |
| WD10EZEX-00WN4A0 1TB | 1 | 0.56% |
| WD10EZEX-00RKKA0 1TB | 1 | 0.56% |
| WD10EARX-00N0YB0 1TB | 1 | 0.56% |
| WD10EARS-00Y5B1 1TB | 1 | 0.56% |
| VT180 480GB SSD | 1 | 0.56% |
| TS512GMTS430S 512GB SSD | 1 | 0.56% |
| TS256GMTS400 256GB SSD | 1 | 0.56% |
| SX8200PNP 256GB | 1 | 0.56% |
| SV300S37A240G 240GB SSD | 1 | 0.56% |
| SU650 120GB SSD | 1 | 0.56% |
| ST95005620AS 500GB | 1 | 0.56% |
| ST9500325AS 500GB | 1 | 0.56% |
| ST8000DM004-2CX188 8TB | 1 | 0.56% |
| ST500LT012-9WS142 500GB | 1 | 0.56% |
| ST500LT012-1DG142 500GB | 1 | 0.56% |
| ST500LM034-2GH17A 500GB | 1 | 0.56% |
| ST5000AS0011-1L5178 5TB | 1 | 0.56% |
| ST4000VN000-1H4168 4TB | 1 | 0.56% |
| ST3500414CS 500GB | 1 | 0.56% |
| ST31500341AS 1TB | 1 | 0.56% |
| ST2000LX001-1RG174 2TB | 1 | 0.56% |
| ST2000LM003 HN-M201RAD 2TB | 1 | 0.56% |
Drive Kind
HDD or SSD


| Kind | Computers | Drives | Percent |
|---|---|---|---|
| SSD | 67 | 81 | 45.89% |
| HDD | 53 | 73 | 36.3% |
| NVMe | 19 | 20 | 13.01% |
| MMC | 5 | 5 | 3.42% |
| Unknown | 2 | 2 | 1.37% |
Drive Connector
SATA, SAS, NVMe, etc.


| Type | Computers | Drives | Percent |
|---|---|---|---|
| SATA | 97 | 152 | 77.6% |
| NVMe | 19 | 20 | 15.2% |
| MMC | 5 | 5 | 4% |
| SAS | 4 | 4 | 3.2% |
Drive Size
Size of hard drive


| Size in TB | Computers | Drives | Percent |
|---|---|---|---|
| 0.01-0.5 | 80 | 102 | 52.98% |
| 0.51-1.0 | 48 | 54 | 31.79% |
| 1.01-2.0 | 11 | 12 | 7.28% |
| 2.01-3.0 | 7 | 8 | 4.64% |
| 3.01-4.0 | 3 | 3 | 1.99% |
| 4.01-10.0 | 2 | 2 | 1.32% |
Space Total
Amount of disk space available on the file system


| Size in GB | Computers | Percent |
|---|---|---|
| 251-500 | 29 | 23.58% |
| 101-250 | 27 | 21.95% |
| 501-1000 | 23 | 18.7% |
| 1001-2000 | 13 | 10.57% |
| 51-100 | 12 | 9.76% |
| Unknown | 7 | 5.69% |
| More than 3000 | 4 | 3.25% |
| 1-20 | 4 | 3.25% |
| 21-50 | 3 | 2.44% |
| 2001-3000 | 1 | 0.81% |
Space Used
Amount of used disk space


| Used GB | Computers | Percent |
|---|---|---|
| 1-20 | 37 | 30.08% |
| 101-250 | 23 | 18.7% |
| 21-50 | 15 | 12.2% |
| 51-100 | 14 | 11.38% |
| 251-500 | 10 | 8.13% |
| 501-1000 | 10 | 8.13% |
| Unknown | 7 | 5.69% |
| 1001-2000 | 6 | 4.88% |
| More than 3000 | 1 | 0.81% |
Malfunc. Drives
Drive models with a malfunction


| Model | Computers | Drives | Percent |
|---|---|---|---|
| CT525MX300SSD1 528GB | 2 | 2 | 25% |
| ST5000AS0011-1L5178 5TB | 1 | 1 | 12.5% |
| ST1000DX001-1CM162 1TB | 1 | 1 | 12.5% |
| SSDSC2KW360H6 360GB | 1 | 1 | 12.5% |
| MTFDDAV256TDL-1AW1ZABHA 256GB SSD | 1 | 1 | 12.5% |
| iSSD P4 16GB | 1 | 1 | 12.5% |
| HTS545050A7E380 500GB | 1 | 1 | 12.5% |
Malfunc. Drive Vendor
Vendors of faulty drives


| Vendor | Computers | Drives | Percent |
|---|---|---|---|
| Seagate | 2 | 2 | 25% |
| Crucial | 2 | 2 | 25% |
| SanDisk | 1 | 1 | 12.5% |
| Micron Technology | 1 | 1 | 12.5% |
| Intel | 1 | 1 | 12.5% |
| Hitachi | 1 | 1 | 12.5% |
Malfunc. Drive Kind
Kinds of faulty drives


| Kind | Computers | Drives | Percent |
|---|---|---|---|
| SSD | 5 | 5 | 62.5% |
| HDD | 3 | 3 | 37.5% |
Failed Drives
Failed drive models


| Model | Computers | Drives | Percent |
|---|---|---|---|
| WD1600AAJS-65WAA0 160GB | 1 | 1 | 50% |
| HD321HJ 320GB | 1 | 1 | 50% |
Failed Drive Vendor
Failed drive vendors


| Vendor | Computers | Drives | Percent |
|---|---|---|---|
| WDC | 1 | 1 | 50% |
| Samsung Electronics | 1 | 1 | 50% |
Drive Status
Number of failed and malfunc. drives


| Status | Computers | Drives | Percent |
|---|---|---|---|
| Detected | 74 | 118 | 61.67% |
| Works | 37 | 53 | 30.83% |
| Malfunc | 7 | 8 | 5.83% |
| Failed | 2 | 2 | 1.67% |
Storage Vendor
Storage controller vendors


| Vendor | Computers | Percent |
|---|---|---|
| Intel | 83 | 54.97% |
| AMD | 25 | 16.56% |
| Samsung Electronics | 16 | 10.6% |
| Silicon Motion | 5 | 3.31% |
| Nvidia | 5 | 3.31% |
| Sandisk | 4 | 2.65% |
| Phison Electronics | 3 | 1.99% |
| Toshiba America Info Systems | 2 | 1.32% |
| Union Memory (Shenzhen) | 1 | 0.66% |
| SK Hynix | 1 | 0.66% |
| Silicon Image | 1 | 0.66% |
| Realtek Semiconductor | 1 | 0.66% |
| KIOXIA | 1 | 0.66% |
| Integrated Technology Express | 1 | 0.66% |
| ASMedia Technology | 1 | 0.66% |
| ADATA Technology | 1 | 0.66% |
Storage Model
Storage controller models


| Model | Computers | Percent |
|---|---|---|
| FCH SATA Controller [AHCI mode] | 24 | 13.87% |
| NVMe SSD Controller SM981/PM981/PM983 | 13 | 7.51% |
| Sunrise Point-LP SATA Controller [AHCI mode] | 8 | 4.62% |
| Non-Volatile memory controller | 8 | 4.62% |
| 8 Series/C220 Series Chipset Family 6-port SATA Controller 1 [AHCI mode] | 8 | 4.62% |
| 400 Series Chipset SATA Controller | 7 | 4.05% |
| 82801 Mobile SATA Controller [RAID mode] | 6 | 3.47% |
| 200 Series PCH SATA controller [AHCI mode] | 6 | 3.47% |
| 8 Series SATA Controller 1 [AHCI mode] | 5 | 2.89% |
| 6 Series/C200 Series Chipset Family 6 port Mobile SATA AHCI Controller | 5 | 2.89% |
| Wildcat Point-LP SATA Controller [AHCI Mode] | 4 | 2.31% |
| SSD 660P Series | 4 | 2.31% |
| Q170/Q150/B150/H170/H110/Z170/CM236 Chipset SATA Controller [AHCI Mode] | 4 | 2.31% |
| Cannon Point-LP SATA Controller [AHCI Mode] | 4 | 2.31% |
| 300 Series Chipset SATA Controller | 4 | 2.31% |
| SSD Pro 7600p/760p/E 6100p Series | 3 | 1.73% |
| SATA Controller [RAID mode] | 3 | 1.73% |
| Comet Lake SATA AHCI Controller | 3 | 1.73% |
| Cannon Lake Mobile PCH SATA AHCI Controller | 3 | 1.73% |
| WD Black 2018/PC SN520 NVMe SSD | 2 | 1.16% |
| SATA controller | 2 | 1.16% |
| NVMe SSD Controller SM951/PM951 | 2 | 1.16% |
| MCP79 AHCI Controller | 2 | 1.16% |
| E12 NVMe Controller | 2 | 1.16% |
| Cannon Lake PCH SATA AHCI Controller | 2 | 1.16% |
| Atom/Celeron/Pentium Processor x5-E8000/J3xxx/N3xxx Series SATA Controller | 2 | 1.16% |
| 82801HM/HEM (ICH8M/ICH8M-E) SATA Controller [AHCI mode] | 2 | 1.16% |
| 82801HM/HEM (ICH8M/ICH8M-E) IDE Controller | 2 | 1.16% |
| 5 Series/3400 Series Chipset 4 port SATA AHCI Controller | 2 | 1.16% |
| XPG SX8200 Pro PCIe Gen3x4 M.2 2280 Solid State Drive | 1 | 0.58% |
| XG4 NVMe SSD Controller | 1 | 0.58% |
| X399 Series Chipset SATA Controller | 1 | 0.58% |
| WD Black 2018/PC SN720 NVMe SSD | 1 | 0.58% |
| Toshiba America Info Non-Volatile memory controller | 1 | 0.58% |
| SB7x0/SB8x0/SB9x0 SATA Controller [AHCI mode] | 1 | 0.58% |
| Realtek Non-Volatile memory controller | 1 | 0.58% |
| PCI0680 Ultra ATA-133 Host Controller | 1 | 0.58% |
| NM10/ICH7 Family SATA Controller [IDE mode] | 1 | 0.58% |
| Mobile PM965/GM965 PT IDER Controller | 1 | 0.58% |
| MCP89 SATA Controller (AHCI mode) | 1 | 0.58% |
| MCP78S [GeForce 8200] SATA Controller (non-AHCI mode) | 1 | 0.58% |
| MCP78S [GeForce 8200] IDE | 1 | 0.58% |
| MCP67 IDE Controller | 1 | 0.58% |
| MCP67 AHCI Controller | 1 | 0.58% |
| IT8213 IDE Controller | 1 | 0.58% |
| HM170/QM170 Chipset SATA Controller [AHCI Mode] | 1 | 0.58% |
| FCH SATA Controller D | 1 | 0.58% |
| Electronics SATA controller | 1 | 0.58% |
| E16 PCIe4 NVMe Controller | 1 | 0.58% |
| BC501 NVMe Solid State Drive 512GB | 1 | 0.58% |
| ASM1062 Serial ATA Controller | 1 | 0.58% |
| 9 Series Chipset Family SATA Controller [AHCI Mode] | 1 | 0.58% |
| 82801IR/IO/IH (ICH9R/DO/DH) 6 port SATA Controller [AHCI mode] | 1 | 0.58% |
| 82801IBM/IEM (ICH9M/ICH9M-E) 4 port SATA Controller [AHCI mode] | 1 | 0.58% |
| 82801G (ICH7 Family) IDE Controller | 1 | 0.58% |
| 7 Series/C210 Series Chipset Family 6-port SATA Controller [AHCI mode] | 1 | 0.58% |
| 7 Series Chipset Family 6-port SATA Controller [AHCI mode] | 1 | 0.58% |
| 6 Series/C200 Series Chipset Family Desktop SATA Controller (IDE mode, ports 4-5) | 1 | 0.58% |
| 6 Series/C200 Series Chipset Family Desktop SATA Controller (IDE mode, ports 0-3) | 1 | 0.58% |
| 6 Series/C200 Series Chipset Family 6 port Desktop SATA AHCI Controller | 1 | 0.58% |
Storage Kind
Kind of storage controller (IDE, SATA, NVMe, SAS, ...)


| Kind | Computers | Percent |
|---|---|---|
| SATA | 96 | 63.16% |
| NVMe | 39 | 25.66% |
| RAID | 10 | 6.58% |
| IDE | 7 | 4.61% |
CPU Vendor
Processor vendors


| Vendor | Computers | Percent |
|---|---|---|
| Intel | 93 | 75.61% |
| AMD | 30 | 24.39% |
CPU Model
Processor models


| Model | Computers | Percent |
|---|---|---|
| Intel Core i7-8750H CPU @ 2.20GHz | 4 | 3.25% |
| Intel Core i7-8565U CPU @ 1.80GHz | 4 | 3.25% |
| Intel Core i5-8250U CPU @ 1.60GHz | 4 | 3.25% |
| Intel Core i7-6700K CPU @ 4.00GHz | 3 | 2.44% |
| Intel Core i7-10710U CPU @ 1.10GHz | 3 | 2.44% |
| AMD Ryzen 5 3600 6-Core Processor | 3 | 2.44% |
| AMD Ryzen 5 2500U with Radeon Vega Mobile Gfx | 3 | 2.44% |
| Intel Pentium CPU N3700 @ 1.60GHz | 2 | 1.63% |
| Intel Core i7-8665U CPU @ 1.90GHz | 2 | 1.63% |
| Intel Core i7-8550U CPU @ 1.80GHz | 2 | 1.63% |
| Intel Core i7-4500U CPU @ 1.80GHz | 2 | 1.63% |
| Intel Core i5-8265U CPU @ 1.60GHz | 2 | 1.63% |
| Intel Core i5-4570 CPU @ 3.20GHz | 2 | 1.63% |
| Intel Core 2 Duo CPU T6600 @ 2.20GHz | 2 | 1.63% |
| AMD Ryzen 7 2700X Eight-Core Processor | 2 | 1.63% |
| AMD Ryzen 7 2700 Eight-Core Processor | 2 | 1.63% |
| AMD Ryzen 5 3500U with Radeon Vega Mobile Gfx | 2 | 1.63% |
| Intel Xeon CPU E5-2689 0 @ 2.60GHz | 1 | 0.81% |
| Intel Pentium Dual-Core CPU T4400 @ 2.20GHz | 1 | 0.81% |
| Intel Pentium Dual-Core CPU E5300 @ 2.60GHz | 1 | 0.81% |
| Intel Core m3-8100Y CPU @ 1.10GHz | 1 | 0.81% |
| Intel Core i7-9850H CPU @ 2.60GHz | 1 | 0.81% |
| Intel Core i7-9700K CPU @ 3.60GHz | 1 | 0.81% |
| Intel Core i7-8700K CPU @ 3.70GHz | 1 | 0.81% |
| Intel Core i7-8650U CPU @ 1.90GHz | 1 | 0.81% |
| Intel Core i7-7500U CPU @ 2.70GHz | 1 | 0.81% |
| Intel Core i7-6820HQ CPU @ 2.70GHz | 1 | 0.81% |
| Intel Core i7-6700T CPU @ 2.80GHz | 1 | 0.81% |
| Intel Core i7-6700HQ CPU @ 2.60GHz | 1 | 0.81% |
| Intel Core i7-6500U CPU @ 2.50GHz | 1 | 0.81% |
| Intel Core i7-5600U CPU @ 2.60GHz | 1 | 0.81% |
| Intel Core i7-4850HQ CPU @ 2.30GHz | 1 | 0.81% |
| Intel Core i7-4790S CPU @ 3.20GHz | 1 | 0.81% |
| Intel Core i7-4770S CPU @ 3.10GHz | 1 | 0.81% |
| Intel Core i7-4702HQ CPU @ 2.20GHz | 1 | 0.81% |
| Intel Core i7-4700MQ CPU @ 2.40GHz | 1 | 0.81% |
| Intel Core i7-4600U CPU @ 2.10GHz | 1 | 0.81% |
| Intel Core i7-2640M CPU @ 2.80GHz | 1 | 0.81% |
| Intel Core i7-1065G7 CPU @ 1.30GHz | 1 | 0.81% |
| Intel Core i7-10510U CPU @ 1.80GHz | 1 | 0.81% |
| Intel Core i7 CPU Q 740 @ 1.73GHz | 1 | 0.81% |
| Intel Core i5-8600K CPU @ 3.60GHz | 1 | 0.81% |
| Intel Core i5-8500 CPU @ 3.00GHz | 1 | 0.81% |
| Intel Core i5-8400 CPU @ 2.80GHz | 1 | 0.81% |
| Intel Core i5-8365U CPU @ 1.60GHz | 1 | 0.81% |
| Intel Core i5-7500T CPU @ 2.70GHz | 1 | 0.81% |
| Intel Core i5-7400 CPU @ 3.00GHz | 1 | 0.81% |
| Intel Core i5-7300U CPU @ 2.60GHz | 1 | 0.81% |
| Intel Core i5-7200U CPU @ 2.50GHz | 1 | 0.81% |
| Intel Core i5-6600K CPU @ 3.50GHz | 1 | 0.81% |
| Intel Core i5-5300U CPU @ 2.30GHz | 1 | 0.81% |
| Intel Core i5-4690 CPU @ 3.50GHz | 1 | 0.81% |
| Intel Core i5-4670K CPU @ 3.40GHz | 1 | 0.81% |
| Intel Core i5-4590 CPU @ 3.30GHz | 1 | 0.81% |
| Intel Core i5-4210U CPU @ 1.70GHz | 1 | 0.81% |
| Intel Core i5-4200U CPU @ 1.60GHz | 1 | 0.81% |
| Intel Core i5-2520M CPU @ 2.50GHz | 1 | 0.81% |
| Intel Core i5-2467M CPU @ 1.60GHz | 1 | 0.81% |
| Intel Core i5-2450M CPU @ 2.50GHz | 1 | 0.81% |
| Intel Core i5-2410M CPU @ 2.30GHz | 1 | 0.81% |
CPU Model Family
Processor model prefix


| Model | Computers | Percent |
|---|---|---|
| Intel Core i7 | 40 | 32.52% |
| Intel Core i5 | 32 | 26.02% |
| AMD Ryzen 5 | 13 | 10.57% |
| AMD Ryzen 7 | 7 | 5.69% |
| Intel Core i3 | 5 | 4.07% |
| Intel Core 2 Duo | 4 | 3.25% |
| Intel Celeron | 4 | 3.25% |
| Intel Pentium Dual-Core | 2 | 1.63% |
| Intel Pentium | 2 | 1.63% |
| AMD Ryzen 3 | 2 | 1.63% |
| Intel Xeon | 1 | 0.81% |
| Intel Core m3 | 1 | 0.81% |
| Intel Core 2 Quad | 1 | 0.81% |
| Intel Atom | 1 | 0.81% |
| AMD Turion 64 X2 Mobile | 1 | 0.81% |
| AMD Ryzen Threadripper | 1 | 0.81% |
| AMD Ryzen 9 | 1 | 0.81% |
| AMD Phenom II X4 | 1 | 0.81% |
| AMD FX | 1 | 0.81% |
| AMD Athlon | 1 | 0.81% |
| AMD A6 | 1 | 0.81% |
| AMD A4 | 1 | 0.81% |
CPU Cores
Number of processor cores


| Number | Computers | Percent |
|---|---|---|
| 4 | 58 | 47.15% |
| 2 | 37 | 30.08% |
| 6 | 18 | 14.63% |
| 8 | 7 | 5.69% |
| 16 | 1 | 0.81% |
| 12 | 1 | 0.81% |
| 1 | 1 | 0.81% |
CPU Sockets
Number of sockets


| Number | Computers | Percent |
|---|---|---|
| 1 | 123 | 100% |
CPU Threads
Threads per core (Hyper-Threading)


| Number | Computers | Percent |
|---|---|---|
| 2 | 91 | 73.98% |
| 1 | 32 | 26.02% |
CPU Op-Modes
CPU Operation Modes (32-bit, 64-bit)


| Op mode | Computers | Percent |
|---|---|---|
| 32-bit, 64-bit | 123 | 100% |
CPU Microarch
Microarchitecture


| Name | Computers | Percent |
|---|---|---|
| Skylake | 35 | 28.46% |
| Haswell | 15 | 12.2% |
| Zen+ | 12 | 9.76% |
| KabyLake | 12 | 9.76% |
| Zen | 8 | 6.5% |
| SandyBridge | 7 | 5.69% |
| Zen 2 | 5 | 4.07% |
| Penryn | 5 | 4.07% |
| Broadwell | 4 | 3.25% |
| Silvermont | 3 | 2.44% |
| Core | 3 | 2.44% |
| Westmere | 2 | 1.63% |
| IvyBridge | 2 | 1.63% |
| Icelake | 2 | 1.63% |
| Goldmont plus | 2 | 1.63% |
| Puma | 1 | 0.81% |
| Piledriver | 1 | 0.81% |
| Nehalem | 1 | 0.81% |
| K8 Hammer | 1 | 0.81% |
| K10 | 1 | 0.81% |
| Excavator | 1 | 0.81% |
CPU Microcode
Microcode number


| Number | Computers | Percent |
|---|---|---|
| Unknown | 54 | 43.9% |
| 0x806ec | 9 | 7.32% |
| 0x906ea | 7 | 5.69% |
| 0x306c3 | 5 | 4.07% |
| 0x806ea | 4 | 3.25% |
| 0x08108102 | 4 | 3.25% |
| 0x0810100b | 4 | 3.25% |
| 0xa0660 | 3 | 2.44% |
| 0x806e9 | 3 | 2.44% |
| 0x40651 | 3 | 2.44% |
| 0x0800820d | 3 | 2.44% |
| 0x706e5 | 2 | 1.63% |
| 0x506e3 | 2 | 1.63% |
| 0x306d4 | 2 | 1.63% |
| 0x206a7 | 2 | 1.63% |
| 0x08701013 | 2 | 1.63% |
| 0x906e9 | 1 | 0.81% |
| 0x806eb | 1 | 0.81% |
| 0x706a1 | 1 | 0.81% |
| 0x6fb | 1 | 0.81% |
| 0x406e3 | 1 | 0.81% |
| 0x406c4 | 1 | 0.81% |
| 0x406c3 | 1 | 0.81% |
| 0x40661 | 1 | 0.81% |
| 0x206d7 | 1 | 0.81% |
| 0x106e5 | 1 | 0.81% |
| 0x08001138 | 1 | 0.81% |
| 0x08001137 | 1 | 0.81% |
| 0x06006705 | 1 | 0.81% |
| 0x06000852 | 1 | 0.81% |
GPU Vendor
Vendors of graphics cards


| Vendor | Computers | Percent |
|---|---|---|
| Intel | 67 | 45.58% |
| Nvidia | 49 | 33.33% |
| AMD | 31 | 21.09% |
GPU Model
Graphics card models


| Model | Computers | Percent |
|---|---|---|
| UHD Graphics 620 (Whiskey Lake) | 9 | 6.04% |
| UHD Graphics 620 | 7 | 4.7% |
| Ellesmere [Radeon RX 470/480/570/570X/580/580X/590] | 7 | 4.7% |
| Raven Ridge [Radeon Vega Series / Radeon Vega Mobile Series] | 6 | 4.03% |
| UHD Graphics 630 (Mobile) | 5 | 3.36% |
| UHD Graphics | 5 | 3.36% |
| Picasso | 5 | 3.36% |
| Haswell-ULT Integrated Graphics Controller | 5 | 3.36% |
| 2nd Generation Core Processor Family Integrated Graphics Controller | 5 | 3.36% |
| HD Graphics 5500 | 4 | 2.68% |
| HD Graphics 620 | 3 | 2.01% |
| GP106 [GeForce GTX 1060 6GB] | 3 | 2.01% |
| Atom/Celeron/Pentium Processor x5-E8000/J3xxx/N3xxx Integrated Graphics Controller | 3 | 2.01% |
| Xeon E3-1200 v3/4th Gen Core Processor Integrated Graphics Controller | 2 | 1.34% |
| UHD Graphics 605 | 2 | 1.34% |
| TU116 [GeForce GTX 1660] | 2 | 1.34% |
| Navi 10 [Radeon RX 5600 OEM/5600 XT / 5700/5700 XT] | 2 | 1.34% |
| HD Graphics 530 | 2 | 1.34% |
| GP108M [GeForce MX150] | 2 | 1.34% |
| GP107M [GeForce GTX 1050 Ti Mobile] | 2 | 1.34% |
| GP104 [GeForce GTX 1070] | 2 | 1.34% |
| GP104 [GeForce GTX 1070 Ti] | 2 | 1.34% |
| GM206 [GeForce GTX 960] | 2 | 1.34% |
| Core Processor Integrated Graphics Controller | 2 | 1.34% |
| 4th Gen Core Processor Integrated Graphics Controller | 2 | 1.34% |
| Xeon E3-1200 v2/3rd Gen Core processor Graphics Controller | 1 | 0.67% |
| Vega 20 [Radeon VII] | 1 | 0.67% |
| Vega 10 XL/XT [Radeon RX Vega 56/64] | 1 | 0.67% |
| UHD Graphics 630 (Desktop) | 1 | 0.67% |
| UHD Graphics 615 | 1 | 0.67% |
| Turks PRO [Radeon HD 6570/7570/8550] | 1 | 0.67% |
| TU117M [GeForce GTX 1650 Mobile / Max-Q] | 1 | 0.67% |
| Stoney [Radeon R2/R3/R4/R5 Graphics] | 1 | 0.67% |
| Skylake GT2 [HD Graphics 520] | 1 | 0.67% |
| RV710/M92 [Mobility Radeon HD 4530/4570/545v] | 1 | 0.67% |
| Robson CE [Radeon HD 6370M/7370M] | 1 | 0.67% |
| Pitcairn PRO [Radeon HD 7850 / R7 265 / R9 270 1024SP] | 1 | 0.67% |
| Mullins [Radeon R4/R5 Graphics] | 1 | 0.67% |
| Mobile GM965/GL960 Integrated Graphics Controller (secondary) | 1 | 0.67% |
| Mobile GM965/GL960 Integrated Graphics Controller (primary) | 1 | 0.67% |
| MCP89 [GeForce 320M] | 1 | 0.67% |
| Jet PRO [Radeon R5 M230 / R7 M260DX / Radeon 520 Mobile] | 1 | 0.67% |
| Iris Plus Graphics G7 | 1 | 0.67% |
| Iris Plus Graphics G4 (Ice Lake) | 1 | 0.67% |
| HD Graphics 630 | 1 | 0.67% |
| GP108M [GeForce MX250] | 1 | 0.67% |
| GP108BM [GeForce MX250] | 1 | 0.67% |
| GP107M [GeForce MX150] | 1 | 0.67% |
| GP107M [GeForce GTX 1050 Mobile] | 1 | 0.67% |
| GP107 [GeForce GTX 1050] | 1 | 0.67% |
| GP107 [GeForce GTX 1050 Ti] | 1 | 0.67% |
| GP106M [GeForce GTX 1060 Mobile] | 1 | 0.67% |
| GP104 [GeForce GTX 1080] | 1 | 0.67% |
| GP104 [GeForce GTX 1060 6GB] | 1 | 0.67% |
| GM204M [GeForce GTX 970M] | 1 | 0.67% |
| GM108M [GeForce 940MX] | 1 | 0.67% |
| GM108M [GeForce 930MX] | 1 | 0.67% |
| GM107GLM [Quadro M1000M] | 1 | 0.67% |
| GM107 [GeForce GTX 750 Ti] | 1 | 0.67% |
| GM107 [GeForce GTX 745] | 1 | 0.67% |
GPU Combo
Combinations of graphics cards


| Name | Computers | Percent |
|---|---|---|
| 1 x Intel | 46 | 37.4% |
| 1 x Nvidia | 26 | 21.14% |
| 1 x AMD | 26 | 21.14% |
| Intel + Nvidia | 20 | 16.26% |
| AMD + Nvidia | 3 | 2.44% |
| 2 x AMD | 1 | 0.81% |
| Intel + AMD | 1 | 0.81% |
GPU Driver
Free vs proprietary


| Driver | Computers | Percent |
|---|---|---|
| Free | 94 | 76.42% |
| Proprietary | 29 | 23.58% |
GPU Memory
Total video memory


| Size in GB | Computers | Percent |
|---|---|---|
| Unknown | 82 | 66.67% |
| 1.01-2.0 | 12 | 9.76% |
| 7.01-8.0 | 11 | 8.94% |
| 0.51-1.0 | 6 | 4.88% |
| 5.01-6.0 | 5 | 4.07% |
| 0.01-0.5 | 5 | 4.07% |
| 3.01-4.0 | 2 | 1.63% |
Monitor Vendor
Monitor vendors

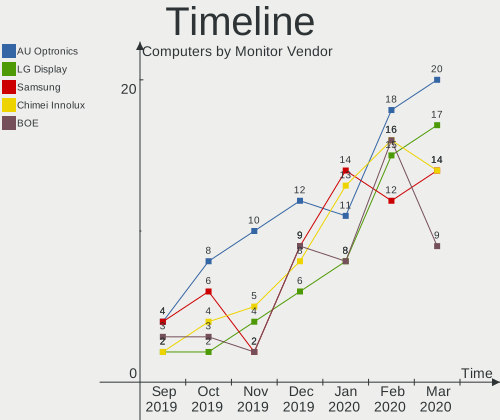
| Vendor | Computers | Percent |
|---|---|---|
| AU Optronics | 20 | 14.6% |
| LG Display | 17 | 12.41% |
| Samsung Electronics | 14 | 10.22% |
| Chimei Innolux | 14 | 10.22% |
| BOE | 9 | 6.57% |
| Goldstar | 7 | 5.11% |
| Acer | 7 | 5.11% |
| Philips | 5 | 3.65% |
| Dell | 5 | 3.65% |
| BenQ | 4 | 2.92% |
| ASUSTek Computer | 4 | 2.92% |
| Ancor Communications | 4 | 2.92% |
| Sharp | 3 | 2.19% |
| LG Electronics | 2 | 1.46% |
| Hewlett-Packard | 2 | 1.46% |
| Chi Mei Optoelectronics | 2 | 1.46% |
| Apple | 2 | 1.46% |
| AOC | 2 | 1.46% |
| ViewSonic | 1 | 0.73% |
| Tech Concepts | 1 | 0.73% |
| Plain Tree Systems | 1 | 0.73% |
| Nvidia | 1 | 0.73% |
| Microstep | 1 | 0.73% |
| Lenovo | 1 | 0.73% |
| KTC | 1 | 0.73% |
| InfoVision | 1 | 0.73% |
| Iiyama | 1 | 0.73% |
| Idek Iiyama | 1 | 0.73% |
| HPN | 1 | 0.73% |
| eMachines | 1 | 0.73% |
| CSOT T3 | 1 | 0.73% |
| AUS | 1 | 0.73% |
Monitor Model
Monitor models


| Model | Computers | Percent |
|---|---|---|
| VG289 AUS28BA 3840x2160 620x340mm 27.8-inch | 2 | 1.4% |
| LCD Monitor CMN15B1 1920x1080 344x194mm 15.5-inch | 2 | 1.4% |
| LCD Monitor AUO572D 1920x1080 293x165mm 13.2-inch | 2 | 1.4% |
| LCD Monitor AUO123D 1920x1080 309x173mm 13.9-inch | 2 | 1.4% |
| VZ229 AUS22CC 1920x1080 476x268mm 21.5-inch | 1 | 0.7% |
| VX2776 Series VSC3E32 1920x1080 598x336mm 27.0-inch | 1 | 0.7% |
| VG248 ACI24A4 1920x1080 530x300mm 24.0-inch | 1 | 0.7% |
| VG240Y ACR0673 1920x1080 527x296mm 23.8-inch | 1 | 0.7% |
| VA326 AUS32FA 1920x1080 698x393mm 31.5-inch | 1 | 0.7% |
| ULTRAWIDE GSM5AE2 3440x1440 800x335mm 34.1-inch | 1 | 0.7% |
| Ultra HD GSM5B09 3840x2160 600x340mm 27.2-inch | 1 | 0.7% |
| SyncMaster SAM0524 1920x1080 477x268mm 21.5-inch | 1 | 0.7% |
| SyncMaster SAM0304 1680x1050 494x320mm 23.2-inch | 1 | 0.7% |
| SE2717H/HX DELD0A1 1920x1080 600x340mm 27.2-inch | 1 | 0.7% |
| S34J55x SAM0F71 3440x1440 797x333mm 34.0-inch | 1 | 0.7% |
| S273HL ACR00DB 1920x1080 600x340mm 27.2-inch | 1 | 0.7% |
| S24D590 SAM0B47 1920x1080 520x290mm 23.4-inch | 1 | 0.7% |
| S24D330 SAM0D92 1920x1080 531x299mm 24.0-inch | 1 | 0.7% |
| S230HL ACR0280 1920x1080 509x286mm 23.0-inch | 1 | 0.7% |
| S22C650 SAM0A05 1920x1080 477x268mm 21.5-inch | 1 | 0.7% |
| S19B300 SAM08A6 1366x768 410x230mm 18.5-inch | 1 | 0.7% |
| S-9005L12-N KTC1990 1280x1024 338x270mm 17.0-inch | 1 | 0.7% |
| RT280K ACR065F 3840x2160 621x341mm 27.9-inch | 1 | 0.7% |
| PL2792Q IVM6637 2560x1440 597x336mm 27.0-inch | 1 | 0.7% |
| PHL BDM4065 PHL08E1 1920x1080 880x490mm 39.7-inch | 1 | 0.7% |
| PHL 436M6VBP PHLC179 3840x2160 941x529mm 42.5-inch | 1 | 0.7% |
| PHL 246E9Q PHLC17C 1920x1080 527x296mm 23.8-inch | 1 | 0.7% |
| P2419H DELD0DA 1920x1080 527x296mm 23.8-inch | 1 | 0.7% |
| P2214H DELA097 1920x1080 480x270mm 21.7-inch | 1 | 0.7% |
| Monitor PTS0899 1680x1050 474x296mm 22.0-inch | 1 | 0.7% |
| LP2475w HWP26F6 1920x1200 546x352mm 25.6-inch | 1 | 0.7% |
| LG ULTRAWIDE GSM59F1 1920x1080 580x240mm 24.7-inch | 1 | 0.7% |
| LEN T23i-10 LEN61AB 1920x1080 509x286mm 23.0-inch | 1 | 0.7% |
| LCD Monitor Wind Net1 22 1920x1080 | 1 | 0.7% |
| LCD Monitor W2240 | 1 | 0.7% |
| LCD Monitor VG248 1920x1080 | 1 | 0.7% |
| LCD Monitor SMB2330H | 1 | 0.7% |
| LCD Monitor SHP1447 1920x1080 290x170mm 13.2-inch | 1 | 0.7% |
| LCD Monitor SHP143E 3840x2160 346x194mm 15.6-inch | 1 | 0.7% |
| LCD Monitor SHP13F8 3200x1800 346x194mm 15.6-inch | 1 | 0.7% |
| LCD Monitor SEC4945 1280x800 330x210mm 15.4-inch | 1 | 0.7% |
| LCD Monitor SAM0FF0 3840x2160 1872x1053mm 84.6-inch | 1 | 0.7% |
| LCD Monitor SAM0F14 3840x2160 1872x1053mm 84.6-inch | 1 | 0.7% |
| LCD Monitor SAM0BC9 1920x1080 600x340mm 27.2-inch | 1 | 0.7% |
| LCD Monitor SAM0900 1920x1080 700x390mm 31.5-inch | 1 | 0.7% |
| LCD Monitor SAM07BA 1920x1080 890x500mm 40.2-inch | 1 | 0.7% |
| LCD Monitor PLX2783H 1920x1080 | 1 | 0.7% |
| LCD Monitor PHL 243V7 1920x1080 | 1 | 0.7% |
| LCD Monitor LGD061F 1920x1080 309x174mm 14.0-inch | 1 | 0.7% |
| LCD Monitor LGD0608 1920x1080 309x174mm 14.0-inch | 1 | 0.7% |
| LCD Monitor LGD05EC 1920x1080 309x174mm 14.0-inch | 1 | 0.7% |
| LCD Monitor LGD05E5 1920x1080 344x194mm 15.5-inch | 1 | 0.7% |
| LCD Monitor LGD05DA 1920x1080 309x174mm 14.0-inch | 1 | 0.7% |
| LCD Monitor LGD05D8 1920x1080 344x194mm 15.5-inch | 1 | 0.7% |
| LCD Monitor LGD05BC 3840x2160 309x174mm 14.0-inch | 1 | 0.7% |
| LCD Monitor LGD0573 1920x1080 344x194mm 15.5-inch | 1 | 0.7% |
| LCD Monitor LGD0563 1920x1080 344x194mm 15.5-inch | 1 | 0.7% |
| LCD Monitor LGD053F 1920x1080 344x194mm 15.5-inch | 1 | 0.7% |
| LCD Monitor LGD04E1 1366x768 340x190mm 15.3-inch | 1 | 0.7% |
| LCD Monitor LGD046F 1920x1080 344x194mm 15.5-inch | 1 | 0.7% |
Monitor Resolution
Monitor screen resolution


| Resolution | Computers | Percent |
|---|---|---|
| 1920x1080 (FHD) | 70 | 54.69% |
| 1366x768 (WXGA) | 19 | 14.84% |
| 3840x2160 (4K) | 12 | 9.38% |
| 1680x1050 (WSXGA+) | 4 | 3.13% |
| 2560x1440 (QHD) | 3 | 2.34% |
| 1280x800 (WXGA) | 3 | 2.34% |
| 3440x1440 | 2 | 1.56% |
| 1280x1024 (SXGA) | 2 | 1.56% |
| Unknown | 2 | 1.56% |
| 6400x2160 | 1 | 0.78% |
| 5760x1080 | 1 | 0.78% |
| 4480x1440 | 1 | 0.78% |
| 3200x1800 (QHD+) | 1 | 0.78% |
| 2880x1800 | 1 | 0.78% |
| 2560x1600 | 1 | 0.78% |
| 2560x1080 | 1 | 0.78% |
| 2256x1504 | 1 | 0.78% |
| 1920x1200 (WUXGA) | 1 | 0.78% |
| 1600x900 (HD+) | 1 | 0.78% |
| 1440x900 (WXGA+) | 1 | 0.78% |
Monitor Diagonal
Diagonal size in inches


| Inches | Computers | Percent |
|---|---|---|
| 15 | 35 | 26.12% |
| 13 | 18 | 13.43% |
| Unknown | 12 | 8.96% |
| 14 | 11 | 8.21% |
| 27 | 10 | 7.46% |
| 23 | 10 | 7.46% |
| 21 | 9 | 6.72% |
| 24 | 6 | 4.48% |
| 17 | 5 | 3.73% |
| 18 | 3 | 2.24% |
| 34 | 2 | 1.49% |
| 22 | 2 | 1.49% |
| 12 | 2 | 1.49% |
| 84 | 1 | 0.75% |
| 43 | 1 | 0.75% |
| 42 | 1 | 0.75% |
| 40 | 1 | 0.75% |
| 39 | 1 | 0.75% |
| 31 | 1 | 0.75% |
| 28 | 1 | 0.75% |
| 26 | 1 | 0.75% |
| 25 | 1 | 0.75% |
Monitor Width
Physical width


| Width in mm | Computers | Percent |
|---|---|---|
| 301-350 | 58 | 43.61% |
| 501-600 | 23 | 17.29% |
| 401-500 | 14 | 10.53% |
| Unknown | 12 | 9.02% |
| 201-300 | 10 | 7.52% |
| 601-700 | 5 | 3.76% |
| 351-400 | 4 | 3.01% |
| 801-900 | 2 | 1.5% |
| 701-800 | 2 | 1.5% |
| 901-1000 | 2 | 1.5% |
| 1501-2000 | 1 | 0.75% |
Aspect Ratio
Proportional relationship between the width and the height


| Ratio | Computers | Percent |
|---|---|---|
| 16/9 | 89 | 74.79% |
| Unknown | 12 | 10.08% |
| 16/10 | 10 | 8.4% |
| 3/2 | 3 | 2.52% |
| 21/9 | 3 | 2.52% |
| 5/4 | 2 | 1.68% |
Monitor Area
Area in inch²


| Area in inch² | Computers | Percent |
|---|---|---|
| 101-110 | 35 | 26.32% |
| 81-90 | 22 | 16.54% |
| 201-250 | 18 | 13.53% |
| Unknown | 12 | 9.02% |
| 301-350 | 10 | 7.52% |
| 151-200 | 8 | 6.02% |
| 71-80 | 7 | 5.26% |
| 251-300 | 4 | 3.01% |
| 141-150 | 4 | 3.01% |
| 501-1000 | 4 | 3.01% |
| 351-500 | 3 | 2.26% |
| 61-70 | 2 | 1.5% |
| 121-130 | 2 | 1.5% |
| More than 1000 | 1 | 0.75% |
| 131-140 | 1 | 0.75% |
Pixel Density
Pixels per inch


| Density | Computers | Percent |
|---|---|---|
| 121-160 | 38 | 29.23% |
| 51-100 | 33 | 25.38% |
| 101-120 | 31 | 23.85% |
| 161-240 | 12 | 9.23% |
| Unknown | 12 | 9.23% |
| More than 240 | 4 | 3.08% |
Multiple Monitors
Total monitors connected


| Total | Computers | Percent |
|---|---|---|
| 1 | 100 | 81.3% |
| 2 | 20 | 16.26% |
| 3 | 2 | 1.63% |
| 0 | 1 | 0.81% |
Net Controller Vendor
Controller vendors


| Vendor | Computers | Percent |
|---|---|---|
| Intel | 19 | 59.38% |
| Realtek Semiconductor | 7 | 21.88% |
| Dell | 2 | 6.25% |
| Microchip Technology | 1 | 3.13% |
| Mellanox Technologies | 1 | 3.13% |
| Huawei Technologies | 1 | 3.13% |
| DisplayLink | 1 | 3.13% |
Net Controller Model
Controller models


| Model | Computers | Percent |
|---|---|---|
| Wi-Fi 6 AX200 | 5 | 14.71% |
| I211 Gigabit Network Connection | 5 | 14.71% |
| RTL8153 Gigabit Ethernet Adapter | 4 | 11.76% |
| Wireless 8265 / 8275 | 3 | 8.82% |
| 82579LM Gigabit Network Connection (Lewisville) | 2 | 5.88% |
| RTL8723DE Wireless Network Adapter | 1 | 2.94% |
| RTL8723BU 802.11n WLAN Adapter | 1 | 2.94% |
| RTL8125 2.5GbE Controller | 1 | 2.94% |
| MT26448 [ConnectX EN 10GigE, PCIe 2.0 5GT/s] | 1 | 2.94% |
| ME936 LTE/HSDPA+ 4G modem | 1 | 2.94% |
| I210 Gigabit Network Connection | 1 | 2.94% |
| HTC Hub Controller | 1 | 2.94% |
| F3607gw v2 Mobile Broadband Module | 1 | 2.94% |
| DW5811e Snapdragon X7 LTE | 1 | 2.94% |
| Dell USB3.0 Dock | 1 | 2.94% |
| Centrino Advanced-N 6230 [Rainbow Peak] | 1 | 2.94% |
| Centrino Advanced-N 6205 [Taylor Peak] | 1 | 2.94% |
| 82577LM Gigabit Network Connection | 1 | 2.94% |
| 82566MM Gigabit Network Connection | 1 | 2.94% |
| 82566DM-2 Gigabit Network Connection | 1 | 2.94% |
Net Controller Kind
Ethernet, WiFi or modem


| Kind | Computers | Percent |
|---|---|---|
| Ethernet | 17 | 51.52% |
| WiFi | 13 | 39.39% |
| Modem | 3 | 9.09% |
Used Controller
Currently used network controller


| Kind | Computers | Percent |
|---|---|---|
| Ethernet | 12 | 57.14% |
| WiFi | 9 | 42.86% |
NICs
Total network controllers on board


| Total | Computers | Percent |
|---|---|---|
| 2 | 59 | 47.97% |
| 1 | 59 | 47.97% |
| 3 | 4 | 3.25% |
| 0 | 1 | 0.81% |
Unsupported Devices
Total unsupported devices on board


| Total | Computers | Percent |
|---|---|---|
| 0 | 79 | 64.23% |
| 1 | 35 | 28.46% |
| 2 | 8 | 6.5% |
| 3 | 1 | 0.81% |
Unsupported Device Types
Types of unsupported devices


| Type | Computers | Percent |
|---|---|---|
| Fingerprint reader | 23 | 43.4% |
| Graphics card | 8 | 15.09% |
| Chipcard | 7 | 13.21% |
| Multimedia controller | 4 | 7.55% |
| Net/wireless | 3 | 5.66% |
| Camera | 3 | 5.66% |
| Storage | 1 | 1.89% |
| Sound | 1 | 1.89% |
| Network | 1 | 1.89% |
| Net/ethernet | 1 | 1.89% |
| Bluetooth | 1 | 1.89% |