BlackPanther Hardware Trends (Desktop)
A project to identify most popular hardware characteristics and track their change over time based on data collected by BlackPanther users at https://Linux-Hardware.org.
Anyone can contribute to the study by uploading probes of their computers by the hw-probe tool:
sudo hw-probe -all -uploadFull-feature report is available here: https://linux-hardware.org/?view=trends&formfactor=desktop
Period: Feb, 2020.
Contents
- OS
- OS Family
- Kernel
- Kernel Family
- Kernel Major Ver.
- Arch
- DE
- Display Server
- OS Lang
- Boot Mode
- Filesystem
- Dual Boot with Linux
- Dual Boot (Win)
- Country
- City
- Vendor
- Model
- Model Family
- MFG Year
- Form Factor
- Secure Boot
- Coreboot
- RAM Size
- RAM Used
- Drive Vendor
- Drive Model
- Drive Kind
- Drive Connector
- Drive Size
- Space Total
- Space Used
- Malfunc. Drives
- Malfunc. Drive Vendor
- Malfunc. Drive Kind
- Failed Drives
- Failed Drive Vendor
- Drive Status
- Storage Vendor
- Storage Model
- Storage Kind
- CPU Vendor
- CPU Model
- CPU Model Family
- CPU Cores
- CPU Sockets
- CPU Threads
- CPU Op-Modes
- CPU Microarch
- CPU Microcode
- GPU Vendor
- GPU Model
- GPU Combo
- GPU Driver
- GPU Memory
- Monitor Vendor
- Monitor Model
- Monitor Resolution
- Monitor Diagonal
- Monitor Width
- Aspect Ratio
- Monitor Area
- Pixel Density
- Multiple Monitors
- Net Controller Vendor
- Net Controller Model
- Net Controller Kind
- Used Controller
- NICs
- Unsupported Devices
- Unsupported Device Types
OS
Installed operating systems


| Name | Computers | Percent |
|---|---|---|
| BlackPanther 18.1 | 104 | 95.41% |
| BlackPanther 16.2 | 5 | 4.59% |
OS Family
OS without a version


| Name | Computers | Percent |
|---|---|---|
| BlackPanther | 109 | 100% |
Kernel
Version of the Linux kernel


| Version | Computers | Percent |
|---|---|---|
| 4.18.16-desktop-1bP | 84 | 77.06% |
| 5.1.15-desktop-1bP | 19 | 17.43% |
| 4.9.20-desktop-pae-1bP | 5 | 4.59% |
| 5.1.15-server-1bP | 1 | 0.92% |
Kernel Family
Linux kernel without a distro release


| Version | Computers | Percent |
|---|---|---|
| 4.18.16 | 84 | 77.06% |
| 5.1.15 | 20 | 18.35% |
| 4.9.20 | 5 | 4.59% |
Kernel Major Ver.
Linux kernel major version


| Version | Computers | Percent |
|---|---|---|
| 4.18 | 84 | 77.06% |
| 5.1 | 20 | 18.35% |
| 4.9 | 5 | 4.59% |
Arch
OS architecture (x86_64, i586, etc.)


| Name | Computers | Percent |
|---|---|---|
| x86_64 | 104 | 95.41% |
| i686 | 5 | 4.59% |
DE
Desktop Environment


| Name | Computers | Percent |
|---|---|---|
| KDE5 | 109 | 100% |
Display Server
X11 or Wayland


| Name | Computers | Percent |
|---|---|---|
| X11 | 109 | 100% |
OS Lang
Language


| Lang | Computers | Percent |
|---|---|---|
| Unknown | 109 | 100% |
Boot Mode
EFI or BIOS


| Mode | Computers | Percent |
|---|---|---|
| BIOS | 91 | 83.49% |
| EFI | 18 | 16.51% |
Filesystem
Type of filesystem


| Type | Computers | Percent |
|---|---|---|
| Ext4 | 104 | 95.41% |
| Overlay | 5 | 4.59% |
Dual Boot with Linux
Hosting more than one Linux


| Dual boot | Computers | Percent |
|---|---|---|
| No | 75 | 68.81% |
| Yes | 34 | 31.19% |
Dual Boot (Win)
Hosting Linux and Windows


| Dual boot | Computers | Percent |
|---|---|---|
| Yes | 55 | 50.46% |
| No | 54 | 49.54% |
Country
Geographic location (country)


| Country | Computers | Percent |
|---|---|---|
| Hungary | 84 | 77.06% |
| USA | 6 | 5.5% |
| Germany | 4 | 3.67% |
| UK | 3 | 2.75% |
| Slovakia | 3 | 2.75% |
| Romania | 2 | 1.83% |
| Turkey | 1 | 0.92% |
| Serbia | 1 | 0.92% |
| Poland | 1 | 0.92% |
| Philippines | 1 | 0.92% |
| Greece | 1 | 0.92% |
| France | 1 | 0.92% |
| Australia | 1 | 0.92% |
City
Geographic location (city)


| City | Computers | Percent |
|---|---|---|
| Budapest | 22 | 20.18% |
| Eger | 6 | 5.5% |
| Gödöllő | 4 | 3.67% |
| Pécs | 3 | 2.75% |
| Miskolc | 3 | 2.75% |
| Győr | 3 | 2.75% |
| Debrecen | 3 | 2.75% |
| Szombathely | 2 | 1.83% |
| Szigetszentmiklos | 2 | 1.83% |
| Szentgyorgyvolgy | 2 | 1.83% |
| Regensburg | 2 | 1.83% |
| Oroshaza | 2 | 1.83% |
| Nyiregyhaza | 2 | 1.83% |
| Janoshalma | 2 | 1.83% |
| Hodmezovasarhely | 2 | 1.83% |
| Zalalovo | 1 | 0.92% |
| Wysokie Mazowieckie | 1 | 0.92% |
| Wilmington | 1 | 0.92% |
| Vecses | 1 | 0.92% |
| Tottenham | 1 | 0.92% |
| Tornaľa | 1 | 0.92% |
| Thessaloniki | 1 | 0.92% |
| Tata | 1 | 0.92% |
| Székesfehérvár | 1 | 0.92% |
| Szigethalom | 1 | 0.92% |
| Szabadbattyan | 1 | 0.92% |
| Sumter | 1 | 0.92% |
| Soltvadkert | 1 | 0.92% |
| Seattle | 1 | 0.92% |
| Schweitenkirchen | 1 | 0.92% |
| Sarvar | 1 | 0.92% |
| Sajoszentpeter | 1 | 0.92% |
| Raeford | 1 | 0.92% |
| Pantin | 1 | 0.92% |
| Odorheiu Secuiesc | 1 | 0.92% |
| Nyekladhaza | 1 | 0.92% |
| Novi Knezevac | 1 | 0.92% |
| Mucsony | 1 | 0.92% |
| Monor | 1 | 0.92% |
| Mezokovesd | 1 | 0.92% |
| Levice | 1 | 0.92% |
| Laupheim | 1 | 0.92% |
| Kormend | 1 | 0.92% |
| Kiskoros | 1 | 0.92% |
| Kecskemét | 1 | 0.92% |
| Karcag | 1 | 0.92% |
| Kaposvár | 1 | 0.92% |
| Johnson City | 1 | 0.92% |
| Izmir | 1 | 0.92% |
| Iligan | 1 | 0.92% |
| Hotto | 1 | 0.92% |
| Hayes | 1 | 0.92% |
| Gbelce | 1 | 0.92% |
| Fadd | 1 | 0.92% |
| Dunaharaszti | 1 | 0.92% |
| Csoeroeg | 1 | 0.92% |
| Coburg | 1 | 0.92% |
| Cisnadie | 1 | 0.92% |
| Celldomolk | 1 | 0.92% |
| Brockton | 1 | 0.92% |
Vendor
Motherboard manufacturer


| Name | Computers | Percent |
|---|---|---|
| Gigabyte Technology | 30 | 27.52% |
| ASUSTek Computer | 21 | 19.27% |
| ASRock | 15 | 13.76% |
| Dell | 12 | 11.01% |
| Hewlett-Packard | 6 | 5.5% |
| MSI | 4 | 3.67% |
| Lenovo | 4 | 3.67% |
| Fujitsu | 4 | 3.67% |
| Fujitsu Siemens | 3 | 2.75% |
| Foxconn | 3 | 2.75% |
| Intel | 2 | 1.83% |
| Medion | 1 | 0.92% |
| EMAXX TECHNOLOGY | 1 | 0.92% |
| Biostar | 1 | 0.92% |
| Acer | 1 | 0.92% |
| Unknown | 1 | 0.92% |
Model
Motherboard model


| Name | Computers | Percent |
|---|---|---|
| Gigabyte G31M-ES2L | 3 | 2.75% |
| ASUS All Series | 3 | 2.75% |
| Gigabyte H61M-S1 | 2 | 1.83% |
| Gigabyte B85M-DS3H-A | 2 | 1.83% |
| Fujitsu Siemens ESPRIMO E | 2 | 1.83% |
| Foxconn Pro 3500 Series | 2 | 1.83% |
| Dell OptiPlex 3020 | 2 | 1.83% |
| ASRock FM2A75M Pro4+ | 2 | 1.83% |
| MSI MS-7A74 | 1 | 0.92% |
| MSI MS-7883 | 1 | 0.92% |
| MSI MS-7309 | 1 | 0.92% |
| MSI MS-7235 | 1 | 0.92% |
| Medion BTDD-LT | 1 | 0.92% |
| Lenovo ThinkStation D20 4158AF8 | 1 | 0.92% |
| Lenovo ThinkCentre M92P 32371L5 | 1 | 0.92% |
| Lenovo ThinkCentre M91p 7005A97 | 1 | 0.92% |
| Lenovo ThinkCentre A58 75227MG | 1 | 0.92% |
| Intel Nobilis | 1 | 0.92% |
| Intel DH61CR AAG14064-208 | 1 | 0.92% |
| HP t520 Flexible Series TC | 1 | 0.92% |
| HP Slim Desktop 290-a0xxx | 1 | 0.92% |
| HP Pavilion Power Desktop 580-1xx | 1 | 0.92% |
| HP Compaq dc5800 Small Form Factor | 1 | 0.92% |
| HP Compaq 8000 Elite SFF PC | 1 | 0.92% |
| HP 610-1015xt | 1 | 0.92% |
| Gigabyte Z270X-Ultra Gaming | 1 | 0.92% |
| Gigabyte P35C-DS3R | 1 | 0.92% |
| Gigabyte P35-DS3L | 1 | 0.92% |
| Gigabyte P35-DQ6 | 1 | 0.92% |
| Gigabyte M61SME-S2L | 1 | 0.92% |
| Gigabyte H81M-S2PV | 1 | 0.92% |
| Gigabyte H81M-S1 | 1 | 0.92% |
| Gigabyte H310M H 2.0 | 1 | 0.92% |
| Gigabyte GA-MA790GP-DS4H | 1 | 0.92% |
| Gigabyte GA-MA770-UD3 | 1 | 0.92% |
| Gigabyte G31M-ES2C | 1 | 0.92% |
| Gigabyte F2A88XM-HD3 | 1 | 0.92% |
| Gigabyte F2A88XM-D3HP | 1 | 0.92% |
| Gigabyte F2A88XM-D3H | 1 | 0.92% |
| Gigabyte F2A78M-DS2 | 1 | 0.92% |
| Gigabyte F2A68HM-DS2 | 1 | 0.92% |
| Gigabyte F2A55M-DS2 | 1 | 0.92% |
| Gigabyte EP45C-DS3 | 1 | 0.92% |
| Gigabyte EP45-UD3LR | 1 | 0.92% |
| Gigabyte EP31-DS3L | 1 | 0.92% |
| Gigabyte B85M-D3H | 1 | 0.92% |
| Gigabyte B250M-D2V | 1 | 0.92% |
| Gigabyte 8I945P-G | 1 | 0.92% |
| Fujitsu Siemens ESPRIMO E5730 | 1 | 0.92% |
| Fujitsu PRIMERGY TX100 S2 | 1 | 0.92% |
| Fujitsu ESPRIMO P400 | 1 | 0.92% |
| Fujitsu ESPRIMO P1500 | 1 | 0.92% |
| Fujitsu CELSIUS M470 | 1 | 0.92% |
| Foxconn H55M-S | 1 | 0.92% |
| EMAXX TECHNOLOGY EMX-A70FM2+iCafe | 1 | 0.92% |
| Dell Precision WorkStation T3500 | 1 | 0.92% |
| Dell OptiPlex 790 | 1 | 0.92% |
| Dell OptiPlex 780 | 1 | 0.92% |
| Dell OptiPlex 760 | 1 | 0.92% |
| Dell OptiPlex 755 | 1 | 0.92% |
Model Family
Motherboard model prefix


| Name | Computers | Percent |
|---|---|---|
| Dell OptiPlex | 11 | 10.09% |
| Lenovo ThinkCentre | 3 | 2.75% |
| Gigabyte G31M-ES2L | 3 | 2.75% |
| Fujitsu Siemens ESPRIMO | 3 | 2.75% |
| ASUS All | 3 | 2.75% |
| HP Compaq | 2 | 1.83% |
| Gigabyte H61M-S1 | 2 | 1.83% |
| Gigabyte B85M-DS3H-A | 2 | 1.83% |
| Fujitsu ESPRIMO | 2 | 1.83% |
| Foxconn Pro | 2 | 1.83% |
| ASUS ROG | 2 | 1.83% |
| ASUS P5KPL-AM | 2 | 1.83% |
| ASRock FM2A75M | 2 | 1.83% |
| MSI MS-7A74 | 1 | 0.92% |
| MSI MS-7883 | 1 | 0.92% |
| MSI MS-7309 | 1 | 0.92% |
| MSI MS-7235 | 1 | 0.92% |
| Medion BTDD-LT | 1 | 0.92% |
| Lenovo ThinkStation | 1 | 0.92% |
| Intel Nobilis | 1 | 0.92% |
| Intel DH61CR | 1 | 0.92% |
| HP t520 | 1 | 0.92% |
| HP Slim | 1 | 0.92% |
| HP Pavilion | 1 | 0.92% |
| HP 610-1015xt | 1 | 0.92% |
| Gigabyte Z270X-Ultra | 1 | 0.92% |
| Gigabyte P35C-DS3R | 1 | 0.92% |
| Gigabyte P35-DS3L | 1 | 0.92% |
| Gigabyte P35-DQ6 | 1 | 0.92% |
| Gigabyte M61SME-S2L | 1 | 0.92% |
| Gigabyte H81M-S2PV | 1 | 0.92% |
| Gigabyte H81M-S1 | 1 | 0.92% |
| Gigabyte H310M | 1 | 0.92% |
| Gigabyte GA-MA790GP-DS4H | 1 | 0.92% |
| Gigabyte GA-MA770-UD3 | 1 | 0.92% |
| Gigabyte G31M-ES2C | 1 | 0.92% |
| Gigabyte F2A88XM-HD3 | 1 | 0.92% |
| Gigabyte F2A88XM-D3HP | 1 | 0.92% |
| Gigabyte F2A88XM-D3H | 1 | 0.92% |
| Gigabyte F2A78M-DS2 | 1 | 0.92% |
| Gigabyte F2A68HM-DS2 | 1 | 0.92% |
| Gigabyte F2A55M-DS2 | 1 | 0.92% |
| Gigabyte EP45C-DS3 | 1 | 0.92% |
| Gigabyte EP45-UD3LR | 1 | 0.92% |
| Gigabyte EP31-DS3L | 1 | 0.92% |
| Gigabyte B85M-D3H | 1 | 0.92% |
| Gigabyte B250M-D2V | 1 | 0.92% |
| Gigabyte 8I945P-G | 1 | 0.92% |
| Fujitsu PRIMERGY | 1 | 0.92% |
| Fujitsu CELSIUS | 1 | 0.92% |
| Foxconn H55M-S | 1 | 0.92% |
| EMAXX TECHNOLOGY EMX-A70FM2+iCafe | 1 | 0.92% |
| Dell Precision | 1 | 0.92% |
| Biostar A68N-5600 | 1 | 0.92% |
| ASUS Rampage | 1 | 0.92% |
| ASUS PRIME | 1 | 0.92% |
| ASUS P7P55D-E | 1 | 0.92% |
| ASUS P5QL-E | 1 | 0.92% |
| ASUS P5QL | 1 | 0.92% |
| ASUS P5QC | 1 | 0.92% |
MFG Year
Motherboard manufacture year


| Year | Computers | Percent |
|---|---|---|
| 2010 | 13 | 11.93% |
| 2018 | 12 | 11.01% |
| 2015 | 11 | 10.09% |
| 2014 | 11 | 10.09% |
| 2011 | 11 | 10.09% |
| 2009 | 10 | 9.17% |
| 2008 | 10 | 9.17% |
| 2012 | 7 | 6.42% |
| 2019 | 6 | 5.5% |
| 2013 | 6 | 5.5% |
| 2007 | 4 | 3.67% |
| 2016 | 3 | 2.75% |
| 2017 | 2 | 1.83% |
| 2005 | 2 | 1.83% |
| 2006 | 1 | 0.92% |
Form Factor
Physical design of the computer


| Name | Computers | Percent |
|---|---|---|
| Desktop | 109 | 100% |
Secure Boot
Enabled or disabled


| State | Computers | Percent |
|---|---|---|
| Disabled | 109 | 100% |
Coreboot
Have coreboot on board


| Used | Computers | Percent |
|---|---|---|
| No | 109 | 100% |
RAM Size
Total RAM memory


| Size in GB | Computers | Percent |
|---|---|---|
| 3.01-4.0 | 44 | 40.37% |
| 8.01-16.0 | 28 | 25.69% |
| 4.01-8.0 | 13 | 11.93% |
| 16.01-24.0 | 12 | 11.01% |
| 1.01-2.0 | 9 | 8.26% |
| 2.01-3.0 | 2 | 1.83% |
| 32.01-64.0 | 1 | 0.92% |
RAM Used
Used RAM memory


| Used GB | Computers | Percent |
|---|---|---|
| 0.01-1.0 | 59 | 54.13% |
| 1.01-2.0 | 37 | 33.94% |
| 2.01-3.0 | 11 | 10.09% |
| 3.01-4.0 | 2 | 1.83% |
Drive Vendor
Hard drive vendors


| Vendor | Computers | Drives | Percent |
|---|---|---|---|
| WDC | 42 | 52 | 24.14% |
| Seagate | 36 | 42 | 20.69% |
| Samsung Electronics | 22 | 26 | 12.64% |
| Kingston | 16 | 21 | 9.2% |
| Toshiba | 11 | 12 | 6.32% |
| Hitachi | 10 | 11 | 5.75% |
| SanDisk | 6 | 8 | 3.45% |
| A-DATA Technology | 4 | 5 | 2.3% |
| Patriot | 3 | 3 | 1.72% |
| Hewlett-Packard | 3 | 3 | 1.72% |
| Micron Technology | 2 | 2 | 1.15% |
| Crucial | 2 | 2 | 1.15% |
| Zheino | 1 | 1 | 0.57% |
| XPG | 1 | 1 | 0.57% |
| WDC WD40 | 1 | 1 | 0.57% |
| Unknown | 1 | 1 | 0.57% |
| Transcend | 1 | 1 | 0.57% |
| SPCC | 1 | 1 | 0.57% |
| SK Hynix | 1 | 1 | 0.57% |
| Phison | 1 | 1 | 0.57% |
| LITEON | 1 | 1 | 0.57% |
| JMicron | 1 | 1 | 0.57% |
| Intel | 1 | 1 | 0.57% |
| HGST | 1 | 1 | 0.57% |
| Gigabyte Technology | 1 | 1 | 0.57% |
| Generic | 1 | 1 | 0.57% |
| Corsair | 1 | 1 | 0.57% |
| BIWIN | 1 | 1 | 0.57% |
| Apacer | 1 | 1 | 0.57% |
Drive Model
Hard drive models


| Model | Computers | Percent |
|---|---|---|
| ST500DM002-1BD142 500GB | 5 | 2.46% |
| DT01ACA100 1TB | 5 | 2.46% |
| SA400S37240G 240GB SSD | 4 | 1.97% |
| WD10EZEX-22MFCA0 1TB | 3 | 1.48% |
| SV300S37A240G 240GB SSD | 3 | 1.48% |
| SUV400S37120G 120GB SSD | 3 | 1.48% |
| ST380815AS 80GB | 3 | 1.48% |
| ST3250318AS 250GB | 3 | 1.48% |
| SA400S37120G 120GB SSD | 3 | 1.48% |
| HDS721010CLA332 1TB | 3 | 1.48% |
| DT01ACA200 2TB | 3 | 1.48% |
| DT01ACA050 500GB | 3 | 1.48% |
| WDS240G2G0B-00EPW0 240GB SSD | 2 | 0.99% |
| WD10EZRZ-00HTKB0 1TB | 2 | 0.99% |
| WD10EZEX-08WN4A0 1TB | 2 | 0.99% |
| SU630 240GB SSD | 2 | 0.99% |
| STM3250318AS 250GB | 2 | 0.99% |
| ST4000DM004-2CV104 4TB | 2 | 0.99% |
| ST3320311CS 320GB | 2 | 0.99% |
| ST1000LM024 HN-M101MBB 1TB | 2 | 0.99% |
| SSD PLUS 240GB | 2 | 0.99% |
| SDSSDH3250G 250GB | 2 | 0.99% |
| WDS500G2X0C-00L350 500GB | 1 | 0.49% |
| WDS240G2G0A-00JH30 240GB SSD | 1 | 0.49% |
| WDS120G2G0A-00JH30 120GB SSD | 1 | 0.49% |
| WD800JD-60LSA5 80GB | 1 | 0.49% |
| WD800JB-00JJC0 80GB | 1 | 0.49% |
| WD7501AALS-00E3A0 752GB | 1 | 0.49% |
| WD6400AAVS-00G9B1 640GB | 1 | 0.49% |
| WD5000LPCX-60VHAT0 500GB | 1 | 0.49% |
| WD5000BPKT-75PK4T0 500GB | 1 | 0.49% |
| WD5000AVCS-632DY1 500GB | 1 | 0.49% |
| WD5000AAKX-75U6AA0 500GB | 1 | 0.49% |
| WD5000AAKX-60U6AA0 500GB | 1 | 0.49% |
| WD5000AAKX-22ERMA0 500GB | 1 | 0.49% |
| WD5000AAKX-07U6AA0 500GB | 1 | 0.49% |
| WD5000AAKS-08WWPA0 500GB | 1 | 0.49% |
| WD5000AAKS-00UU3A0 500GB | 1 | 0.49% |
| WD5000AAKS-007AA0 500GB | 1 | 0.49% |
| WD5000AADS-00S9B0 500GB | 1 | 0.49% |
| WD3200AAKS-00UU3A0 320GB | 1 | 0.49% |
| WD3200AAJS-00L7A0 320GB | 1 | 0.49% |
| WD30EZRX-00DC0B0 3TB | 1 | 0.49% |
| WD30EFRX-68EUZN0 3TB | 1 | 0.49% |
| WD2500JS-55NCB1 250GB | 1 | 0.49% |
| WD20EZRX-22D8PB0 2TB | 1 | 0.49% |
| WD20EFRX-68EUZN0 2TB | 1 | 0.49% |
| WD20EARX-008FB0 2TB | 1 | 0.49% |
| WD20EARS-60MVWB0 2TB | 1 | 0.49% |
| WD20EARS-00J2GB0 2TB | 1 | 0.49% |
| WD20EADS-00S2B0 2TB | 1 | 0.49% |
| WD2000JB-00GVA0 200GB | 1 | 0.49% |
| WD1600BEVT-22A23T0 160GB | 1 | 0.49% |
| WD1600AAJS-07M0A0 160GB | 1 | 0.49% |
| WD1600AAJS-00B4A0 160GB | 1 | 0.49% |
| WD10JPVX-22JC3T0 1TB | 1 | 0.49% |
| WD10EZRX-00L4HB0 1TB | 1 | 0.49% |
| WD10EZRX-00A8LB0 1TB | 1 | 0.49% |
| WD10EZEX-75WN4A0 1TB | 1 | 0.49% |
| WD10EZEX-60WN4A0 1TB | 1 | 0.49% |
Drive Kind
HDD or SSD


| Kind | Computers | Drives | Percent |
|---|---|---|---|
| HDD | 93 | 129 | 61.59% |
| SSD | 45 | 61 | 29.8% |
| NVMe | 10 | 11 | 6.62% |
| Unknown | 3 | 3 | 1.99% |
Drive Connector
SATA, SAS, NVMe, etc.


| Type | Computers | Drives | Percent |
|---|---|---|---|
| SATA | 108 | 184 | 85.71% |
| NVMe | 10 | 11 | 7.94% |
| SAS | 8 | 9 | 6.35% |
Drive Size
Size of hard drive


| Size in TB | Computers | Drives | Percent |
|---|---|---|---|
| 0.01-0.5 | 93 | 133 | 61.18% |
| 0.51-1.0 | 41 | 48 | 26.97% |
| 1.01-2.0 | 12 | 16 | 7.89% |
| 3.01-4.0 | 3 | 4 | 1.97% |
| 2.01-3.0 | 3 | 3 | 1.97% |
Space Total
Amount of disk space available on the file system


| Size in GB | Computers | Percent |
|---|---|---|
| 101-250 | 35 | 32.11% |
| 251-500 | 20 | 18.35% |
| 21-50 | 16 | 14.68% |
| 501-1000 | 11 | 10.09% |
| 51-100 | 11 | 10.09% |
| 1001-2000 | 7 | 6.42% |
| Unknown | 5 | 4.59% |
| More than 3000 | 3 | 2.75% |
| 1-20 | 1 | 0.92% |
Space Used
Amount of used disk space


| Used GB | Computers | Percent |
|---|---|---|
| 1-20 | 68 | 62.39% |
| 21-50 | 18 | 16.51% |
| 501-1000 | 6 | 5.5% |
| 51-100 | 6 | 5.5% |
| Unknown | 5 | 4.59% |
| 101-250 | 3 | 2.75% |
| More than 3000 | 1 | 0.92% |
| 251-500 | 1 | 0.92% |
| 2001-3000 | 1 | 0.92% |
Malfunc. Drives
Drive models with a malfunction


| Model | Computers | Drives | Percent |
|---|---|---|---|
| ST500DM002-1BD142 500GB | 3 | 3 | 6.25% |
| HDS721010CLA332 1TB | 3 | 3 | 6.25% |
| DT01ACA050 500GB | 2 | 2 | 4.17% |
| WD800JB-00JJC0 80GB | 1 | 1 | 2.08% |
| WD6400AAVS-00G9B1 640GB | 1 | 1 | 2.08% |
| WD5000AAKX-75U6AA0 500GB | 1 | 1 | 2.08% |
| WD5000AAKX-60U6AA0 500GB | 1 | 1 | 2.08% |
| WD5000AAKS-00UU3A0 500GB | 1 | 1 | 2.08% |
| WD5000AAKS-007AA0 500GB | 1 | 1 | 2.08% |
| WD3200AAKS-00UU3A0 320GB | 1 | 1 | 2.08% |
| WD3200AAJS-00L7A0 320GB | 1 | 1 | 2.08% |
| WD30EFRX-68EUZN0 3TB | 1 | 1 | 2.08% |
| WD20EFRX-68EUZN0 2TB | 1 | 1 | 2.08% |
| WD20EARS-60MVWB0 2TB | 1 | 1 | 2.08% |
| WD20EARS-00J2GB0 2TB | 1 | 1 | 2.08% |
| WD20EADS-00S2B0 2TB | 1 | 1 | 2.08% |
| WD2000JB-00GVA0 200GB | 1 | 1 | 2.08% |
| WD10EZEX-75WN4A0 1TB | 1 | 1 | 2.08% |
| WD10EZEX-22MFCA0 1TB | 1 | 1 | 2.08% |
| WD10EZEX-08WN4A0 1TB | 1 | 1 | 2.08% |
| WD10EARS-00Y5B1 1TB | 1 | 1 | 2.08% |
| WD10EARS-00MVWB0 1TB | 1 | 1 | 2.08% |
| VB0250EAVER 250GB | 1 | 1 | 2.08% |
| STM3250318AS 250GB | 1 | 1 | 2.08% |
| ST500LM021-1KJ152 500GB | 1 | 1 | 2.08% |
| ST3320613AS 320GB | 1 | 1 | 2.08% |
| ST3250318AS 250GB | 1 | 1 | 2.08% |
| ST3120026AS 120GB | 1 | 1 | 2.08% |
| ST2000LM007-1R8174 2TB | 1 | 1 | 2.08% |
| SP1614C 160GB | 1 | 1 | 2.08% |
| SHPM2280P2H 480G SSD | 1 | 1 | 2.08% |
| SC210 2.5 7MM 128GB SSD | 1 | 1 | 2.08% |
| HTS545025B9A300 250GB | 1 | 1 | 2.08% |
| HTS543232A7A384 320GB | 1 | 1 | 2.08% |
| HDT721010SLA360 1TB | 1 | 1 | 2.08% |
| HDS721050CLA362 500GB | 1 | 1 | 2.08% |
| HDS721032CLA362 320GB | 1 | 1 | 2.08% |
| HD642JJ 640GB | 1 | 1 | 2.08% |
| HD160HJ 160GB | 1 | 1 | 2.08% |
| HD103UJ 1TB | 1 | 1 | 2.08% |
| HD103SI 1TB | 1 | 1 | 2.08% |
| HD080HJ 80GB | 1 | 1 | 2.08% |
| DT01ACA100 1TB | 1 | 1 | 2.08% |
Malfunc. Drive Vendor
Vendors of faulty drives


| Vendor | Computers | Drives | Percent |
|---|---|---|---|
| WDC | 17 | 19 | 38.64% |
| Seagate | 9 | 9 | 20.45% |
| Hitachi | 7 | 8 | 15.91% |
| Samsung Electronics | 5 | 6 | 11.36% |
| Toshiba | 3 | 3 | 6.82% |
| SK Hynix | 1 | 1 | 2.27% |
| Kingston | 1 | 1 | 2.27% |
| Hewlett-Packard | 1 | 1 | 2.27% |
Malfunc. Drive Kind
Kinds of faulty drives


| Kind | Computers | Drives | Percent |
|---|---|---|---|
| HDD | 37 | 46 | 94.87% |
| SSD | 2 | 2 | 5.13% |
Failed Drives
Failed drive models


| Model | Computers | Drives | Percent |
|---|---|---|---|
| ST380815AS 80GB | 1 | 1 | 100% |
Failed Drive Vendor
Failed drive vendors


| Vendor | Computers | Drives | Percent |
|---|---|---|---|
| Seagate | 1 | 1 | 100% |
Drive Status
Number of failed and malfunc. drives


| Status | Computers | Drives | Percent |
|---|---|---|---|
| Works | 80 | 132 | 57.97% |
| Malfunc | 39 | 48 | 28.26% |
| Detected | 18 | 23 | 13.04% |
| Failed | 1 | 1 | 0.72% |
Storage Vendor
Storage controller vendors


| Vendor | Computers | Percent |
|---|---|---|
| Intel | 81 | 59.56% |
| AMD | 21 | 15.44% |
| JMicron Technology | 9 | 6.62% |
| Nvidia | 7 | 5.15% |
| Marvell Technology Group | 7 | 5.15% |
| Silicon Motion | 2 | 1.47% |
| Samsung Electronics | 2 | 1.47% |
| Phison Electronics | 2 | 1.47% |
| Sandisk | 1 | 0.74% |
| Realtek Semiconductor | 1 | 0.74% |
| Micron Technology | 1 | 0.74% |
| Kingston Technology Company | 1 | 0.74% |
| ASMedia Technology | 1 | 0.74% |
Storage Model
Storage controller models


| Model | Computers | Percent |
|---|---|---|
| NM10/ICH7 Family SATA Controller [IDE mode] | 17 | 8.85% |
| FCH SATA Controller [AHCI mode] | 13 | 6.77% |
| 82801G (ICH7 Family) IDE Controller | 12 | 6.25% |
| 8 Series/C220 Series Chipset Family 6-port SATA Controller 1 [AHCI mode] | 9 | 4.69% |
| 200 Series PCH SATA controller [AHCI mode] | 8 | 4.17% |
| 6 Series/C200 Series Chipset Family 6 port Desktop SATA AHCI Controller | 7 | 3.65% |
| 82801I (ICH9 Family) 2 port SATA Controller [IDE mode] | 6 | 3.13% |
| FCH IDE Controller | 5 | 2.6% |
| 82801JI (ICH10 Family) 4 port SATA IDE Controller #1 | 5 | 2.6% |
| 82801JI (ICH10 Family) 2 port SATA IDE Controller #2 | 5 | 2.6% |
| SATA Controller [RAID mode] | 4 | 2.08% |
| JMB368 IDE controller | 4 | 2.08% |
| JMB363 SATA/IDE Controller | 4 | 2.08% |
| 82801IR/IO/IH (ICH9R/DO/DH) 4 port SATA Controller [IDE mode] | 4 | 2.08% |
| SB7x0/SB8x0/SB9x0 SATA Controller [IDE mode] | 3 | 1.56% |
| SB7x0/SB8x0/SB9x0 IDE Controller | 3 | 1.56% |
| Non-Volatile memory controller | 3 | 1.56% |
| MCP61 SATA Controller | 3 | 1.56% |
| MCP61 IDE | 3 | 1.56% |
| FCH SATA Controller [IDE mode] | 3 | 1.56% |
| 88SE6111/6121 SATA II / PATA Controller | 3 | 1.56% |
| 82801HR/HO/HH (ICH8R/DO/DH) 2 port SATA Controller [IDE mode] | 3 | 1.56% |
| 82801H (ICH8 Family) 4 port SATA Controller [IDE mode] | 3 | 1.56% |
| 5 Series/3400 Series Chipset 6 port SATA AHCI Controller | 3 | 1.56% |
| Q170/Q150/B150/H170/H110/Z170/CM236 Chipset SATA Controller [AHCI Mode] | 2 | 1.04% |
| NVMe SSD Controller SM981/PM981/PM983 | 2 | 1.04% |
| Atom Processor E3800 Series SATA AHCI Controller | 2 | 1.04% |
| 82801JI (ICH10 Family) SATA AHCI Controller | 2 | 1.04% |
| 82801JD/DO (ICH10 Family) 4-port SATA IDE Controller | 2 | 1.04% |
| 82801JD/DO (ICH10 Family) 2-port SATA IDE Controller | 2 | 1.04% |
| 82801IB (ICH9) 2 port SATA Controller [IDE mode] | 2 | 1.04% |
| 6 Series/C200 Series Chipset Family Desktop SATA Controller (IDE mode, ports 4-5) | 2 | 1.04% |
| 6 Series/C200 Series Chipset Family Desktop SATA Controller (IDE mode, ports 0-3) | 2 | 1.04% |
| 4 Series Chipset PT IDER Controller | 2 | 1.04% |
| X370 Series Chipset SATA Controller | 1 | 0.52% |
| WD Black 2018/PC SN720 NVMe SSD | 1 | 0.52% |
| SSD Pro 7600p/760p/E 6100p Series | 1 | 0.52% |
| SSD 660P Series | 1 | 0.52% |
| SB7x0/SB8x0/SB9x0 SATA Controller [AHCI mode] | 1 | 0.52% |
| SB600 Non-Raid-5 SATA | 1 | 0.52% |
| SB600 IDE | 1 | 0.52% |
| Realtek Non-Volatile memory controller | 1 | 0.52% |
| NM10/ICH7 Family SATA Controller [AHCI mode] | 1 | 0.52% |
| nForce3 Serial ATA Controller | 1 | 0.52% |
| MV64460/64461/64462 System Controller, Revision B | 1 | 0.52% |
| MCP78S [GeForce 8200] SATA Controller (non-AHCI mode) | 1 | 0.52% |
| MCP78S [GeForce 8200] IDE | 1 | 0.52% |
| MCP51 Serial ATA Controller | 1 | 0.52% |
| JMB362 SATA Controller | 1 | 0.52% |
| GeForce 7100/nForce 630i SATA | 1 | 0.52% |
| FCH SATA Controller D | 1 | 0.52% |
| E7 NVMe Controller | 1 | 0.52% |
| E12 NVMe Controller | 1 | 0.52% |
| Digital HyperX Predator | 1 | 0.52% |
| CK8S Parallel ATA Controller (v2.5) | 1 | 0.52% |
| Cannon Lake PCH SATA AHCI Controller | 1 | 0.52% |
| C610/X99 series chipset sSATA Controller [AHCI mode] | 1 | 0.52% |
| C610/X99 series chipset 6-Port SATA Controller [AHCI mode] | 1 | 0.52% |
| ASM1062 Serial ATA Controller | 1 | 0.52% |
| 9 Series Chipset Family SATA Controller [AHCI Mode] | 1 | 0.52% |
Storage Kind
Kind of storage controller (IDE, SATA, NVMe, SAS, ...)


| Kind | Computers | Percent |
|---|---|---|
| SATA | 62 | 46.97% |
| IDE | 55 | 41.67% |
| NVMe | 10 | 7.58% |
| RAID | 5 | 3.79% |
CPU Vendor
Processor vendors


| Vendor | Computers | Percent |
|---|---|---|
| Intel | 82 | 75.23% |
| AMD | 27 | 24.77% |
CPU Model
Processor models


| Model | Computers | Percent |
|---|---|---|
| Intel Core 2 Duo CPU E8400 @ 3.00GHz | 4 | 3.67% |
| Intel Core 2 Quad CPU Q6600 @ 2.40GHz | 3 | 2.75% |
| Intel Core 2 Duo CPU E7300 @ 2.66GHz | 3 | 2.75% |
| Intel Xeon CPU E5440 @ 2.83GHz | 2 | 1.83% |
| Intel Pentium Dual-Core CPU E6500 @ 2.93GHz | 2 | 1.83% |
| Intel Pentium Dual-Core CPU E5700 @ 3.00GHz | 2 | 1.83% |
| Intel Pentium CPU G4560 @ 3.50GHz | 2 | 1.83% |
| Intel Core i5-4460 CPU @ 3.20GHz | 2 | 1.83% |
| Intel Core i5-2400 CPU @ 3.10GHz | 2 | 1.83% |
| Intel Core i3-8350K CPU @ 4.00GHz | 2 | 1.83% |
| Intel Core i3-4160 CPU @ 3.60GHz | 2 | 1.83% |
| Intel Core i3-3220 CPU @ 3.30GHz | 2 | 1.83% |
| Intel Core 2 Quad CPU Q8300 @ 2.50GHz | 2 | 1.83% |
| Intel Core 2 Duo CPU E7500 @ 2.93GHz | 2 | 1.83% |
| Intel Core 2 CPU 6300 @ 1.86GHz | 2 | 1.83% |
| AMD Athlon 64 X2 Dual Core Processor 4800+ | 2 | 1.83% |
| AMD A8-6600K APU with Radeon HD Graphics | 2 | 1.83% |
| AMD A6-5400K APU with Radeon HD Graphics | 2 | 1.83% |
| AMD A4-6300 APU with Radeon HD Graphics | 2 | 1.83% |
| Intel Xeon CPU X5677 @ 3.47GHz | 1 | 0.92% |
| Intel Xeon CPU X5450 @ 3.00GHz | 1 | 0.92% |
| Intel Xeon CPU W3550 @ 3.07GHz | 1 | 0.92% |
| Intel Xeon CPU W3530 @ 2.80GHz | 1 | 0.92% |
| Intel Pentium Gold G5400 CPU @ 3.70GHz | 1 | 0.92% |
| Intel Pentium Dual-Core CPU E5800 @ 3.20GHz | 1 | 0.92% |
| Intel Pentium Dual-Core CPU E5500 @ 2.80GHz | 1 | 0.92% |
| Intel Pentium Dual-Core CPU E5400 @ 2.70GHz | 1 | 0.92% |
| Intel Pentium Dual-Core CPU E5200 @ 2.50GHz | 1 | 0.92% |
| Intel Pentium Dual CPU E2180 @ 2.00GHz | 1 | 0.92% |
| Intel Pentium Dual CPU E2160 @ 1.80GHz | 1 | 0.92% |
| Intel Pentium CPU J2900 @ 2.41GHz | 1 | 0.92% |
| Intel Pentium CPU G840 @ 2.80GHz | 1 | 0.92% |
| Intel Pentium CPU G4500 @ 3.50GHz | 1 | 0.92% |
| Intel Pentium CPU G3220 @ 3.00GHz | 1 | 0.92% |
| Intel Pentium 4 CPU 3.00GHz | 1 | 0.92% |
| Intel Pentium 4 CPU 2.80GHz | 1 | 0.92% |
| Intel Core i7-8700K CPU @ 3.70GHz | 1 | 0.92% |
| Intel Core i7-8700 CPU @ 3.20GHz | 1 | 0.92% |
| Intel Core i7-5930K CPU @ 3.50GHz | 1 | 0.92% |
| Intel Core i7-4790K CPU @ 4.00GHz | 1 | 0.92% |
| Intel Core i7-2600 CPU @ 3.40GHz | 1 | 0.92% |
| Intel Core i5-7500 CPU @ 3.40GHz | 1 | 0.92% |
| Intel Core i5-7400 CPU @ 3.00GHz | 1 | 0.92% |
| Intel Core i5-6500 CPU @ 3.20GHz | 1 | 0.92% |
| Intel Core i5-4590 CPU @ 3.30GHz | 1 | 0.92% |
| Intel Core i5-4570 CPU @ 3.20GHz | 1 | 0.92% |
| Intel Core i5-3470T CPU @ 2.90GHz | 1 | 0.92% |
| Intel Core i5-2320 CPU @ 3.00GHz | 1 | 0.92% |
| Intel Core i5 CPU 760 @ 2.80GHz | 1 | 0.92% |
| Intel Core i5 CPU 670 @ 3.47GHz | 1 | 0.92% |
| Intel Core i3-7100 CPU @ 3.90GHz | 1 | 0.92% |
| Intel Core i3-6100T CPU @ 3.20GHz | 1 | 0.92% |
| Intel Core i3-4330 CPU @ 3.50GHz | 1 | 0.92% |
| Intel Core i3-4130 CPU @ 3.40GHz | 1 | 0.92% |
| Intel Core i3-2100 CPU @ 3.10GHz | 1 | 0.92% |
| Intel Core i3 CPU 550 @ 3.20GHz | 1 | 0.92% |
| Intel Core i3 CPU 540 @ 3.07GHz | 1 | 0.92% |
| Intel Core 2 Quad CPU Q9400 @ 2.66GHz | 1 | 0.92% |
| Intel Core 2 Quad CPU Q8200 @ 2.33GHz | 1 | 0.92% |
| Intel Core 2 Duo CPU E8500 @ 3.16GHz | 1 | 0.92% |
CPU Model Family
Processor model prefix


| Model | Computers | Percent |
|---|---|---|
| Intel Core i5 | 13 | 11.93% |
| Intel Core i3 | 13 | 11.93% |
| Intel Core 2 Duo | 13 | 11.93% |
| Intel Pentium Dual-Core | 8 | 7.34% |
| Intel Core 2 Quad | 7 | 6.42% |
| Intel Xeon | 6 | 5.5% |
| Intel Pentium | 6 | 5.5% |
| Intel Core i7 | 5 | 4.59% |
| Intel Celeron | 4 | 3.67% |
| AMD A6 | 3 | 2.75% |
| AMD A4 | 3 | 2.75% |
| Intel Pentium Dual | 2 | 1.83% |
| Intel Pentium 4 | 2 | 1.83% |
| Intel Core 2 | 2 | 1.83% |
| AMD Phenom II X4 | 2 | 1.83% |
| AMD Athlon 64 X2 | 2 | 1.83% |
| AMD A8 | 2 | 1.83% |
| AMD A10 | 2 | 1.83% |
| Other | 1 | 0.92% |
| Intel Pentium Gold | 1 | 0.92% |
| AMD Ryzen 7 | 1 | 0.92% |
| AMD Ryzen 5 | 1 | 0.92% |
| AMD Ryzen 3 | 1 | 0.92% |
| AMD Phenom II X2 | 1 | 0.92% |
| AMD GX | 1 | 0.92% |
| AMD FX | 1 | 0.92% |
| AMD Athlon X4 | 1 | 0.92% |
| AMD Athlon II X4 | 1 | 0.92% |
| AMD Athlon II X3 | 1 | 0.92% |
| AMD Athlon II X2 | 1 | 0.92% |
| AMD Athlon 64 | 1 | 0.92% |
| AMD Athlon | 1 | 0.92% |
CPU Cores
Number of processor cores


| Number | Computers | Percent |
|---|---|---|
| 2 | 57 | 52.29% |
| 4 | 35 | 32.11% |
| 1 | 12 | 11.01% |
| 6 | 3 | 2.75% |
| 8 | 1 | 0.92% |
| 3 | 1 | 0.92% |
CPU Sockets
Number of sockets


| Number | Computers | Percent |
|---|---|---|
| 1 | 109 | 100% |
CPU Threads
Threads per core (Hyper-Threading)


| Number | Computers | Percent |
|---|---|---|
| 1 | 71 | 65.14% |
| 2 | 38 | 34.86% |
CPU Op-Modes
CPU Operation Modes (32-bit, 64-bit)


| Op mode | Computers | Percent |
|---|---|---|
| 32-bit, 64-bit | 108 | 99.08% |
| 32-bit | 1 | 0.92% |
CPU Microarch
Microarchitecture


| Name | Computers | Percent |
|---|---|---|
| Core | 33 | 30.28% |
| Skylake | 13 | 11.93% |
| Haswell | 11 | 10.09% |
| Piledriver | 10 | 9.17% |
| K10 | 7 | 6.42% |
| SandyBridge | 6 | 5.5% |
| Westmere | 4 | 3.67% |
| IvyBridge | 4 | 3.67% |
| Zen | 3 | 2.75% |
| Penryn | 3 | 2.75% |
| NetBurst | 3 | 2.75% |
| Nehalem | 3 | 2.75% |
| K8 Hammer | 3 | 2.75% |
| Steamroller | 2 | 1.83% |
| Silvermont | 2 | 1.83% |
| Puma | 1 | 0.92% |
| Excavator | 1 | 0.92% |
CPU Microcode
Microcode number


| Number | Computers | Percent |
|---|---|---|
| 0x1067a | 20 | 18.35% |
| Unknown | 11 | 10.09% |
| 0x306c3 | 9 | 8.26% |
| 0x06001119 | 7 | 6.42% |
| 0x206a7 | 6 | 5.5% |
| 0x906e9 | 5 | 4.59% |
| 0x6fb | 4 | 3.67% |
| 0x306a9 | 4 | 3.67% |
| 0x10676 | 4 | 3.67% |
| 0x906ea | 3 | 2.75% |
| 0x6fd | 3 | 2.75% |
| 0x506e3 | 3 | 2.75% |
| 0x010000db | 3 | 2.75% |
| 0x906eb | 2 | 1.83% |
| 0x6f2 | 2 | 1.83% |
| 0x20655 | 2 | 1.83% |
| 0x106a5 | 2 | 1.83% |
| 0x08001137 | 2 | 1.83% |
| 0x06003106 | 2 | 1.83% |
| 0xf43 | 1 | 0.92% |
| 0xf34 | 1 | 0.92% |
| 0x306f2 | 1 | 0.92% |
| 0x30678 | 1 | 0.92% |
| 0x30673 | 1 | 0.92% |
| 0x206c2 | 1 | 0.92% |
| 0x10677 | 1 | 0.92% |
| 0x10661 | 1 | 0.92% |
| 0x0810100b | 1 | 0.92% |
| 0x07030104 | 1 | 0.92% |
| 0x06006705 | 1 | 0.92% |
| 0x06000852 | 1 | 0.92% |
| 0x010000c8 | 1 | 0.92% |
| 0x01000086 | 1 | 0.92% |
| 0x01000083 | 1 | 0.92% |
GPU Vendor
Vendors of graphics cards


| Vendor | Computers | Percent |
|---|---|---|
| Nvidia | 46 | 41.82% |
| AMD | 33 | 30% |
| Intel | 31 | 28.18% |
GPU Model
Graphics card models


| Model | Computers | Percent |
|---|---|---|
| 4 Series Chipset Integrated Graphics Controller | 6 | 5.41% |
| Xeon E3-1200 v3/4th Gen Core Processor Integrated Graphics Controller | 5 | 4.5% |
| GK208B [GeForce GT 710] | 5 | 4.5% |
| 82G33/G31 Express Integrated Graphics Controller | 5 | 4.5% |
| Xeon E3-1200 v2/3rd Gen Core processor Graphics Controller | 3 | 2.7% |
| RV710 [Radeon HD 4350/4550] | 3 | 2.7% |
| GT218 [GeForce 210] | 3 | 2.7% |
| GP107 [GeForce GTX 1050] | 3 | 2.7% |
| GF119 [GeForce GT 610] | 3 | 2.7% |
| 4th Generation Core Processor Family Integrated Graphics Controller | 3 | 2.7% |
| RV770 [Radeon HD 4850] | 2 | 1.8% |
| Richland [Radeon HD 8570D] | 2 | 1.8% |
| Richland [Radeon HD 8370D] | 2 | 1.8% |
| Juniper XT [Radeon HD 5770] | 2 | 1.8% |
| HD Graphics 530 | 2 | 1.8% |
| GP106 [GeForce GTX 1060 3GB] | 2 | 1.8% |
| GK208B [GeForce GT 730] | 2 | 1.8% |
| GF108 [GeForce GT 730] | 2 | 1.8% |
| GF108 [GeForce GT 430] | 2 | 1.8% |
| G92 [GeForce GTS 250] | 2 | 1.8% |
| G84 [GeForce 8600 GT] | 2 | 1.8% |
| Cape Verde XT [Radeon HD 7770/8760 / R7 250X] | 2 | 1.8% |
| 82Q963/Q965 Integrated Graphics Controller | 2 | 1.8% |
| Trinity [Radeon HD 7620G] | 1 | 0.9% |
| Trinity 2 [Radeon HD 7540D] | 1 | 0.9% |
| Trinity 2 [Radeon HD 7480D] | 1 | 0.9% |
| Stoney [Radeon R2/R3/R4/R5 Graphics] | 1 | 0.9% |
| RV730 [Radeon HD 4600 AGP Series] | 1 | 0.9% |
| RV730 XT [Radeon HD 4670] | 1 | 0.9% |
| RV730 PRO [Radeon HD 4650] | 1 | 0.9% |
| RV610 [Radeon HD 2400 PRO] | 1 | 0.9% |
| RV370 [Radeon X300/X550/X1050 Series] (Secondary) | 1 | 0.9% |
| RV370 [Radeon X300/X550/X1050 Series] | 1 | 0.9% |
| Raven Ridge [Radeon Vega Series / Radeon Vega Mobile Series] | 1 | 0.9% |
| Pitcairn PRO [Radeon HD 7850 / R7 265 / R9 270 1024SP] | 1 | 0.9% |
| Pinewood [Mobility Radeon HD 5570/6550A] | 1 | 0.9% |
| Oland PRO [Radeon R7 240/340] | 1 | 0.9% |
| Mullins [Radeon R1E/R2E Graphics] | 1 | 0.9% |
| Kaveri [Radeon R7 Graphics] | 1 | 0.9% |
| Juniper XT [Radeon HD 6770] | 1 | 0.9% |
| GT216 [GeForce GT 220] | 1 | 0.9% |
| GT215 [GeForce GT 240] | 1 | 0.9% |
| GP108 [GeForce GT 1030] | 1 | 0.9% |
| GP107 [GeForce GTX 1050 Ti] | 1 | 0.9% |
| GP106 [GeForce GTX 1060 6GB] | 1 | 0.9% |
| GP104 [GeForce GTX 1080] | 1 | 0.9% |
| GP104 [GeForce GTX 1070] | 1 | 0.9% |
| GM204 [GeForce GTX 970] | 1 | 0.9% |
| GM200 [GeForce GTX 980 Ti] | 1 | 0.9% |
| GM107 [GeForce GTX 750 Ti] | 1 | 0.9% |
| GK208B [GeForce GT 720] | 1 | 0.9% |
| GK107 [GeForce GT 740] | 1 | 0.9% |
| GK107 [GeForce GT 640 OEM] | 1 | 0.9% |
| GF119 [GeForce 605] | 1 | 0.9% |
| GF116 [GeForce GTS 450 Rev. 2] | 1 | 0.9% |
| GF108 [GeForce GT 630] | 1 | 0.9% |
| GF108 [GeForce GT 440] | 1 | 0.9% |
| G96C [GeForce 9500 GT] | 1 | 0.9% |
| G94 [GeForce 9600 GT] | 1 | 0.9% |
| G92 [GeForce 9800 GT] | 1 | 0.9% |
GPU Combo
Combinations of graphics cards


| Name | Computers | Percent |
|---|---|---|
| 1 x Nvidia | 45 | 41.28% |
| 1 x AMD | 32 | 29.36% |
| 1 x Intel | 30 | 27.52% |
| 2 x AMD | 1 | 0.92% |
| Intel + Nvidia | 1 | 0.92% |
GPU Driver
Free vs proprietary


| Driver | Computers | Percent |
|---|---|---|
| Free | 107 | 98.17% |
| Proprietary | 2 | 1.83% |
GPU Memory
Total video memory


| Size in GB | Computers | Percent |
|---|---|---|
| 0.51-1.0 | 38 | 34.86% |
| Unknown | 35 | 32.11% |
| 1.01-2.0 | 15 | 13.76% |
| 0.01-0.5 | 14 | 12.84% |
| 7.01-8.0 | 2 | 1.83% |
| 5.01-6.0 | 2 | 1.83% |
| 3.01-4.0 | 2 | 1.83% |
| 2.01-3.0 | 1 | 0.92% |
Monitor Vendor
Monitor vendors


| Vendor | Computers | Percent |
|---|---|---|
| Samsung Electronics | 21 | 20.59% |
| Goldstar | 20 | 19.61% |
| Dell | 11 | 10.78% |
| Ancor Communications | 6 | 5.88% |
| BenQ | 4 | 3.92% |
| Acer | 4 | 3.92% |
| HKC | 3 | 2.94% |
| Hewlett-Packard | 3 | 2.94% |
| Fujitsu Siemens | 3 | 2.94% |
| Eizo | 3 | 2.94% |
| AOC | 3 | 2.94% |
| ViewSonic | 2 | 1.96% |
| Panasonic | 2 | 1.96% |
| Medion | 2 | 1.96% |
| Lenovo | 2 | 1.96% |
| Vestel Elektronik | 1 | 0.98% |
| Toshiba | 1 | 0.98% |
| Sony | 1 | 0.98% |
| Philips | 1 | 0.98% |
| KTC | 1 | 0.98% |
| InnoLux Display | 1 | 0.98% |
| Iiyama | 1 | 0.98% |
| IBM | 1 | 0.98% |
| Gericom | 1 | 0.98% |
| EST | 1 | 0.98% |
| CVT | 1 | 0.98% |
| Belinea | 1 | 0.98% |
| ASUSTek Computer | 1 | 0.98% |
Monitor Model
Monitor models


| Model | Computers | Percent |
|---|---|---|
| Checksum: 0x8a (valid) HKC1850 1360x768 304x228mm 15.0-inch | 3 | 2.91% |
| S2202W ENC1976 1680x1050 474x297mm 22.0-inch | 2 | 1.94% |
| L19W-2 FUS070D 1440x900 410x256mm 19.0-inch | 2 | 1.94% |
| FULL HD GSM5B54 1920x1080 480x270mm 21.7-inch | 2 | 1.94% |
| Z22i HWP308C 1920x1080 477x268mm 21.5-inch | 1 | 0.97% |
| XB252Q ACR0563 1920x1080 544x303mm 24.5-inch | 1 | 0.97% |
| W2261 GSM56CF 1920x1080 477x268mm 21.5-inch | 1 | 0.97% |
| W2234 GSM56B8 1680x1050 474x296mm 22.0-inch | 1 | 0.97% |
| W1934 GSM4B7A 1440x900 410x260mm 19.1-inch | 1 | 0.97% |
| VZ249 AUS24CC 1920x1080 527x296mm 23.8-inch | 1 | 0.97% |
| VW202 ACI20A2 1680x1050 433x271mm 20.1-inch | 1 | 0.97% |
| VH226 ACI22F2 1920x1080 477x268mm 21.5-inch | 1 | 0.97% |
| VE175 VSCF419 1280x1024 338x270mm 17.0-inch | 1 | 0.97% |
| VC279 ACI27C4 1920x1080 598x336mm 27.0-inch | 1 | 0.97% |
| VA2445 SERIES VSC712E 1920x1080 521x293mm 23.5-inch | 1 | 0.97% |
| V196HQL ACR033D 1366x768 410x230mm 18.5-inch | 1 | 0.97% |
| ULTRAWIDE GSM76F9 2560x1080 531x298mm 24.0-inch | 1 | 0.97% |
| Ultra HD GSM5B09 3840x2160 600x340mm 27.2-inch | 1 | 0.97% |
| U2312HM DEL4071 1920x1080 510x287mm 23.0-inch | 1 | 0.97% |
| TV SNY4803 1920x1080 1107x623mm 50.0-inch | 1 | 0.97% |
| TV MEIA296 1920x1080 1280x720mm 57.8-inch | 1 | 0.97% |
| TV MEIA096 1920x1080 698x392mm 31.5-inch | 1 | 0.97% |
| TouchSmart HWP4205 1920x1080 510x287mm 23.0-inch | 1 | 0.97% |
| T90X BNQ76AF 1280x1024 376x301mm 19.0-inch | 1 | 0.97% |
| T24D390 SAM0B6C 1920x1080 521x293mm 23.5-inch | 1 | 0.97% |
| T24C300 SAM0A9B 1920x1080 531x299mm 24.0-inch | 1 | 0.97% |
| T24B300 SAM0930 1920x1080 521x293mm 23.5-inch | 1 | 0.97% |
| T2200HD BNQ7726 1920x1080 477x268mm 21.5-inch | 1 | 0.97% |
| SyncMaster SAM060A 1920x1080 | 1 | 0.97% |
| SyncMaster SAM0608 1920x1080 510x290mm 23.1-inch | 1 | 0.97% |
| SyncMaster SAM056A 1440x900 470x300mm 22.0-inch | 1 | 0.97% |
| SyncMaster SAM055D 1920x1080 510x290mm 23.1-inch | 1 | 0.97% |
| SyncMaster SAM0420 1680x1050 474x296mm 22.0-inch | 1 | 0.97% |
| SyncMaster SAM03C2 1680x1050 459x296mm 21.5-inch | 1 | 0.97% |
| SyncMaster SAM036F 1440x900 428x255mm 19.6-inch | 1 | 0.97% |
| SyncMaster SAM01E1 1280x1024 376x301mm 19.0-inch | 1 | 0.97% |
| SyncMaster SAM01B7 1280x1024 338x270mm 17.0-inch | 1 | 0.97% |
| SyncMaster SAM01AE 1600x1200 408x306mm 20.1-inch | 1 | 0.97% |
| SyncMaster SAM011F 1280x1024 376x301mm 19.0-inch | 1 | 0.97% |
| SP2208WFP DEL403A 1680x1050 473x296mm 22.0-inch | 1 | 0.97% |
| SMEX2220 SAM0685 1920x1080 477x268mm 21.5-inch | 1 | 0.97% |
| SMBX2231 SAM076D 1920x1080 477x268mm 21.5-inch | 1 | 0.97% |
| S24D300 SAM0B45 1920x1080 521x293mm 23.5-inch | 1 | 0.97% |
| S22D300 SAM0B3B 1920x1080 477x268mm 21.5-inch | 1 | 0.97% |
| S22C150 SAM0AE5 1920x1080 477x268mm 21.5-inch | 1 | 0.97% |
| S1921-X ENC2203 1280x1024 377x302mm 19.0-inch | 1 | 0.97% |
| Q24 QMX2421 1920x1080 521x293mm 23.5-inch | 1 | 0.97% |
| PL2473HD IVM6107 1920x1080 521x293mm 23.5-inch | 1 | 0.97% |
| PHL 273V7 PHLC156 1920x1080 598x336mm 27.0-inch | 1 | 0.97% |
| P246HL ACR023F 1920x1080 530x300mm 24.0-inch | 1 | 0.97% |
| P2317H DEL40F3 1920x1080 509x286mm 23.0-inch | 1 | 0.97% |
| P225HQ ACR00E6 1920x1080 477x268mm 21.5-inch | 1 | 0.97% |
| MP59G GSM5B35 1920x1080 480x270mm 21.7-inch | 1 | 0.97% |
| Monitor LCD0021 1360x768 | 1 | 0.97% |
| Monitor KTC1700 1024x768 | 1 | 0.97% |
| MD30999PE MED89C4 1440x900 410x256mm 19.0-inch | 1 | 0.97% |
| MD 20220 MED3911 1600x900 443x249mm 20.0-inch | 1 | 0.97% |
| LEN L171p LEN24C9 1280x1024 338x270mm 17.0-inch | 1 | 0.97% |
| LE2262 INL2262 1680x1050 473x296mm 22.0-inch | 1 | 0.97% |
| LCD Monitor SAM0D3E 3840x2160 890x500mm 40.2-inch | 1 | 0.97% |
Monitor Resolution
Monitor screen resolution


| Resolution | Computers | Percent |
|---|---|---|
| 1920x1080 (FHD) | 46 | 45.54% |
| 1280x1024 (SXGA) | 17 | 16.83% |
| 1680x1050 (WSXGA+) | 13 | 12.87% |
| 1440x900 (WXGA+) | 9 | 8.91% |
| 1360x768 | 5 | 4.95% |
| 1366x768 (WXGA) | 3 | 2.97% |
| 1024x768 (XGA) | 3 | 2.97% |
| 3840x2160 (4K) | 2 | 1.98% |
| 2560x1080 | 1 | 0.99% |
| 1600x900 (HD+) | 1 | 0.99% |
| 1600x1200 | 1 | 0.99% |
Monitor Diagonal
Diagonal size in inches


| Inches | Computers | Percent |
|---|---|---|
| 21 | 20 | 19.42% |
| 19 | 16 | 15.53% |
| 23 | 15 | 14.56% |
| 22 | 8 | 7.77% |
| 17 | 8 | 7.77% |
| 18 | 6 | 5.83% |
| 20 | 5 | 4.85% |
| 15 | 5 | 4.85% |
| 31 | 4 | 3.88% |
| 24 | 4 | 3.88% |
| Unknown | 4 | 3.88% |
| 27 | 3 | 2.91% |
| 40 | 2 | 1.94% |
| 55 | 1 | 0.97% |
| 32 | 1 | 0.97% |
| 26 | 1 | 0.97% |
Monitor Width
Physical width


| Width in mm | Computers | Percent |
|---|---|---|
| 401-500 | 46 | 44.66% |
| 501-600 | 23 | 22.33% |
| 301-350 | 13 | 12.62% |
| 351-400 | 9 | 8.74% |
| 601-700 | 4 | 3.88% |
| Unknown | 4 | 3.88% |
| 801-900 | 2 | 1.94% |
| 701-800 | 1 | 0.97% |
| 1001-1500 | 1 | 0.97% |
Aspect Ratio
Proportional relationship between the width and the height


| Ratio | Computers | Percent |
|---|---|---|
| 16/9 | 55 | 54.46% |
| 16/10 | 21 | 20.79% |
| 5/4 | 17 | 16.83% |
| 4/3 | 7 | 6.93% |
| Unknown | 1 | 0.99% |
Monitor Area
Area in inch²
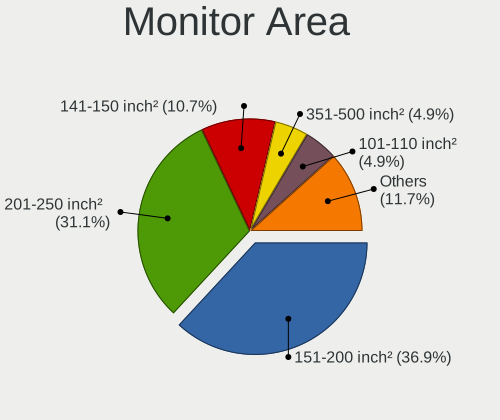

| Area in inch² | Computers | Percent |
|---|---|---|
| 151-200 | 38 | 36.89% |
| 201-250 | 32 | 31.07% |
| 141-150 | 11 | 10.68% |
| 351-500 | 5 | 4.85% |
| 101-110 | 5 | 4.85% |
| Unknown | 4 | 3.88% |
| 301-350 | 3 | 2.91% |
| 251-300 | 2 | 1.94% |
| 501-1000 | 2 | 1.94% |
| More than 1000 | 1 | 0.97% |
Pixel Density
Pixels per inch


| Density | Computers | Percent |
|---|---|---|
| 51-100 | 72 | 70.59% |
| 101-120 | 24 | 23.53% |
| Unknown | 4 | 3.92% |
| 1-50 | 1 | 0.98% |
| 161-240 | 1 | 0.98% |
Multiple Monitors
Total monitors connected


| Total | Computers | Percent |
|---|---|---|
| 1 | 104 | 95.41% |
| 2 | 5 | 4.59% |
Net Controller Vendor
Controller vendors
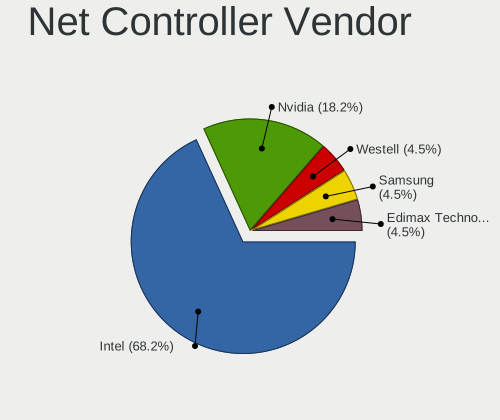

| Vendor | Computers | Percent |
|---|---|---|
| Intel | 15 | 68.18% |
| Nvidia | 4 | 18.18% |
| Westell | 1 | 4.55% |
| Samsung Electronics | 1 | 4.55% |
| Edimax Technology | 1 | 4.55% |
Net Controller Model
Controller models


| Model | Computers | Percent |
|---|---|---|
| MCP61 Ethernet | 3 | 13.04% |
| 82579LM Gigabit Network Connection (Lewisville) | 3 | 13.04% |
| 82567LM-3 Gigabit Network Connection | 3 | 13.04% |
| 82579V Gigabit Network Connection | 2 | 8.7% |
| 82566DM-2 Gigabit Network Connection | 2 | 8.7% |
| WireSpeed Dual Connect Modem | 1 | 4.35% |
| RTL8811AU AC600 USB | 1 | 4.35% |
| I211 Gigabit Network Connection | 1 | 4.35% |
| GT-I9070 (network tethering, USB debugging enabled) | 1 | 4.35% |
| CK8S Ethernet Controller | 1 | 4.35% |
| 82583V Gigabit Network Connection | 1 | 4.35% |
| 82578DM Gigabit Network Connection | 1 | 4.35% |
| 82574L Gigabit Network Connection | 1 | 4.35% |
| 82567LF-3 Gigabit Network Connection | 1 | 4.35% |
| 82566DM Gigabit Network Connection | 1 | 4.35% |
Net Controller Kind
Ethernet, WiFi or modem


| Kind | Computers | Percent |
|---|---|---|
| Ethernet | 20 | 95.24% |
| WiFi | 1 | 4.76% |
Used Controller
Currently used network controller


| Kind | Computers | Percent |
|---|---|---|
| Ethernet | 10 | 100% |
NICs
Total network controllers on board


| Total | Computers | Percent |
|---|---|---|
| 1 | 90 | 82.57% |
| 2 | 15 | 13.76% |
| 3 | 3 | 2.75% |
| 0 | 1 | 0.92% |
Unsupported Devices
Total unsupported devices on board


| Total | Computers | Percent |
|---|---|---|
| 0 | 107 | 98.17% |
| 1 | 2 | 1.83% |
Unsupported Device Types
Types of unsupported devices


| Type | Computers | Percent |
|---|---|---|
| Unassigned class | 1 | 50% |
| Chipcard | 1 | 50% |