Arch Hardware Trends
A project to identify most popular hardware characteristics and track their change over time based on data collected by Arch users at https://Linux-Hardware.org.
Anyone can contribute to the study by uploading probes of their computers by the hw-probe tool:
sudo hw-probe -all -uploadThis is a report for all computer types. See also reports for desktops and notebooks.
Full-feature report is available here: https://linux-hardware.org/?view=trends
Period: Feb, 2020.
Contents
- OS
- OS Family
- Kernel
- Kernel Family
- Kernel Major Ver.
- Arch
- DE
- Display Server
- OS Lang
- Boot Mode
- Filesystem
- Dual Boot with Linux
- Dual Boot (Win)
- Country
- City
- Vendor
- Model
- Model Family
- MFG Year
- Form Factor
- Secure Boot
- Coreboot
- RAM Size
- RAM Used
- Drive Vendor
- Drive Model
- Drive Kind
- Drive Connector
- Drive Size
- Space Total
- Space Used
- Malfunc. Drives
- Malfunc. Drive Vendor
- Malfunc. Drive Kind
- Failed Drives
- Failed Drive Vendor
- Drive Status
- Storage Vendor
- Storage Model
- Storage Kind
- CPU Vendor
- CPU Model
- CPU Model Family
- CPU Cores
- CPU Sockets
- CPU Threads
- CPU Op-Modes
- CPU Microarch
- CPU Microcode
- GPU Vendor
- GPU Model
- GPU Combo
- GPU Driver
- GPU Memory
- Monitor Vendor
- Monitor Model
- Monitor Resolution
- Monitor Diagonal
- Monitor Width
- Aspect Ratio
- Monitor Area
- Pixel Density
- Multiple Monitors
- Net Controller Vendor
- Net Controller Model
- Net Controller Kind
- Used Controller
- NICs
- Unsupported Devices
- Unsupported Device Types
OS
Installed operating systems


| Name | Computers | Percent |
|---|---|---|
| Arch | 55 | 70.51% |
| Arch Rolling | 23 | 29.49% |
OS Family
OS without a version


| Name | Computers | Percent |
|---|---|---|
| Arch | 78 | 100% |
Kernel
Version of the Linux kernel


| Version | Computers | Percent |
|---|---|---|
| 5.5.5-arch1-1 | 13 | 16.67% |
| 5.5.2-arch1-1 | 8 | 10.26% |
| 5.5.4-arch1-1 | 7 | 8.97% |
| 5.4.15-arch1-1 | 7 | 8.97% |
| 5.5.3-arch1-1 | 5 | 6.41% |
| 5.5.1-arch1-1 | 5 | 6.41% |
| 5.5.6-arch1-1 | 4 | 5.13% |
| 5.5.2-arch2-2 | 4 | 5.13% |
| 5.5.4-zen1-1-zen | 3 | 3.85% |
| 5.4.20-1-lts | 2 | 2.56% |
| 5.4.19-1-lts | 2 | 2.56% |
| 5.6.0-rc1-2-nycko-rc1 | 1 | 1.28% |
| 5.6.0-rc1-1-git-00044-gb19e8c684703 | 1 | 1.28% |
| 5.5.5-zen1-1-zen | 1 | 1.28% |
| 5.5.3-zen1-1-zen | 1 | 1.28% |
| 5.5.1-zen1-1-zen | 1 | 1.28% |
| 5.4.7-arch1-1 | 1 | 1.28% |
| 5.4.21-1-lts | 1 | 1.28% |
| 5.4.16.ll55-1-lingruby-git+ | 1 | 1.28% |
| 5.4.15-zen1-1-zen | 1 | 1.28% |
| 5.4.15-1-ck-zen2 | 1 | 1.28% |
| 5.4.12-arch1-1 | 1 | 1.28% |
| 5.3.7-arch1-1-ARCH | 1 | 1.28% |
| 5.3.18-1-surface | 1 | 1.28% |
| 5.3.15-1 | 1 | 1.28% |
| 4.19.99-1-lts | 1 | 1.28% |
| 4.19.97-1-lts | 1 | 1.28% |
| 4.19.78-xxxx-std-ipv6-64 | 1 | 1.28% |
| 4.19.101-1-lts | 1 | 1.28% |
Kernel Family
Linux kernel without a distro release


| Version | Computers | Percent |
|---|---|---|
| 5.5.5 | 14 | 17.95% |
| 5.5.2 | 12 | 15.38% |
| 5.5.4 | 10 | 12.82% |
| 5.4.15 | 9 | 11.54% |
| 5.5.3 | 6 | 7.69% |
| 5.5.1 | 6 | 7.69% |
| 5.5.6 | 4 | 5.13% |
| 5.6.0 | 2 | 2.56% |
| 5.4.20 | 2 | 2.56% |
| 5.4.19 | 2 | 2.56% |
| 5.4.7 | 1 | 1.28% |
| 5.4.21 | 1 | 1.28% |
| 5.4.16 | 1 | 1.28% |
| 5.4.12 | 1 | 1.28% |
| 5.3.7 | 1 | 1.28% |
| 5.3.18 | 1 | 1.28% |
| 5.3.15 | 1 | 1.28% |
| 4.19.99 | 1 | 1.28% |
| 4.19.97 | 1 | 1.28% |
| 4.19.78 | 1 | 1.28% |
| 4.19.101 | 1 | 1.28% |
Kernel Major Ver.
Linux kernel major version


| Version | Computers | Percent |
|---|---|---|
| 5.5 | 52 | 66.67% |
| 5.4 | 17 | 21.79% |
| 4.19 | 4 | 5.13% |
| 5.3 | 3 | 3.85% |
| 5.6 | 2 | 2.56% |
Arch
OS architecture (x86_64, i586, etc.)


| Name | Computers | Percent |
|---|---|---|
| x86_64 | 78 | 100% |
DE
Desktop Environment


| Name | Computers | Percent |
|---|---|---|
| GNOME | 28 | 35.9% |
| KDE | 13 | 16.67% |
| KDE5 | 10 | 12.82% |
| Unknown | 7 | 8.97% |
| i3 | 4 | 5.13% |
| MATE | 3 | 3.85% |
| XFCE | 2 | 2.56% |
| Cinnamon | 2 | 2.56% |
| Budgie | 2 | 2.56% |
| X-Cinnamon | 1 | 1.28% |
| LXQt | 1 | 1.28% |
| LXDE | 1 | 1.28% |
| GNUstep | 1 | 1.28% |
| GNOME Flashback | 1 | 1.28% |
| GNOME Classic | 1 | 1.28% |
| Enlightenment | 1 | 1.28% |
Display Server
X11 or Wayland


| Name | Computers | Percent |
|---|---|---|
| X11 | 53 | 67.95% |
| Wayland | 19 | 24.36% |
| Tty | 3 | 3.85% |
| Unknown | 3 | 3.85% |
OS Lang
Language


| Lang | Computers | Percent |
|---|---|---|
| en_US | 37 | 47.44% |
| en_GB | 6 | 7.69% |
| pl_PL | 4 | 5.13% |
| de_DE | 4 | 5.13% |
| ru_RU | 3 | 3.85% |
| pt_BR | 3 | 3.85% |
| ru_RU.utf8 | 2 | 2.56% |
| ja_JP | 2 | 2.56% |
| fr_FR | 2 | 2.56% |
| en_CA | 2 | 2.56% |
| C | 2 | 2.56% |
| Unknown | 2 | 2.56% |
| zh_CN | 1 | 1.28% |
| pl_PL.utf8 | 1 | 1.28% |
| it_IT.utf8 | 1 | 1.28% |
| hu_HU | 1 | 1.28% |
| fr_CA | 1 | 1.28% |
| french | 1 | 1.28% |
| es_MX | 1 | 1.28% |
| es_EC | 1 | 1.28% |
| en_GB.utf8 | 1 | 1.28% |
Boot Mode
EFI or BIOS


| Mode | Computers | Percent |
|---|---|---|
| EFI | 43 | 55.13% |
| BIOS | 35 | 44.87% |
Filesystem
Type of filesystem


| Type | Computers | Percent |
|---|---|---|
| Ext4 | 64 | 82.05% |
| Btrfs | 9 | 11.54% |
| Xfs | 3 | 3.85% |
| F2fs | 2 | 2.56% |
Dual Boot with Linux
Hosting more than one Linux


| Dual boot | Computers | Percent |
|---|---|---|
| No | 71 | 91.03% |
| Yes | 7 | 8.97% |
Dual Boot (Win)
Hosting Linux and Windows


| Dual boot | Computers | Percent |
|---|---|---|
| No | 60 | 76.92% |
| Yes | 18 | 23.08% |
Country
Geographic location (country)


| Country | Computers | Percent |
|---|---|---|
| USA | 15 | 19.23% |
| Russia | 11 | 14.1% |
| Germany | 8 | 10.26% |
| Poland | 5 | 6.41% |
| France | 4 | 5.13% |
| Canada | 4 | 5.13% |
| Brazil | 4 | 5.13% |
| UK | 3 | 3.85% |
| Spain | 2 | 2.56% |
| Romania | 2 | 2.56% |
| Mexico | 2 | 2.56% |
| China | 2 | 2.56% |
| Ukraine | 1 | 1.28% |
| Thailand | 1 | 1.28% |
| Portugal | 1 | 1.28% |
| Latvia | 1 | 1.28% |
| Korea, Republic of | 1 | 1.28% |
| Japan | 1 | 1.28% |
| Italy | 1 | 1.28% |
| India | 1 | 1.28% |
| Hungary | 1 | 1.28% |
| Greece | 1 | 1.28% |
| Ecuador | 1 | 1.28% |
| Czech Republic | 1 | 1.28% |
| Colombia | 1 | 1.28% |
| Chile | 1 | 1.28% |
| Cambodia | 1 | 1.28% |
| Belgium | 1 | 1.28% |
City
Geographic location (city)


| City | Computers | Percent |
|---|---|---|
| Moscow | 3 | 3.85% |
| Shanghai | 2 | 2.56% |
| Norderstedt | 2 | 2.56% |
| Krasnoyarsk | 2 | 2.56% |
| Gravelines | 2 | 2.56% |
| Łódź | 1 | 1.28% |
| Winter Garden | 1 | 1.28% |
| Winsted | 1 | 1.28% |
| White Salmon | 1 | 1.28% |
| Wejherowo | 1 | 1.28% |
| Washington | 1 | 1.28% |
| Warsaw | 1 | 1.28% |
| Vladivostok | 1 | 1.28% |
| Uccle | 1 | 1.28% |
| Tuzla | 1 | 1.28% |
| Tuttlingen | 1 | 1.28% |
| Tayshet | 1 | 1.28% |
| Taubate | 1 | 1.28% |
| São Luís | 1 | 1.28% |
| St Petersburg | 1 | 1.28% |
| Seoul | 1 | 1.28% |
| Santiago | 1 | 1.28% |
| San Diego | 1 | 1.28% |
| Reims | 1 | 1.28% |
| Quito | 1 | 1.28% |
| Prague | 1 | 1.28% |
| Powder Springs | 1 | 1.28% |
| Playa del Carmen | 1 | 1.28% |
| Phnom Penh | 1 | 1.28% |
| Patos de Minas | 1 | 1.28% |
| Ottawa | 1 | 1.28% |
| Nyazepetrovskaya | 1 | 1.28% |
| Nizhneudinsk | 1 | 1.28% |
| Niagara Falls | 1 | 1.28% |
| Mytilene | 1 | 1.28% |
| Montreal | 1 | 1.28% |
| Millinocket | 1 | 1.28% |
| Mesa | 1 | 1.28% |
| Mem Martins | 1 | 1.28% |
| Marietta | 1 | 1.28% |
| Kyiv | 1 | 1.28% |
| Krakow | 1 | 1.28% |
| Kirov | 1 | 1.28% |
| Itarare | 1 | 1.28% |
| Homosassa | 1 | 1.28% |
| Geveze | 1 | 1.28% |
| Gdynia | 1 | 1.28% |
| Frankfurt am Main | 1 | 1.28% |
| Florence | 1 | 1.28% |
| Ellesmere | 1 | 1.28% |
| El Viso del Alcor | 1 | 1.28% |
| Duvall | 1 | 1.28% |
| Dobele | 1 | 1.28% |
| Dartford | 1 | 1.28% |
| Crema | 1 | 1.28% |
| Cologne | 1 | 1.28% |
| Cocoa | 1 | 1.28% |
| Cluj-Napoca | 1 | 1.28% |
| Ciudad Nezahualcoyotl | 1 | 1.28% |
| Chiyoda | 1 | 1.28% |
Vendor
Motherboard manufacturer


| Name | Computers | Percent |
|---|---|---|
| ASUSTek Computer | 17 | 21.79% |
| Lenovo | 13 | 16.67% |
| MSI | 7 | 8.97% |
| Dell | 7 | 8.97% |
| Acer | 7 | 8.97% |
| Hewlett-Packard | 6 | 7.69% |
| Gigabyte Technology | 4 | 5.13% |
| ASRock | 4 | 5.13% |
| Microsoft | 2 | 2.56% |
| Fujitsu | 2 | 2.56% |
| Apple | 2 | 2.56% |
| Samsung Electronics | 1 | 1.28% |
| Notebook | 1 | 1.28% |
| MECHREVO | 1 | 1.28% |
| Koompi | 1 | 1.28% |
| Intel | 1 | 1.28% |
| HUAWEI | 1 | 1.28% |
| Unknown | 1 | 1.28% |
Model
Motherboard model


| Name | Computers | Percent |
|---|---|---|
| Acer Aspire E5-571 | 2 | 2.56% |
| Unknown | 2 | 2.56% |
| Samsung Electronics 300E4Z/300E5Z/300E7Z | 1 | 1.28% |
| Notebook N141CU | 1 | 1.28% |
| MSI Prestige 14 A10SC | 1 | 1.28% |
| MSI MS-7C35 | 1 | 1.28% |
| MSI MS-7B89 | 1 | 1.28% |
| MSI MS-7B38 | 1 | 1.28% |
| MSI MS-7808 | 1 | 1.28% |
| MSI GT62VR 6RE | 1 | 1.28% |
| MSI GS75 Stealth 9SF | 1 | 1.28% |
| Microsoft Surface Book 2 | 1 | 1.28% |
| Microsoft Surface Book | 1 | 1.28% |
| MECHREVO X6Ti | 1 | 1.28% |
| Lenovo V155-15API 81V5 | 1 | 1.28% |
| Lenovo ThinkPad X1 Tablet 20GHS2TC00 | 1 | 1.28% |
| Lenovo ThinkPad T490 20N2000NRT | 1 | 1.28% |
| Lenovo ThinkPad T490 20N2000BRT | 1 | 1.28% |
| Lenovo ThinkPad T480 20L5CTO1WW | 1 | 1.28% |
| Lenovo ThinkPad T400 6474P1U | 1 | 1.28% |
| Lenovo ThinkPad L420 7829W1F | 1 | 1.28% |
| Lenovo ThinkCentre E73 10AU003BMX | 1 | 1.28% |
| Lenovo IdeaPad Z400 Touch VIWZ1 | 1 | 1.28% |
| Lenovo IdeaPad C340-14IWL 81RL | 1 | 1.28% |
| Lenovo IdeaPad 700-15ISK 80RU | 1 | 1.28% |
| Lenovo IdeaPad 530S-15IKB 81EV | 1 | 1.28% |
| Lenovo IdeaPad 110-14IBR 80T6 | 1 | 1.28% |
| Intel DN2800MT AAG23738-804 | 1 | 1.28% |
| HUAWEI MACH-WX9 | 1 | 1.28% |
| HP Pavilion Gaming Laptop 15-ec0xxx | 1 | 1.28% |
| HP ENVY x360 Convertible 15-ds0xxx | 1 | 1.28% |
| HP EliteBook 8460p | 1 | 1.28% |
| HP EliteBook 840 G6 | 1 | 1.28% |
| HP EliteBook 840 G3 | 1 | 1.28% |
| HP EliteBook 840 G2 | 1 | 1.28% |
| Gigabyte H77-DS3H | 1 | 1.28% |
| Gigabyte H61M-S2PV | 1 | 1.28% |
| Gigabyte B450M DS3H | 1 | 1.28% |
| Gigabyte AB350-Gaming 3 | 1 | 1.28% |
| Fujitsu LIFEBOOK S710 | 1 | 1.28% |
| Fujitsu LIFEBOOK E752 | 1 | 1.28% |
| Dell Vostro 3400 | 1 | 1.28% |
| Dell Precision 7540 | 1 | 1.28% |
| Dell OptiPlex 7050 | 1 | 1.28% |
| Dell Latitude E7470 | 1 | 1.28% |
| Dell Latitude E5450 | 1 | 1.28% |
| Dell Inspiron 5767 | 1 | 1.28% |
| Dell Inspiron 15-5578 | 1 | 1.28% |
| ASUS Z170-A | 1 | 1.28% |
| ASUS UX303LA | 1 | 1.28% |
| ASUS TUF Gaming FX505DV_FX505DV | 1 | 1.28% |
| ASUS TUF B450M-PLUS GAMING | 1 | 1.28% |
| ASUS STRIX Z270G GAMING | 1 | 1.28% |
| ASUS SABERTOOTH 990FX R2.0 | 1 | 1.28% |
| ASUS Q535UD | 1 | 1.28% |
| ASUS PRIME B360-PLUS | 1 | 1.28% |
| ASUS PRIME B350-PLUS | 1 | 1.28% |
| ASUS P8H61-MX USB3 | 1 | 1.28% |
| ASUS N82JQ | 1 | 1.28% |
| ASUS N551JW | 1 | 1.28% |
Model Family
Motherboard model prefix


| Name | Computers | Percent |
|---|---|---|
| Lenovo ThinkPad | 6 | 7.69% |
| Lenovo IdeaPad | 5 | 6.41% |
| HP EliteBook | 4 | 5.13% |
| Acer Aspire | 3 | 3.85% |
| Microsoft Surface | 2 | 2.56% |
| Fujitsu LIFEBOOK | 2 | 2.56% |
| Dell Latitude | 2 | 2.56% |
| Dell Inspiron | 2 | 2.56% |
| ASUS TUF | 2 | 2.56% |
| ASUS PRIME | 2 | 2.56% |
| Unknown | 2 | 2.56% |
| Samsung Electronics 300E4Z | 1 | 1.28% |
| Notebook N141CU | 1 | 1.28% |
| MSI Prestige | 1 | 1.28% |
| MSI MS-7C35 | 1 | 1.28% |
| MSI MS-7B89 | 1 | 1.28% |
| MSI MS-7B38 | 1 | 1.28% |
| MSI MS-7808 | 1 | 1.28% |
| MSI GT62VR | 1 | 1.28% |
| MSI GS75 | 1 | 1.28% |
| MECHREVO X6Ti | 1 | 1.28% |
| Lenovo V155-15API | 1 | 1.28% |
| Lenovo ThinkCentre | 1 | 1.28% |
| Intel DN2800MT | 1 | 1.28% |
| HUAWEI MACH-WX9 | 1 | 1.28% |
| HP Pavilion | 1 | 1.28% |
| HP ENVY | 1 | 1.28% |
| Gigabyte H77-DS3H | 1 | 1.28% |
| Gigabyte H61M-S2PV | 1 | 1.28% |
| Gigabyte B450M | 1 | 1.28% |
| Gigabyte AB350-Gaming | 1 | 1.28% |
| Dell Vostro | 1 | 1.28% |
| Dell Precision | 1 | 1.28% |
| Dell OptiPlex | 1 | 1.28% |
| ASUS Z170-A | 1 | 1.28% |
| ASUS UX303LA | 1 | 1.28% |
| ASUS STRIX | 1 | 1.28% |
| ASUS SABERTOOTH | 1 | 1.28% |
| ASUS Q535UD | 1 | 1.28% |
| ASUS P8H61-MX | 1 | 1.28% |
| ASUS N82JQ | 1 | 1.28% |
| ASUS N551JW | 1 | 1.28% |
| ASUS Maximus | 1 | 1.28% |
| ASUS M5A99FX | 1 | 1.28% |
| ASUS K53SV | 1 | 1.28% |
| ASUS GL553VW | 1 | 1.28% |
| ASUS GL502VS | 1 | 1.28% |
| ASRock Z77 | 1 | 1.28% |
| ASRock Q1900M | 1 | 1.28% |
| ASRock H87M | 1 | 1.28% |
| ASRock 970 | 1 | 1.28% |
| Apple MacBook4 | 1 | 1.28% |
| Apple iMac12 | 1 | 1.28% |
| Acer TravelMate | 1 | 1.28% |
| Acer Predator | 1 | 1.28% |
| Acer Nitro | 1 | 1.28% |
| Acer Extensa | 1 | 1.28% |
MFG Year
Motherboard manufacture year


| Year | Computers | Percent |
|---|---|---|
| 2019 | 29 | 37.18% |
| 2013 | 10 | 12.82% |
| 2018 | 9 | 11.54% |
| 2016 | 8 | 10.26% |
| 2014 | 6 | 7.69% |
| 2015 | 4 | 5.13% |
| 2017 | 3 | 3.85% |
| 2020 | 2 | 2.56% |
| 2010 | 2 | 2.56% |
| 2012 | 1 | 1.28% |
| 2011 | 1 | 1.28% |
| 2009 | 1 | 1.28% |
| 2008 | 1 | 1.28% |
| Unknown | 1 | 1.28% |
Form Factor
Physical design of the computer


| Name | Computers | Percent |
|---|---|---|
| Notebook | 46 | 58.97% |
| Desktop | 25 | 32.05% |
| Tablet | 3 | 3.85% |
| Convertible | 3 | 3.85% |
| All in one | 1 | 1.28% |
Secure Boot
Enabled or disabled


| State | Computers | Percent |
|---|---|---|
| Disabled | 76 | 97.44% |
| Enabled | 2 | 2.56% |
Coreboot
Have coreboot on board


| Used | Computers | Percent |
|---|---|---|
| No | 78 | 100% |
RAM Size
Total RAM memory


| Size in GB | Computers | Percent |
|---|---|---|
| 16.01-24.0 | 28 | 35.9% |
| 8.01-16.0 | 16 | 20.51% |
| 4.01-8.0 | 13 | 16.67% |
| 32.01-64.0 | 9 | 11.54% |
| 3.01-4.0 | 8 | 10.26% |
| 1.01-2.0 | 2 | 2.56% |
| 2.01-3.0 | 1 | 1.28% |
| 64.01-256.0 | 1 | 1.28% |
RAM Used
Used RAM memory


| Used GB | Computers | Percent |
|---|---|---|
| 2.01-3.0 | 23 | 29.49% |
| 1.01-2.0 | 21 | 26.92% |
| 4.01-8.0 | 16 | 20.51% |
| 3.01-4.0 | 8 | 10.26% |
| 0.01-1.0 | 6 | 7.69% |
| 8.01-16.0 | 4 | 5.13% |
Drive Vendor
Hard drive vendors


| Vendor | Computers | Drives | Percent |
|---|---|---|---|
| WDC | 21 | 34 | 18.26% |
| Seagate | 19 | 23 | 16.52% |
| Samsung Electronics | 16 | 16 | 13.91% |
| Intel | 7 | 8 | 6.09% |
| Toshiba | 6 | 6 | 5.22% |
| SanDisk | 6 | 7 | 5.22% |
| Kingston | 5 | 6 | 4.35% |
| HGST | 4 | 4 | 3.48% |
| Crucial | 4 | 4 | 3.48% |
| LITEON | 3 | 3 | 2.61% |
| Unknown | 2 | 2 | 1.74% |
| PLEXTOR | 2 | 2 | 1.74% |
| Micron Technology | 2 | 2 | 1.74% |
| Hitachi | 2 | 2 | 1.74% |
| A-DATA Technology | 2 | 2 | 1.74% |
| VMware | 1 | 1 | 0.87% |
| SPCC | 1 | 1 | 0.87% |
| SK Hynix | 1 | 1 | 0.87% |
| PNY | 1 | 1 | 0.87% |
| PM981a N | 1 | 1 | 0.87% |
| Phison | 1 | 1 | 0.87% |
| Patriot | 1 | 1 | 0.87% |
| LITEONIT | 1 | 1 | 0.87% |
| JMicron | 1 | 1 | 0.87% |
| Fujitsu | 1 | 1 | 0.87% |
| FORESEE | 1 | 1 | 0.87% |
| China | 1 | 1 | 0.87% |
| asmedia | 1 | 1 | 0.87% |
| Apple | 1 | 1 | 0.87% |
Drive Model
Hard drive models


| Model | Computers | Percent |
|---|---|---|
| HTS721010A9E630 1TB | 4 | 3.17% |
| SSD 850 EVO 500GB | 3 | 2.38% |
| SA400S37480G 480GB SSD | 3 | 2.38% |
| WDS250G2B0A-00SM50 250GB SSD | 2 | 1.59% |
| Ultra II 480GB SSD | 2 | 1.59% |
| SU800 256GB SSD | 2 | 1.59% |
| ST500LT012-1DG142 500GB | 2 | 1.59% |
| ST4000DM000-1F2168 4TB | 2 | 1.59% |
| ST2000LM007-1R8174 2TB | 2 | 1.59% |
| ST1000DM010-2EP102 1TB | 2 | 1.59% |
| ST1000DM003-9YN162 1TB | 2 | 1.59% |
| WDS500G2B0B-00YS70 500GB SSD | 1 | 0.79% |
| WDS480G2G0A-00JH30 480GB SSD | 1 | 0.79% |
| WDS240G2G0A-00JH30 240GB SSD | 1 | 0.79% |
| WDS100T2B0B 1TB SSD | 1 | 0.79% |
| WDS100T2B0A-00SM50 1TB SSD | 1 | 0.79% |
| WD80EZAZ-11TDBA0 8TB | 1 | 0.79% |
| WD80EMAZ-00WJTA0 8TB | 1 | 0.79% |
| WD7500BPVT-80HXZT1 752GB | 1 | 0.79% |
| WD6400AAKS-65Z7B0 640GB | 1 | 0.79% |
| WD6400AAKS-22A7B0 640GB | 1 | 0.79% |
| WD50EFRX-68MYMN1 5TB | 1 | 0.79% |
| WD5000LPCX-24VHAT0 500GB | 1 | 0.79% |
| WD40EFRX-68WT0N0 4TB | 1 | 0.79% |
| WD3200AAKS-00V1A0 320GB | 1 | 0.79% |
| WD2500JS-75NCB3 250GB | 1 | 0.79% |
| WD20PURZ-85GU6Y0 2TB | 1 | 0.79% |
| WD20EZRZ-00Z5HB0 2TB | 1 | 0.79% |
| WD1600BEKT-60V5T1 160GB | 1 | 0.79% |
| WD140EMFZ-11A0WA0 14TB | 1 | 0.79% |
| WD120EMAZ-11BLFA0 12TB | 1 | 0.79% |
| WD10SPZX-21Z10T0 1TB | 1 | 0.79% |
| WD10JPCX-24UE4T0 1TB | 1 | 0.79% |
| WD10EZEX-00BN5A0 1TB | 1 | 0.79% |
| WD100EZAZ-11TDBA0 10TB | 1 | 0.79% |
| WD1003FZEX-00K3CA0 1TB | 1 | 0.79% |
| VMe Samsung 256G | 1 | 0.79% |
| Virtual S 55GB | 1 | 0.79% |
| TL100 240GB SSD | 1 | 0.79% |
| THNSNJ128G8NU 128GB SSD | 1 | 0.79% |
| Tech 250GB | 1 | 0.79% |
| SV300S37A120G 120GB SSD | 1 | 0.79% |
| SUV400S37240G 240GB SSD | 1 | 0.79% |
| SU04G 4GB | 1 | 0.79% |
| ST8000DM004-2CX188 8TB | 1 | 0.79% |
| ST320LT007-9ZV142 320GB | 1 | 0.79% |
| ST250DM000-1BD141 250GB | 1 | 0.79% |
| ST2000VX008-2E3164 2TB | 1 | 0.79% |
| ST2000LX001-1RG174 2TB | 1 | 0.79% |
| ST2000DM001-1CH164 2TB | 1 | 0.79% |
| ST1000LM024 HN-M101MBB 1TB | 1 | 0.79% |
| ST1000DM003-1CH162 1TB | 1 | 0.79% |
| ST10000VN0004-1ZD101 10TB | 1 | 0.79% |
| SSDSC2KW512G8 512GB | 1 | 0.79% |
| SSDSC2KW480H6 480GB | 1 | 0.79% |
| SSDSC2CW240A3 240GB | 1 | 0.79% |
| SSDSC2CT120A3 120GB | 1 | 0.79% |
| SSDSC2BW360H6 360GB | 1 | 0.79% |
| SSDSC2BW120A4 120GB | 1 | 0.79% |
| SSDPEKNW512G8H 512GB | 1 | 0.79% |
Drive Kind
HDD or SSD


| Kind | Computers | Drives | Percent |
|---|---|---|---|
| SSD | 44 | 55 | 44% |
| HDD | 37 | 61 | 37% |
| NVMe | 12 | 12 | 12% |
| Unknown | 6 | 6 | 6% |
| MMC | 1 | 1 | 1% |
Drive Connector
SATA, SAS, NVMe, etc.


| Type | Computers | Drives | Percent |
|---|---|---|---|
| SATA | 59 | 115 | 74.68% |
| NVMe | 12 | 12 | 15.19% |
| SAS | 7 | 7 | 8.86% |
| MMC | 1 | 1 | 1.27% |
Drive Size
Size of hard drive


| Size in TB | Computers | Drives | Percent |
|---|---|---|---|
| 0.01-0.5 | 55 | 72 | 55.56% |
| 0.51-1.0 | 26 | 33 | 26.26% |
| 1.01-2.0 | 10 | 11 | 10.1% |
| 3.01-4.0 | 4 | 5 | 4.04% |
| 4.01-10.0 | 3 | 12 | 3.03% |
| 10.01-20.0 | 1 | 2 | 1.01% |
Space Total
Amount of disk space available on the file system


| Size in GB | Computers | Percent |
|---|---|---|
| 101-250 | 24 | 30.77% |
| 251-500 | 17 | 21.79% |
| 501-1000 | 12 | 15.38% |
| More than 3000 | 9 | 11.54% |
| 2001-3000 | 6 | 7.69% |
| 1001-2000 | 5 | 6.41% |
| 51-100 | 3 | 3.85% |
| 21-50 | 2 | 2.56% |
Space Used
Amount of used disk space


| Used GB | Computers | Percent |
|---|---|---|
| 21-50 | 18 | 23.08% |
| 101-250 | 14 | 17.95% |
| 1-20 | 12 | 15.38% |
| 501-1000 | 8 | 10.26% |
| 251-500 | 7 | 8.97% |
| 51-100 | 7 | 8.97% |
| More than 3000 | 6 | 7.69% |
| 1001-2000 | 4 | 5.13% |
| 2001-3000 | 2 | 2.56% |
Malfunc. Drives
Drive models with a malfunction


| Model | Computers | Drives | Percent |
|---|---|---|---|
| WD1600BEKT-60V5T1 160GB | 1 | 1 | 11.11% |
| ST2000LM007-1R8174 2TB | 1 | 1 | 11.11% |
| ST1000DM003-9YN162 1TB | 1 | 1 | 11.11% |
| SSDSC2CT120A3 120GB | 1 | 1 | 11.11% |
| SSDSC2BW360H6 360GB | 1 | 1 | 11.11% |
| SSD 960 PRO 512GB | 1 | 1 | 11.11% |
| PX-256M6S 256GB SSD | 1 | 1 | 11.11% |
| MK6465GSX 640GB | 1 | 1 | 11.11% |
| HTS721010A9E630 1TB | 1 | 1 | 11.11% |
Malfunc. Drive Vendor
Vendors of faulty drives


| Vendor | Computers | Drives | Percent |
|---|---|---|---|
| Seagate | 2 | 2 | 22.22% |
| Intel | 2 | 2 | 22.22% |
| WDC | 1 | 1 | 11.11% |
| Toshiba | 1 | 1 | 11.11% |
| Samsung Electronics | 1 | 1 | 11.11% |
| PLEXTOR | 1 | 1 | 11.11% |
| HGST | 1 | 1 | 11.11% |
Malfunc. Drive Kind
Kinds of faulty drives


| Kind | Computers | Drives | Percent |
|---|---|---|---|
| HDD | 5 | 5 | 62.5% |
| SSD | 2 | 3 | 25% |
| NVMe | 1 | 1 | 12.5% |
Failed Drives
Failed drive models
Zero info for selected period =(
Failed Drive Vendor
Failed drive vendors
Zero info for selected period =(
Drive Status
Number of failed and malfunc. drives


| Status | Computers | Drives | Percent |
|---|---|---|---|
| Detected | 39 | 63 | 49.37% |
| Works | 32 | 63 | 40.51% |
| Malfunc | 8 | 9 | 10.13% |
Storage Vendor
Storage controller vendors


| Vendor | Computers | Percent |
|---|---|---|
| Intel | 58 | 59.18% |
| AMD | 13 | 13.27% |
| Samsung Electronics | 12 | 12.24% |
| Toshiba America Info Systems | 3 | 3.06% |
| ASMedia Technology | 3 | 3.06% |
| Phison Electronics | 2 | 2.04% |
| LSI Logic / Symbios Logic | 2 | 2.04% |
| VMware | 1 | 1.02% |
| SK Hynix | 1 | 1.02% |
| Silicon Image | 1 | 1.02% |
| Sandisk | 1 | 1.02% |
| Lite-On Technology | 1 | 1.02% |
Storage Model
Storage controller models


| Model | Computers | Percent |
|---|---|---|
| FCH SATA Controller [AHCI mode] | 10 | 8.93% |
| NVMe SSD Controller SM981/PM981/PM983 | 9 | 8.04% |
| Sunrise Point-LP SATA Controller [AHCI mode] | 7 | 6.25% |
| HM170/QM170 Chipset SATA Controller [AHCI Mode] | 5 | 4.46% |
| SSD 660P Series | 4 | 3.57% |
| Cannon Lake Mobile PCH SATA AHCI Controller | 4 | 3.57% |
| 6 Series/C200 Series Chipset Family 6 port Mobile SATA AHCI Controller | 4 | 3.57% |
| Wildcat Point-LP SATA Controller [AHCI Mode] | 3 | 2.68% |
| NVMe Controller | 3 | 2.68% |
| ASM1062 Serial ATA Controller | 3 | 2.68% |
| 8 Series/C220 Series Chipset Family 6-port SATA Controller 1 [AHCI mode] | 3 | 2.68% |
| 400 Series Chipset SATA Controller | 3 | 2.68% |
| SB7x0/SB8x0/SB9x0 SATA Controller [AHCI mode] | 2 | 1.79% |
| Q170/Q150/B150/H170/H110/Z170/CM236 Chipset SATA Controller [AHCI Mode] | 2 | 1.79% |
| 8 Series SATA Controller 1 [AHCI mode] | 2 | 1.79% |
| 7 Series/C210 Series Chipset Family 6-port SATA Controller [AHCI mode] | 2 | 1.79% |
| 7 Series Chipset Family 6-port SATA Controller [AHCI mode] | 2 | 1.79% |
| 6 Series/C200 Series Chipset Family 6 port Desktop SATA AHCI Controller | 2 | 1.79% |
| 300 Series Chipset SATA Controller | 2 | 1.79% |
| WD Black 2018/PC SN720 NVMe SSD | 1 | 0.89% |
| SSD Pro 7600p/760p/E 6100p Series | 1 | 0.89% |
| SSD 600P Series | 1 | 0.89% |
| SiI 3114 [SATALink/SATARaid] Serial ATA Controller | 1 | 0.89% |
| SB7x0/SB8x0/SB9x0 SATA Controller [IDE mode] | 1 | 0.89% |
| SB7x0/SB8x0/SB9x0 IDE Controller | 1 | 0.89% |
| SATA Controller [RAID mode] | 1 | 0.89% |
| SATA controller | 1 | 0.89% |
| SATA AHCI controller | 1 | 0.89% |
| SAS2008 PCI-Express Fusion-MPT SAS-2 [Falcon] | 1 | 0.89% |
| NVMe SSD Optane Series Controller | 1 | 0.89% |
| NVMe SSD Controller SM961/PM961 | 1 | 0.89% |
| NVMe SSD Controller SM951/PM951 | 1 | 0.89% |
| Non-Volatile memory controller | 1 | 0.89% |
| NM10/ICH7 Family SATA Controller [AHCI mode] | 1 | 0.89% |
| FCH SATA Controller D | 1 | 0.89% |
| Electronics Non-Volatile memory controller | 1 | 0.89% |
| E7 NVMe Controller | 1 | 0.89% |
| E12 NVMe Controller | 1 | 0.89% |
| Comet Lake SATA AHCI Controller | 1 | 0.89% |
| Cannon Point-LP SATA Controller [AHCI Mode] | 1 | 0.89% |
| Cannon Lake PCH SATA AHCI Controller | 1 | 0.89% |
| BG3 NVMe SSD Controller | 1 | 0.89% |
| Atom/Celeron/Pentium Processor x5-E8000/J3xxx/N3xxx Series SATA Controller | 1 | 0.89% |
| Atom Processor E3800 Series SATA AHCI Controller | 1 | 0.89% |
| 82801IBM/IEM (ICH9M/ICH9M-E) 4 port SATA Controller [AHCI mode] | 1 | 0.89% |
| 82801HM/HEM (ICH8M/ICH8M-E) SATA Controller [AHCI mode] | 1 | 0.89% |
| 82801HM/HEM (ICH8M/ICH8M-E) IDE Controller | 1 | 0.89% |
| 82801 Mobile SATA Controller [RAID mode] | 1 | 0.89% |
| 82371AB/EB/MB PIIX4 IDE | 1 | 0.89% |
| 7 Series/C210 Series Chipset Family 4-port SATA Controller [IDE mode] | 1 | 0.89% |
| 7 Series/C210 Series Chipset Family 2-port SATA Controller [IDE mode] | 1 | 0.89% |
| 6 Series/C200 Series Chipset Family Desktop SATA Controller (IDE mode, ports 4-5) | 1 | 0.89% |
| 6 Series/C200 Series Chipset Family Desktop SATA Controller (IDE mode, ports 0-3) | 1 | 0.89% |
| 53c1030 PCI-X Fusion-MPT Dual Ultra320 SCSI | 1 | 0.89% |
| 5 Series/3400 Series Chipset PT IDER Controller | 1 | 0.89% |
| 5 Series/3400 Series Chipset 6 port SATA AHCI Controller | 1 | 0.89% |
| 5 Series/3400 Series Chipset 4 port SATA IDE Controller | 1 | 0.89% |
| 5 Series/3400 Series Chipset 4 port SATA AHCI Controller | 1 | 0.89% |
| 200 Series PCH SATA controller [AHCI mode] | 1 | 0.89% |
Storage Kind
Kind of storage controller (IDE, SATA, NVMe, SAS, ...)


| Kind | Computers | Percent |
|---|---|---|
| SATA | 62 | 62.63% |
| NVMe | 26 | 26.26% |
| IDE | 6 | 6.06% |
| RAID | 3 | 3.03% |
| SAS | 1 | 1.01% |
| SCSI | 1 | 1.01% |
CPU Vendor
Processor vendors


| Vendor | Computers | Percent |
|---|---|---|
| Intel | 63 | 80.77% |
| AMD | 15 | 19.23% |
CPU Model
Processor models


| Model | Computers | Percent |
|---|---|---|
| Intel Core i7-6700HQ CPU @ 2.60GHz | 4 | 5.13% |
| Intel Core i7-8550U CPU @ 1.80GHz | 3 | 3.85% |
| Intel Core i7-6600U CPU @ 2.60GHz | 3 | 3.85% |
| Intel Core i7-9750H CPU @ 2.60GHz | 2 | 2.56% |
| Intel Core i7-8650U CPU @ 1.90GHz | 2 | 2.56% |
| Intel Core i7-8565U CPU @ 1.80GHz | 2 | 2.56% |
| Intel Core i7-7500U CPU @ 2.70GHz | 2 | 2.56% |
| Intel Core i7-6700K CPU @ 4.00GHz | 2 | 2.56% |
| Intel Core i5-8265U CPU @ 1.60GHz | 2 | 2.56% |
| AMD Ryzen 7 3750H with Radeon Vega Mobile Gfx | 2 | 2.56% |
| Intel Xeon CPU E3-1230 V2 @ 3.30GHz | 1 | 1.28% |
| Intel Core m5-6Y57 CPU @ 1.10GHz | 1 | 1.28% |
| Intel Core i7-8750H CPU @ 2.20GHz | 1 | 1.28% |
| Intel Core i7-7700T CPU @ 2.90GHz | 1 | 1.28% |
| Intel Core i7-7700K CPU @ 4.20GHz | 1 | 1.28% |
| Intel Core i7-4770S CPU @ 3.10GHz | 1 | 1.28% |
| Intel Core i7-4720HQ CPU @ 2.60GHz | 1 | 1.28% |
| Intel Core i7-4510U CPU @ 2.00GHz | 1 | 1.28% |
| Intel Core i7-3770K CPU @ 3.50GHz | 1 | 1.28% |
| Intel Core i7-3520M CPU @ 2.90GHz | 1 | 1.28% |
| Intel Core i7-2600 CPU @ 3.40GHz | 1 | 1.28% |
| Intel Core i7-10710U CPU @ 1.10GHz | 1 | 1.28% |
| Intel Core i7-10510U CPU @ 1.80GHz | 1 | 1.28% |
| Intel Core i7 CPU Q 740 @ 1.73GHz | 1 | 1.28% |
| Intel Core i7 CPU 930 @ 2.80GHz | 1 | 1.28% |
| Intel Core i5-9400F CPU @ 2.90GHz | 1 | 1.28% |
| Intel Core i5-8300H CPU @ 2.30GHz | 1 | 1.28% |
| Intel Core i5-6300HQ CPU @ 2.30GHz | 1 | 1.28% |
| Intel Core i5-6200U CPU @ 2.30GHz | 1 | 1.28% |
| Intel Core i5-5300U CPU @ 2.30GHz | 1 | 1.28% |
| Intel Core i5-5200U CPU @ 2.20GHz | 1 | 1.28% |
| Intel Core i5-3470 CPU @ 3.20GHz | 1 | 1.28% |
| Intel Core i5-3450 CPU @ 3.10GHz | 1 | 1.28% |
| Intel Core i5-3320M CPU @ 2.60GHz | 1 | 1.28% |
| Intel Core i5-2540M CPU @ 2.60GHz | 1 | 1.28% |
| Intel Core i5-2520M CPU @ 2.50GHz | 1 | 1.28% |
| Intel Core i5-2430M CPU @ 2.40GHz | 1 | 1.28% |
| Intel Core i5-2400 CPU @ 3.10GHz | 1 | 1.28% |
| Intel Core i5 CPU M 560 @ 2.67GHz | 1 | 1.28% |
| Intel Core i5 CPU M 460 @ 2.53GHz | 1 | 1.28% |
| Intel Core i3-6006U CPU @ 2.00GHz | 1 | 1.28% |
| Intel Core i3-5005U CPU @ 2.00GHz | 1 | 1.28% |
| Intel Core i3-4160 CPU @ 3.60GHz | 1 | 1.28% |
| Intel Core i3-4005U CPU @ 1.70GHz | 1 | 1.28% |
| Intel Core 2 Duo CPU T9400 @ 2.53GHz | 1 | 1.28% |
| Intel Core 2 Duo CPU T8100 @ 2.10GHz | 1 | 1.28% |
| Intel Celeron N4100 CPU @ 1.10GHz | 1 | 1.28% |
| Intel Celeron CPU N3060 @ 1.60GHz | 1 | 1.28% |
| Intel Celeron CPU J1900 @ 1.99GHz | 1 | 1.28% |
| Intel Celeron CPU B800 @ 1.50GHz | 1 | 1.28% |
| Intel Atom CPU N2800 @ 1.86GHz | 1 | 1.28% |
| AMD Ryzen 9 3950X 16-Core Processor | 1 | 1.28% |
| AMD Ryzen 7 3700U with Radeon Vega Mobile Gfx | 1 | 1.28% |
| AMD Ryzen 7 2700 Eight-Core Processor | 1 | 1.28% |
| AMD Ryzen 7 1700 Eight-Core Processor | 1 | 1.28% |
| AMD Ryzen 5 3600 6-Core Processor | 1 | 1.28% |
| AMD Ryzen 5 3500U with Radeon Vega Mobile Gfx | 1 | 1.28% |
| AMD Ryzen 5 2400G with Radeon Vega Graphics | 1 | 1.28% |
| AMD Ryzen 3 2300U with Radeon Vega Mobile Gfx | 1 | 1.28% |
| AMD Ryzen 3 1300X Quad-Core Processor | 1 | 1.28% |
CPU Model Family
Processor model prefix

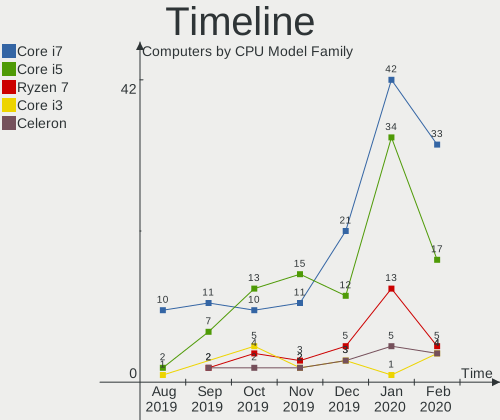
| Model | Computers | Percent |
|---|---|---|
| Intel Core i7 | 33 | 42.31% |
| Intel Core i5 | 17 | 21.79% |
| AMD Ryzen 7 | 5 | 6.41% |
| Intel Core i3 | 4 | 5.13% |
| Intel Celeron | 4 | 5.13% |
| AMD Ryzen 5 | 3 | 3.85% |
| AMD FX | 3 | 3.85% |
| Intel Core 2 Duo | 2 | 2.56% |
| AMD Ryzen 3 | 2 | 2.56% |
| Intel Xeon | 1 | 1.28% |
| Intel Core m5 | 1 | 1.28% |
| Intel Atom | 1 | 1.28% |
| AMD Ryzen 9 | 1 | 1.28% |
| AMD A8 | 1 | 1.28% |
CPU Cores
Number of processor cores


| Number | Computers | Percent |
|---|---|---|
| 4 | 41 | 52.56% |
| 2 | 28 | 35.9% |
| 6 | 6 | 7.69% |
| 8 | 2 | 2.56% |
| 16 | 1 | 1.28% |
CPU Sockets
Number of sockets


| Number | Computers | Percent |
|---|---|---|
| 1 | 77 | 98.72% |
| 2 | 1 | 1.28% |
CPU Threads
Threads per core (Hyper-Threading)


| Number | Computers | Percent |
|---|---|---|
| 2 | 64 | 82.05% |
| 1 | 14 | 17.95% |
CPU Op-Modes
CPU Operation Modes (32-bit, 64-bit)


| Op mode | Computers | Percent |
|---|---|---|
| 32-bit, 64-bit | 77 | 98.72% |
| Unknown | 1 | 1.28% |
CPU Microarch
Microarchitecture


| Name | Computers | Percent |
|---|---|---|
| Skylake | 26 | 33.33% |
| KabyLake | 7 | 8.97% |
| SandyBridge | 6 | 7.69% |
| IvyBridge | 6 | 7.69% |
| Zen+ | 5 | 6.41% |
| Haswell | 5 | 6.41% |
| Zen | 4 | 5.13% |
| Piledriver | 3 | 3.85% |
| Broadwell | 3 | 3.85% |
| Zen 2 | 2 | 2.56% |
| Westmere | 2 | 2.56% |
| Silvermont | 2 | 2.56% |
| Nehalem | 2 | 2.56% |
| Core | 2 | 2.56% |
| Goldmont plus | 1 | 1.28% |
| Excavator | 1 | 1.28% |
| Bonnell | 1 | 1.28% |
CPU Microcode
Microcode number


| Number | Computers | Percent |
|---|---|---|
| Unknown | 16 | 20.51% |
| 0x306a9 | 6 | 7.69% |
| 0x206a7 | 6 | 7.69% |
| 0x506e3 | 5 | 6.41% |
| 0x406e3 | 5 | 6.41% |
| 0x806ec | 4 | 5.13% |
| 0x806ea | 4 | 5.13% |
| 0x906ea | 3 | 3.85% |
| 0x08108102 | 3 | 3.85% |
| 0x806e9 | 2 | 2.56% |
| 0x40651 | 2 | 2.56% |
| 0x306d4 | 2 | 2.56% |
| 0x306c3 | 2 | 2.56% |
| 0x20655 | 2 | 2.56% |
| 0x06000822 | 2 | 2.56% |
| 0xa0660 | 1 | 1.28% |
| 0x706a1 | 1 | 1.28% |
| 0x406c4 | 1 | 1.28% |
| 0x106e5 | 1 | 1.28% |
| 0x1067a | 1 | 1.28% |
| 0x10676 | 1 | 1.28% |
| 0x08108109 | 1 | 1.28% |
| 0x08101016 | 1 | 1.28% |
| 0x0810100b | 1 | 1.28% |
| 0x0800820d | 1 | 1.28% |
| 0x08001138 | 1 | 1.28% |
| 0x08001126 | 1 | 1.28% |
| 0x06006118 | 1 | 1.28% |
| 0x06000817 | 1 | 1.28% |
GPU Vendor
Vendors of graphics cards


| Vendor | Computers | Percent |
|---|---|---|
| Intel | 51 | 52.04% |
| Nvidia | 30 | 30.61% |
| AMD | 16 | 16.33% |
| VMware | 1 | 1.02% |
GPU Model
Graphics card models


| Model | Computers | Percent |
|---|---|---|
| UHD Graphics 620 | 5 | 5.05% |
| Skylake GT2 [HD Graphics 520] | 5 | 5.05% |
| 2nd Generation Core Processor Family Integrated Graphics Controller | 5 | 5.05% |
| UHD Graphics 630 (Mobile) | 4 | 4.04% |
| UHD Graphics 620 (Whiskey Lake) | 4 | 4.04% |
| Picasso | 4 | 4.04% |
| HD Graphics 530 | 4 | 4.04% |
| HD Graphics 5500 | 3 | 3.03% |
| GM107M [GeForce GTX 960M] | 3 | 3.03% |
| Ellesmere [Radeon RX 470/480/570/570X/580/580X/590] | 3 | 3.03% |
| UHD Graphics | 2 | 2.02% |
| HD Graphics 620 | 2 | 2.02% |
| Hawaii PRO [Radeon R9 290/390] | 2 | 2.02% |
| Haswell-ULT Integrated Graphics Controller | 2 | 2.02% |
| GP108M [GeForce MX150] | 2 | 2.02% |
| GP107M [GeForce GTX 1050 Mobile] | 2 | 2.02% |
| GP104BM [GeForce GTX 1070 Mobile] | 2 | 2.02% |
| GP104 [GeForce GTX 1070] | 2 | 2.02% |
| Core Processor Integrated Graphics Controller | 2 | 2.02% |
| 3rd Gen Core processor Graphics Controller | 2 | 2.02% |
| Xeon E3-1200 v3/4th Gen Core Processor Integrated Graphics Controller | 1 | 1.01% |
| Xeon E3-1200 v2/3rd Gen Core processor Graphics Controller | 1 | 1.01% |
| UHD Graphics 605 | 1 | 1.01% |
| Turks XT [Radeon HD 6670/7670] | 1 | 1.01% |
| TU117M [GeForce GTX 1650 Mobile / Max-Q] | 1 | 1.01% |
| TU116M [GeForce GTX 1660 Ti Mobile] | 1 | 1.01% |
| TU106M [GeForce RTX 2070 Mobile] | 1 | 1.01% |
| TU106M [GeForce RTX 2060 Mobile] | 1 | 1.01% |
| Topaz XT [Radeon R7 M260/M265 / M340/M360 / M440/M445 / 530/535 / 620/625 Mobile] | 1 | 1.01% |
| SVGA II Adapter | 1 | 1.01% |
| Raven Ridge [Radeon Vega Series / Radeon Vega Mobile Series] | 1 | 1.01% |
| Oland PRO [Radeon R7 240/340] | 1 | 1.01% |
| Mobile GM965/GL960 Integrated Graphics Controller (secondary) | 1 | 1.01% |
| Mobile GM965/GL960 Integrated Graphics Controller (primary) | 1 | 1.01% |
| Mobile 4 Series Chipset Integrated Graphics Controller | 1 | 1.01% |
| Lexa XT [Radeon PRO WX 3200] | 1 | 1.01% |
| HD Graphics 630 | 1 | 1.01% |
| HD Graphics 515 | 1 | 1.01% |
| GT218M [GeForce 310M] | 1 | 1.01% |
| GT215M [GeForce GT 335M] | 1 | 1.01% |
| GP108M [GeForce MX250] | 1 | 1.01% |
| GP107 [GeForce GTX 1050 Ti] | 1 | 1.01% |
| GP106M [GeForce GTX 1060 Mobile] | 1 | 1.01% |
| GP106 [GeForce GTX 1060 6GB] | 1 | 1.01% |
| GP102 [GeForce GTX 1080 Ti] | 1 | 1.01% |
| GM204 [GeForce GTX 980] | 1 | 1.01% |
| GM107M [GeForce GTX 950M] | 1 | 1.01% |
| GK107 [GeForce GT 740] | 1 | 1.01% |
| GK107 [GeForce GT 640] | 1 | 1.01% |
| GK106 [GeForce GTX 660] | 1 | 1.01% |
| GF108M [GeForce GT 635M] | 1 | 1.01% |
| GF108M [GeForce GT 540M] | 1 | 1.01% |
| GF106GLM [Quadro 2000M] | 1 | 1.01% |
| Cedar [Radeon HD 5000/6000/7350/8350 Series] | 1 | 1.01% |
| Baffin [Radeon RX 460/560D / Pro 450/455/460/555/555X/560/560X] | 1 | 1.01% |
| Atom/Celeron/Pentium Processor x5-E8000/J3xxx/N3xxx Integrated Graphics Controller | 1 | 1.01% |
| Atom Processor Z36xxx/Z37xxx Series Graphics & Display | 1 | 1.01% |
| Atom Processor D2xxx/N2xxx Integrated Graphics Controller | 1 | 1.01% |
| 4th Gen Core Processor Integrated Graphics Controller | 1 | 1.01% |
GPU Combo
Combinations of graphics cards


| Name | Computers | Percent |
|---|---|---|
| 1 x Intel | 32 | 41.03% |
| Intel + Nvidia | 15 | 19.23% |
| 1 x Nvidia | 13 | 16.67% |
| 1 x AMD | 12 | 15.38% |
| Intel + AMD | 2 | 2.56% |
| AMD + Nvidia | 2 | 2.56% |
| Other | 1 | 1.28% |
| 1 x VMware | 1 | 1.28% |
GPU Driver
Free vs proprietary


| Driver | Computers | Percent |
|---|---|---|
| Free | 56 | 71.79% |
| Proprietary | 18 | 23.08% |
| Unknown | 4 | 5.13% |
GPU Memory
Total video memory


| Size in GB | Computers | Percent |
|---|---|---|
| Unknown | 47 | 60.26% |
| 3.01-4.0 | 8 | 10.26% |
| 7.01-8.0 | 7 | 8.97% |
| 1.01-2.0 | 7 | 8.97% |
| 5.01-6.0 | 3 | 3.85% |
| 0.51-1.0 | 3 | 3.85% |
| 0.01-0.5 | 2 | 2.56% |
| 8.01-16.0 | 1 | 1.28% |
Monitor Vendor
Monitor vendors


| Vendor | Computers | Percent |
|---|---|---|
| AU Optronics | 13 | 14.77% |
| Chimei Innolux | 10 | 11.36% |
| Samsung Electronics | 8 | 9.09% |
| LG Display | 8 | 9.09% |
| BOE | 8 | 9.09% |
| Dell | 7 | 7.95% |
| Lenovo | 4 | 4.55% |
| Goldstar | 3 | 3.41% |
| Ancor Communications | 3 | 3.41% |
| Acer | 3 | 3.41% |
| Philips | 2 | 2.27% |
| PANDA | 2 | 2.27% |
| InfoVision | 2 | 2.27% |
| Apple | 2 | 2.27% |
| Vestel Elektronik | 1 | 1.14% |
| Unknown | 1 | 1.14% |
| RAT | 1 | 1.14% |
| Panasonic | 1 | 1.14% |
| MStar | 1 | 1.14% |
| Medion | 1 | 1.14% |
| LGD | 1 | 1.14% |
| LG Electronics | 1 | 1.14% |
| JDI | 1 | 1.14% |
| Iiyama | 1 | 1.14% |
| Hewlett-Packard | 1 | 1.14% |
| DSC | 1 | 1.14% |
| BenQ | 1 | 1.14% |
Monitor Model
Monitor models


| Model | Computers | Percent |
|---|---|---|
| LCD Monitor LGD046F 1920x1080 344x194mm 15.5-inch | 2 | 2.27% |
| Z24i HWP309E 1920x1200 518x324mm 24.1-inch | 1 | 1.14% |
| XL2720T BNQ7F13 1920x1080 600x340mm 27.2-inch | 1 | 1.14% |
| VVX13F009G00 MEI96A2 1920x1080 290x170mm 13.2-inch | 1 | 1.14% |
| Ultra HD GSM5B09 3840x2160 600x340mm 27.2-inch | 1 | 1.14% |
| U2518D DEL413A 2560x1440 553x311mm 25.0-inch | 1 | 1.14% |
| U2413 DELF046 1920x1080 520x320mm 24.0-inch | 1 | 1.14% |
| SyncMaster SAM0594 1680x1050 459x296mm 21.5-inch | 1 | 1.14% |
| SyncMaster SAM0586 1920x1200 518x324mm 24.1-inch | 1 | 1.14% |
| SyncMaster SAM037C 1680x1050 474x296mm 22.0-inch | 1 | 1.14% |
| S34J55x SAM0F72 3440x1440 797x333mm 34.0-inch | 1 | 1.14% |
| S27D390 SAM0B67 1920x1080 600x340mm 27.2-inch | 1 | 1.14% |
| S20D300 SAM0B3A 1600x900 432x240mm 19.5-inch | 1 | 1.14% |
| PL2409HD IVM560C 1920x1080 521x293mm 23.5-inch | 1 | 1.14% |
| PHL BDM4065 PHL08E1 1920x1080 880x490mm 39.7-inch | 1 | 1.14% |
| Paperlike H D DSC0001 2200x1650 200x150mm 9.8-inch | 1 | 1.14% |
| P2419H DELD0D9 1920x1080 527x296mm 23.8-inch | 1 | 1.14% |
| P2317H DEL40F3 1920x1080 509x286mm 23.0-inch | 1 | 1.14% |
| P2210 DEL404E 1680x1050 474x296mm 22.0-inch | 1 | 1.14% |
| MONITOR-DP RAT2700 2560x1440 597x336mm 27.0-inch | 1 | 1.14% |
| MD41887FO MEDD7A8 1280x1024 338x270mm 17.0-inch | 1 | 1.14% |
| LT1952p Wide LEN0990 1440x900 408x255mm 18.9-inch | 1 | 1.14% |
| LG FULL HD GSM5AB9 1680x1050 480x270mm 21.7-inch | 1 | 1.14% |
| LCD Monitor SEC384A 1366x768 344x194mm 15.5-inch | 1 | 1.14% |
| LCD Monitor SDC324C 1920x1080 344x194mm 15.5-inch | 1 | 1.14% |
| LCD Monitor PHL 276E8V | 1 | 1.14% |
| LCD Monitor P2418HT 1920x1080 | 1 | 1.14% |
| LCD Monitor NCP002D 1920x1080 344x194mm 15.5-inch | 1 | 1.14% |
| LCD Monitor LGD0554 3240x2160 317x211mm 15.0-inch | 1 | 1.14% |
| LCD Monitor LGD0534 1920x1080 344x194mm 15.5-inch | 1 | 1.14% |
| LCD Monitor LGD0533 1920x1080 344x194mm 15.5-inch | 1 | 1.14% |
| LCD Monitor LGD0490 1920x1080 309x174mm 14.0-inch | 1 | 1.14% |
| LCD Monitor LGD02DC 1366x768 344x194mm 15.5-inch | 1 | 1.14% |
| LCD Monitor LGD01B5 1366x768 310x174mm 14.0-inch | 1 | 1.14% |
| LCD Monitor LEN40B1 1600x900 344x194mm 15.5-inch | 1 | 1.14% |
| LCD Monitor LEN40A0 1366x768 309x174mm 14.0-inch | 1 | 1.14% |
| LCD Monitor LEN4031 1280x800 303x190mm 14.1-inch | 1 | 1.14% |
| LCD Monitor Kingston Technology 55'TV | 1 | 1.14% |
| LCD Monitor JDI422A 3000x2000 293x196mm 13.9-inch | 1 | 1.14% |
| LCD Monitor IVO057C 1366x768 310x170mm 13.9-inch | 1 | 1.14% |
| LCD Monitor IVO04B2 2160x1440 254x169mm 12.0-inch | 1 | 1.14% |
| LCD Monitor E2442 1920x1080 | 1 | 1.14% |
| LCD Monitor CMN1738 1920x1080 381x214mm 17.2-inch | 1 | 1.14% |
| LCD Monitor CMN15DB 1366x768 344x193mm 15.5-inch | 1 | 1.14% |
| LCD Monitor CMN15BF 1366x768 344x193mm 15.5-inch | 1 | 1.14% |
| LCD Monitor CMN1510 1920x1080 344x193mm 15.5-inch | 1 | 1.14% |
| LCD Monitor CMN14D5 1920x1080 309x173mm 13.9-inch | 1 | 1.14% |
| LCD Monitor CMN14D4 1920x1080 309x173mm 13.9-inch | 1 | 1.14% |
| LCD Monitor CMN14C9 1920x1080 309x173mm 13.9-inch | 1 | 1.14% |
| LCD Monitor CMN14A3 1600x900 309x174mm 14.0-inch | 1 | 1.14% |
| LCD Monitor CMN1490 1366x768 309x173mm 13.9-inch | 1 | 1.14% |
| LCD Monitor CMN1361 1920x1080 290x170mm 13.2-inch | 1 | 1.14% |
| LCD Monitor BOE0868 1920x1080 309x174mm 14.0-inch | 1 | 1.14% |
| LCD Monitor BOE0812 1920x1080 344x194mm 15.5-inch | 1 | 1.14% |
| LCD Monitor BOE07DB 1920x1080 309x174mm 14.0-inch | 1 | 1.14% |
| LCD Monitor BOE0791 1920x1080 309x173mm 13.9-inch | 1 | 1.14% |
| LCD Monitor BOE0700 1920x1080 344x194mm 15.5-inch | 1 | 1.14% |
| LCD Monitor BOE06BA 1920x1080 344x193mm 15.5-inch | 1 | 1.14% |
| LCD Monitor BOE065D 1920x1080 344x194mm 15.5-inch | 1 | 1.14% |
| LCD Monitor BOE05C7 1366x768 309x173mm 13.9-inch | 1 | 1.14% |
Monitor Resolution
Monitor screen resolution


| Resolution | Computers | Percent |
|---|---|---|
| 1920x1080 (FHD) | 40 | 48.19% |
| 1366x768 (WXGA) | 14 | 16.87% |
| 2560x1440 (QHD) | 6 | 7.23% |
| 3840x2160 (4K) | 3 | 3.61% |
| 1920x1200 (WUXGA) | 3 | 3.61% |
| 1680x1050 (WSXGA+) | 3 | 3.61% |
| 1600x900 (HD+) | 3 | 3.61% |
| 1280x800 (WXGA) | 2 | 2.41% |
| 3440x1440 | 1 | 1.2% |
| 3240x2160 | 1 | 1.2% |
| 3000x2000 | 1 | 1.2% |
| 2256x1504 | 1 | 1.2% |
| 2200x1650 | 1 | 1.2% |
| 2160x1440 | 1 | 1.2% |
| 1440x900 (WXGA+) | 1 | 1.2% |
| 1280x1024 (SXGA) | 1 | 1.2% |
| Unknown | 1 | 1.2% |
Monitor Diagonal
Diagonal size in inches


| Inches | Computers | Percent |
|---|---|---|
| 15 | 24 | 27.59% |
| 13 | 14 | 16.09% |
| 14 | 10 | 11.49% |
| 27 | 8 | 9.2% |
| 23 | 6 | 6.9% |
| 24 | 5 | 5.75% |
| Unknown | 4 | 4.6% |
| 21 | 3 | 3.45% |
| 17 | 3 | 3.45% |
| 22 | 2 | 2.3% |
| 39 | 1 | 1.15% |
| 34 | 1 | 1.15% |
| 32 | 1 | 1.15% |
| 25 | 1 | 1.15% |
| 19 | 1 | 1.15% |
| 18 | 1 | 1.15% |
| 12 | 1 | 1.15% |
| 9 | 1 | 1.15% |
Monitor Width
Physical width


| Width in mm | Computers | Percent |
|---|---|---|
| 301-350 | 44 | 51.76% |
| 501-600 | 19 | 22.35% |
| 401-500 | 6 | 7.06% |
| 201-300 | 6 | 7.06% |
| Unknown | 4 | 4.71% |
| 701-800 | 2 | 2.35% |
| 351-400 | 2 | 2.35% |
| 801-900 | 1 | 1.18% |
| 101-200 | 1 | 1.18% |
Aspect Ratio
Proportional relationship between the width and the height


| Ratio | Computers | Percent |
|---|---|---|
| 16/9 | 58 | 75.32% |
| 16/10 | 8 | 10.39% |
| 3/2 | 4 | 5.19% |
| Unknown | 4 | 5.19% |
| 5/4 | 1 | 1.3% |
| 4/3 | 1 | 1.3% |
| 21/9 | 1 | 1.3% |
Monitor Area
Area in inch²


| Area in inch² | Computers | Percent |
|---|---|---|
| 101-110 | 24 | 27.91% |
| 81-90 | 21 | 24.42% |
| 201-250 | 12 | 13.95% |
| 301-350 | 8 | 9.3% |
| 251-300 | 4 | 4.65% |
| Unknown | 4 | 4.65% |
| 71-80 | 3 | 3.49% |
| 351-500 | 2 | 2.33% |
| 151-200 | 2 | 2.33% |
| 121-130 | 2 | 2.33% |
| 61-70 | 1 | 1.16% |
| 41-50 | 1 | 1.16% |
| 141-150 | 1 | 1.16% |
| 501-1000 | 1 | 1.16% |
Pixel Density
Pixels per inch


| Density | Computers | Percent |
|---|---|---|
| 121-160 | 26 | 30.59% |
| 101-120 | 25 | 29.41% |
| 51-100 | 20 | 23.53% |
| 161-240 | 6 | 7.06% |
| More than 240 | 4 | 4.71% |
| Unknown | 4 | 4.71% |
Multiple Monitors
Total monitors connected


| Total | Computers | Percent |
|---|---|---|
| 1 | 58 | 74.36% |
| 2 | 13 | 16.67% |
| 0 | 4 | 5.13% |
| 3 | 3 | 3.85% |
Net Controller Vendor
Controller vendors


| Vendor | Computers | Percent |
|---|---|---|
| Intel | 9 | 60% |
| Realtek Semiconductor | 3 | 20% |
| Sierra Wireless | 2 | 13.33% |
| Kontron (Industrial Computer Source / ICS Advent) | 1 | 6.67% |
Net Controller Model
Controller models


| Model | Computers | Percent |
|---|---|---|
| Wi-Fi 6 AX200 | 4 | 22.22% |
| Centrino Advanced-N 6205 [Taylor Peak] | 2 | 11.11% |
| RTL8822CE 802.11ac PCIe Wireless Network Adapter | 1 | 5.56% |
| RTL8153 Gigabit Ethernet Adapter | 1 | 5.56% |
| RTL8125 2.5GbE Controller | 1 | 5.56% |
| MC8305 | 1 | 5.56% |
| EM7455 Qualcomm Snapdragon X7 LTE-A | 1 | 5.56% |
| DM9601 Fast Ethernet Adapter | 1 | 5.56% |
| Centrino Advanced-N 6200 | 1 | 5.56% |
| 82579V Gigabit Network Connection | 1 | 5.56% |
| 82579LM Gigabit Network Connection (Lewisville) | 1 | 5.56% |
| 82577LM Gigabit Network Connection | 1 | 5.56% |
| 82574L Gigabit Network Connection | 1 | 5.56% |
| 82567LM Gigabit Network Connection | 1 | 5.56% |
Net Controller Kind
Ethernet, WiFi or modem


| Kind | Computers | Percent |
|---|---|---|
| WiFi | 9 | 52.94% |
| Ethernet | 8 | 47.06% |
Used Controller
Currently used network controller


| Kind | Computers | Percent |
|---|---|---|
| WiFi | 6 | 66.67% |
| Ethernet | 3 | 33.33% |
NICs
Total network controllers on board


| Total | Computers | Percent |
|---|---|---|
| 2 | 45 | 57.69% |
| 1 | 32 | 41.03% |
| 3 | 1 | 1.28% |
Unsupported Devices
Total unsupported devices on board


| Total | Computers | Percent |
|---|---|---|
| 0 | 56 | 71.79% |
| 1 | 18 | 23.08% |
| 2 | 3 | 3.85% |
| 4 | 1 | 1.28% |
Unsupported Device Types
Types of unsupported devices


| Type | Computers | Percent |
|---|---|---|
| Fingerprint reader | 8 | 28.57% |
| Chipcard | 7 | 25% |
| Graphics card | 5 | 17.86% |
| Net/wireless | 4 | 14.29% |
| Storage | 1 | 3.57% |
| Card reader | 1 | 3.57% |
| Camera | 1 | 3.57% |
| Bluetooth | 1 | 3.57% |